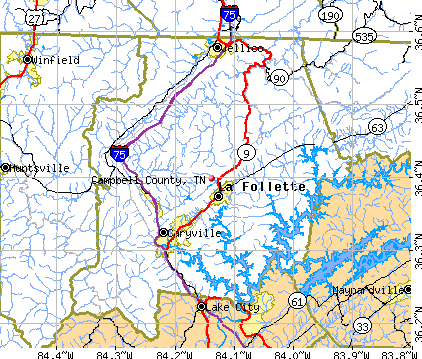
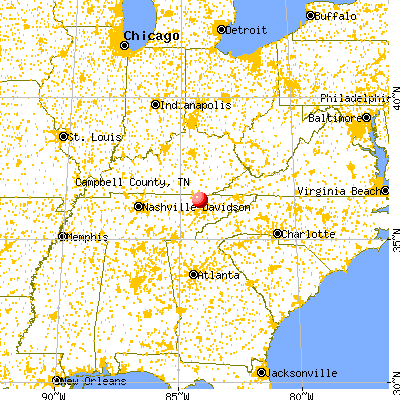
Campbell County, Tennessee (TN)
County owner-occupied free and clear houses and condos in 2010: 5,185
County owner-occupied houses and condos in 2000: 11,842
Renter-occupied apartments: 4,733 (it was 4,283 in 2000)
| % of renters here: | 27% |
| State: | 32% |
Land area: 480 sq. mi.
Water area: 18.2 sq. mi.
Population density: 84 people per square mile (average).
Industries providing employment: Educational, health and social services (21.9%), Manufacturing (15.4%), Construction (13.9%), Retail trade (10.6%).
Type of workers:
- Private wage or salary: 74%
- Government: 18%
- Self-employed, not incorporated: 8%
- Unpaid family work: 0%
- OSM Map
- General Map
- Google Map
- MSN Map

- 38,10595.2%White Non-Hispanic Alone
- 8682.2%Two or more races
- 7091.8%Hispanic or Latino
- 1820.5%Asian alone
- 1140.3%Black Non-Hispanic Alone
- 160.04%Some other race alone
- 130.03%American Indian and Alaska Native alone

| Median resident age: | 44.5 years |
| Tennessee median age: | 39.2 years |
| Males: 19,861 | |
| Females: 20,261 |

 | Does this exist in TN anywhere- a little desperate for help (21 replies) |
| COVID-19 in Tennessee (237 replies) |
| Campbell, Jefferson, Greene & Loudon Counties (6 replies) |
| Tennessee Population Estimates 2016 (28 replies) |
| Progressive areas around Knoxville (49 replies) |
| News, State of emergency declared in TN due to winter weather (14 replies) |
| Campbell County: | 2.0 people |
| Tennessee: | 2 people |
Estimated median household income in 2022: $49,176 ($25,285 in 1999)
| This county: | $49,176 |
| Tennessee: | $65,254 |
Median contract rent in 2022 for apartments: $513 (lower quartile is $353, upper quartile is $616)
| This county: | $513 |
| State: | $884 |
Estimated median house or condo value in 2022: $174,365 (it was $57,700 in 2000)
| Campbell: | $174,365 |
| Tennessee: | $284,800 |
Median monthly housing costs for homes and condos with a mortgage: $1,120
Median monthly housing costs for units without a mortgage: $376
Institutionalized population: 492
Crime in 2021 (reported by the sheriff's office or county police, not the county total):
- Murders: 1
- Rapes: 9
- Robberies: 1
- Assaults: 44
- Burglaries: 56
- Thefts: 109
- Auto thefts: 42
Crime in 2020 (reported by the sheriff's office or county police, not the county total):
- Murders: 1
- Rapes: 8
- Robberies: 0
- Assaults: 25
- Burglaries: 36
- Thefts: 53
- Auto thefts: 20
Single-family new house construction building permits:
- 2022: 129 buildings, average cost: $243,000
- 2021: 388 buildings, average cost: $105,100
- 2020: 337 buildings, average cost: $103,300
- 2019: 266 buildings, average cost: $102,800
- 2018: 264 buildings, average cost: $102,600
- 2017: 237 buildings, average cost: $102,200
- 2016: 211 buildings, average cost: $108,000
- 2015: 191 buildings, average cost: $106,900
- 2014: 151 buildings, average cost: $109,100
- 2013: 159 buildings, average cost: $105,500
- 2012: 131 buildings, average cost: $106,200
- 2011: 132 buildings, average cost: $102,500
- 2010: 135 buildings, average cost: $103,700
- 2009: 150 buildings, average cost: $106,800
- 2008: 228 buildings, average cost: $105,600
- 2007: 28 buildings, average cost: $81,700
- 2006: 40 buildings, average cost: $77,500
- 2005: 33 buildings, average cost: $68,800
- 2004: 23 buildings, average cost: $68,200
- 2003: 43 buildings, average cost: $73,700
- 2002: 45 buildings, average cost: $74,600
- 2001: 48 buildings, average cost: $58,100
- 2000: 36 buildings, average cost: $46,800
- 1999: 57 buildings, average cost: $39,300
- 1998: 44 buildings, average cost: $43,100
- 1997: 49 buildings, average cost: $37,000


Median real estate property taxes paid for housing units with mortgages in 2022: $791 (0.4%)
Median real estate property taxes paid for housing units with no mortgage in 2022: $524 (0.4%)


| Campbell County: | 18.5% |
| Tennessee: | 13.3% |
Median age of residents in 2022: 44.5 years old
(Males: 43.4 years old, Females: 45.4 years old)
(Median age for: White residents: 44.4 years old, Black residents: 55.9 years old, American Indian residents: 45.5 years old, Asian residents: 21.7 years old, Hispanic or Latino residents: 40.9 years old, Other race residents: 45.2 years old)
Fair market rent in 2006 for a 1-bedroom apartment in Campbell County is $383 a month.
Fair market rent for a 2-bedroom apartment is $460 a month.
Fair market rent for a 3-bedroom apartment is $592 a month.
Cities in this county include: La Follette, Fincastle, Elk Valley, Habersham, Jellico, Caryville, Jacksboro, Clinchmore.
Neighboring counties: Davidson County  , Fulton County, Kentucky , Sullivan County
  , Washington County , Taney County, Missouri .
| Here: | 3.6% |
| Tennessee: | 3.0% |


Current college students: 809
People 25 years of age or older with a high school degree or higher: 81.2%
People 25 years of age or older with a bachelor's degree or higher: 12.9%
Number of foreign born residents: 397 (49.4% naturalized citizens)
| Campbell County: | 1.0% |
| Whole state: | 5.6% |

- Year of entry for the foreign-born population
- 1122010 or later
- 1392000 to 2009
- 1041990 to 1999
- 571980 to 1989
- 241970 to 1979
- 33Before 1970
Mean travel time to work (commute): minutes
Percentage of county residents living and working in this county: 94.2%
Housing units in structures:
- One, detached: 14,672
- One, attached: 214
- Two: 370
- 3 or 4: 696
- 5 to 9: 727
- 10 to 19: 302
- 20 to 49: 244
- 50 or more: 261
- Mobile homes: 3,121
- Boats, RVs, vans, etc.: 6
Housing units in Campbell County with a mortgage: 5,532 (248 second mortgage, 0 home equity loan, 226 both second mortgage and home equity loan)
Houses without a mortgage: 47
| Here: | 9.6% with mortgage |
| State: | 97.8% with mortgage |
Religion statistics for Campbell County
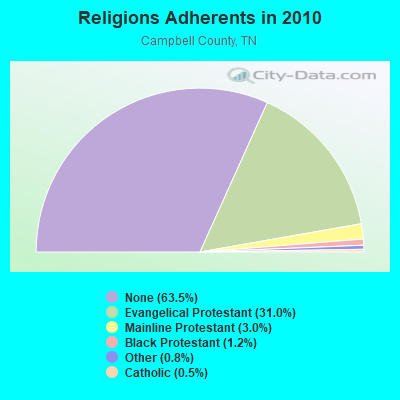
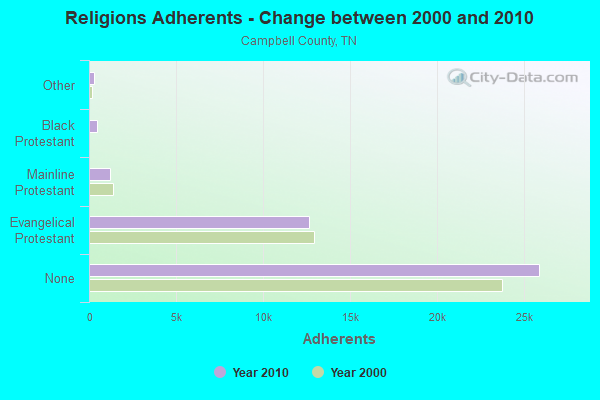
| Religion | Adherents | Congregations |
|---|---|---|
| Evangelical Protestant | 12,641 | 56 |
| Mainline Protestant | 1,231 | 9 |
| Black Protestant | 481 | 3 |
| Other | 311 | 3 |
| Catholic | 190 | 1 |
| None | 25,862 | - |
Source: Clifford Grammich, Kirk Hadaway, Richard Houseal, Dale E.Jones, Alexei Krindatch, Richie Stanley and Richard H.Taylor. 2012. 2010 U.S.Religion Census: Religious Congregations & Membership Study. Association of Statisticians of American Religious Bodies. Jones, Dale E., et al. 2002. Congregations and Membership in the United States 2000. Nashville, TN: Glenmary Research Center.
Food Environment Statistics:
| Campbell County: | 2.46 / 10,000 pop. |
| State: | 1.99 / 10,000 pop. |
| Here: | 0.25 / 10,000 pop. |
| Tennessee: | 0.17 / 10,000 pop. |
| This county: | 0.25 / 10,000 pop. |
| Tennessee: | 0.65 / 10,000 pop. |
| Campbell County: | 6.88 / 10,000 pop. |
| Tennessee: | 5.16 / 10,000 pop. |
| This county: | 3.44 / 10,000 pop. |
| State: | 6.56 / 10,000 pop. |
| Campbell County: | 13.3% |
| Tennessee: | 11.4% |
| Campbell County: | 30.7% |
| State: | 30.2% |
| Here: | 15.7% |
| State: | 13.5% |
Agriculture in Campbell County:
Average size of farms: 82 acresAverage value of agricultural products sold per farm: $8,135
Average value of crops sold per acre for harvested cropland: $124.12
The value of nursery, greenhouse, floriculture, and sod as a percentage of the total market value of agricultural products sold: 9.94%
The value of livestock, poultry, and their products as a percentage of the total market value of agricultural products sold: 66.04%
Average total farm production expenses per farm: $6,310
Harvested cropland as a percentage of land in farms: 27.16%
Average market value of all machinery and equipment per farm: $31,950
The percentage of farms operated by a family or individual: 95.47%
Average age of principal farm operators: 56 years
Average number of cattle and calves per 100 acres of all land in farms: 37.17
Milk cows as a percentage of all cattle and calves: 0.90%
Corn for grain: 452 harvested acres
Vegetables: 36 harvested acres
Land in orchards: 18 acres
Earthquake activity:
Campbell County-area historical earthquake activity is significantly above Tennessee state average. It is 82% greater than the overall U.S. average.On 7/27/1980 at 18:52:21, a magnitude 5.2 (5.1 MB, 4.7 MS, 5.0 UK, 5.2 UK, Class: Moderate, Intensity: VI - VII) earthquake occurred 125.5 miles away from Campbell County center
On 11/30/1973 at 07:48:41, a magnitude 4.7 (4.7 MB, 4.6 ML, Class: Light, Intensity: IV - V) earthquake occurred 42.5 miles away from the county center
On 8/9/2020 at 12:07:37, a magnitude 5.1 (5.1 MW, Depth: 4.7 mi) earthquake occurred 169.6 miles away from the county center
On 4/18/2008 at 09:36:59, a magnitude 5.4 (5.1 MB, 4.8 MS, 5.4 MW, 5.2 MW) earthquake occurred 250.1 miles away from the county center
On 4/29/2003 at 08:59:39, a magnitude 4.9 (4.4 MB, 4.6 MW, 4.9 LG) earthquake occurred 156.1 miles away from Campbell County center
On 12/12/2018 at 09:14:43, a magnitude 4.4 (4.4 MW, Depth: 4.9 mi) earthquake occurred 63.6 miles away from the county center
Magnitude types: regional Lg-wave magnitude (LG), body-wave magnitude (MB), local magnitude (ML), surface-wave magnitude (MS), moment magnitude (MW)
Most recent natural disasters:
- Tennessee Severe Storms, Tornadoes, Straight-line Winds, And Flooding, Incident Period: April 12, 2020 - April 13, 2020, FEMA Id: 4541, Natural disaster type: Storm, Tornado, Flood, Wind
- Tennessee Covid-19 Pandemic, Incident Period: January 20, 2020, FEMA Id: 4514, Natural disaster type: Other
- Tennessee Severe Storms, Flooding, Landslides, And Mudslides, Incident Period: February 19, 2019 - March 30, 2019, FEMA Id: 4427, Natural disaster type: Storm, Mudslide, Landslide, Flood
- Tennessee Severe Winter Storm and Flooding, Incident Period: February 15, 2015 to February 23, 2015, Major Disaster (Presidential) Declared DR-4211: April 02, 2015, FEMA Id: 4211, Natural disaster type: Winter Storm, Flood
- Tennessee Severe Storms, Tornadoes, Straight-line Winds, and Associated Flooding, Incident Period: April 25, 2011 to April 28, 2011, Major Disaster (Presidential) Declared DR-1974: May 01, 2011, FEMA Id: 1974, Natural disaster type: Storm, Tornado, Flood, Wind
- Tennessee Severe Storms, Flooding, Straight-Line Winds, and Tornadoes, Incident Period: April 30, 2010 to May 18, 2010, Major Disaster (Presidential) Declared DR-1909: May 04, 2010, FEMA Id: 1909, Natural disaster type: Storm, Tornado, Flood, Wind
- Tennessee Hurricane Katrina Evacuation, Incident Period: August 29, 2005 to October 01, 2005, Emergency Declared EM-3217: September 05, 2005, FEMA Id: 3217, Natural disaster type: Hurricane
- Tennessee Severe Storms and Flooding, Incident Period: September 16, 2004 to September 20, 2004, Major Disaster (Presidential) Declared DR-1568: October 07, 2004, FEMA Id: 1568, Natural disaster type: Storm, Flood
- Tennessee Severe Storms, Tornadoes and Flooding, Incident Period: May 04, 2003 to May 30, 2003, Major Disaster (Presidential) Declared DR-1464: May 08, 2003, FEMA Id: 1464, Natural disaster type: Storm, Tornado, Flood
- Tennessee Severe Storms and Flooding, Incident Period: February 14, 2003 to February 26, 2003, Major Disaster (Presidential) Declared DR-1456: March 20, 2003, FEMA Id: 1456, Natural disaster type: Storm, Flood
- 9 other natural disasters have been reported since 1953.
The number of natural disasters in Campbell County (19) is greater than the US average (15).
Major Disasters (Presidential) Declared: 14
Emergencies Declared: 2
Causes of natural disasters: Floods: 14, Storms: 12, Tornadoes: 5, Winter Storms: 4, Winds: 3, Flash Flood: 1, Heavy Rain: 1, Hurricane: 1, Ice Storm: 1, Landslide: 1, Mudslide: 1, Snowfall: 1, Other: 1 (Note: some incidents may be assigned to more than one category).

Means of transportation to work:
- Drove a car alone: 8,230 (76.7%)
- Carpooled: 972 (9.1%)
- Taxicab, motorcycle, or other means: 39 (0.4%)
- Bicycle: 9 (0.1%)
- Walked: 56 (0.5%)
- Worked at home: 1,403 (13.1%)


- Health care and social assistance (23%)
- Manufacturing (12%)
- Educational services (12%)
- Retail trade (9%)
- Accommodation and food services (8%)
- Public administration (5%)
- Finance and insurance (4%)

- Health care and social assistance (26%)
- Manufacturing (13%)
- Educational services (13%)
- Retail trade (10%)
- Accommodation and food services (9%)
- Public administration (5%)
- Finance and insurance (4%)

- Construction and extraction occupations (19%)
- Production occupations (13%)
- Management occupations (10%)
- Sales and related occupations (9%)
- Installation, maintenance, and repair occupations (9%)
- Transportation occupations (8%)
- Material moving occupations (5%)

- Office and administrative support occupations (14%)
- Sales and related occupations (10%)
- Food preparation and serving related occupations (9%)
- Production occupations (9%)
- Healthcare support occupations (9%)
- Educational instruction, and library occupations (8%)
- Management occupations (8%)

- Mexico (23%)
- India (14%)
- Germany (12%)
- China, excluding Hong Kong and Taiwan (11%)
- Brazil (10%)
- Romania (8%)
- Guatemala (7%)

- American (22%)
- English (19%)
- Irish (9%)
- German (8%)
- Scottish (7%)
- Italian (3%)
- European (2%)


People in group quarters in Campbell County, Tennessee in 2010:
- 358 people in nursing facilities/skilled-nursing facilities
- 134 people in local jails and other municipal confinement facilities
- 20 people in group homes intended for adults
- 7 people in residential treatment centers for adults
People in group quarters in Campbell County, Tennessee in 2000:
- 372 people in nursing homes
- 84 people in local jails and other confinement facilities (including police lockups)
- 23 people in other noninstitutional group quarters
- 14 people in homes for the mentally retarded
- 6 people in training schools for juvenile delinquents
7.27% of this county's 2021 resident taxpayers lived in other counties in 2020 ($69,136 average adjusted gross income)
| Here: | 7.27% |
| Tennessee average: | 8.49% |
10 or fewer of this county's residents moved from foreign countries.
3.60% relocated from other counties in Tennessee ($22,370 average AGI)
3.66% relocated from other states ($46,766 average AGI)
Campbell County: 3.66% Tennessee average: 4.34%

Top counties from which taxpayers relocated into this county between 2020 and 2021:
| from Anderson County, TN | |
| from Knox County, TN | |
| from Claiborne County, TN | |
| from Whitley County, KY | |
| from Scott County, TN |
5.35% of this county's 2020 resident taxpayers moved to other counties in 2021 ($49,945 average adjusted gross income)
| Here: | 5.35% |
| Tennessee average: | 7.40% |
10 or fewer of this county's residents moved to foreign countries.
3.28% relocated to other counties in Tennessee ($24,394 average AGI)
2.07% relocated to other states ($25,549 average AGI)
Campbell County: 2.07% Tennessee average: 3.20%

Top counties to which taxpayers relocated from this county between 2020 and 2021:
| to Anderson County, TN | |
| to Knox County, TN | |
| to Claiborne County, TN | |
| to Whitley County, KY | |
| to Scott County, TN |
Births per 1000 population from 1990 to 1999: 12.6
Births per 1000 population from 2000 to 2006: 12.1

Deaths per 1000 population from 1990 to 1999: 11.0
Deaths per 1000 population from 2000 to 2009: 12.0
Deaths per 1000 population from 2010 to 2020: 14.5

Infant deaths per 1000 live births from 1990 to 1999: 8.4
Infant deaths per 1000 live births from 2000 to 2006: 7.6

Persons under 19 years old without health insurance coverage in 2018: 5.0%


Persons enrolled in hospital insurance and/or supplemental medical insurance (Medicare) in July 1, 2007: 9,135 (6,164 aged, 2,971 disabled)
Children under 18 without health insurance coverage in 2007: 1,107 (12%)


Most common underlying causes of death in Campbell County, Tennessee in 1999 - 2019:
- Acute myocardial infarction, unspecified (1,216)
- Bronchus or lung, unspecified - Malignant neoplasms (961)
- Atherosclerotic heart disease (731)
- Chronic obstructive pulmonary disease, unspecified (636)
- Alzheimer disease, unspecified (321)
- Pneumonia, unspecified (318)
- Stroke, not specified as haemorrhage or infarction (258)
- Unspecified dementia (245)
- Chronic obstructive pulmonary disease with acute lower respiratory infection (126)
- Colon, unspecified - Malignant neoplasms (102)
Population without health insurance coverage in 2000: 16%
Children under 18 without health insurance coverage in 2000: 10%
Short term general hospital admissions per 100,000 population in 2004: 12,561
Short term general hospital beds per 100,000 population in 2004: 518
Emergency room visits per 100,000 population in 2004: 82,763
General practice office based MDs per 100,000 population in 2005: 1,177
Medical specialist MDs per 100,000 population in 2005: 1,187
Dentists per 100,000 population in 1998: 2
Total births per 100,000 population, July 2005 - July 2006 : 18
Total deaths per 100,000 population, July 2005 - July 2006: 52
Limited-service eating places per 100,000 population in 2005 : 7
Crimes per 100,000 population in 1996: 1
Suicides per 1,000,000 population from 2000 to 2006: 160.3. This is more than state average.

- Firearm - 106.9
- Other - 53.4
Household type by relationship:
Households: 40,122- Male householders: 8,270 (2,077 living alone), Female householders: 8,780 (2,424 living alone)
7,984 spouses (7,942 opposite-sex spouses), 1,752 unmarried partners, (1,668 opposite-sex unmarried partners), 9,237 children (7,933 natural, 707 adopted, 599 stepchildren), 1,434 grandchildren, 394 brothers or sisters, 355 parents, 51 foster children, 696 other relatives, 765 non-relatives
- In group quarters: 659
Size of family households: 5,667 2-persons, 2,770 3-persons, 1,610 4-persons, 709 5-persons, 286 6-persons, 377 7-or-more-persons.
Size of nonfamily households: 4,501 1-person, 824 2-persons, 178 3-persons, 76 4-persons, 7 5-persons, 59 6-persons.
4,281 married couples with children.
1,920 single-parent households (626 men, 1,294 women).
98.8% of residents of Campbell speak English at home.
0.5% of residents speak Spanish at home (33% speak English very well, 30% speak English well, 20% speak English not well, 18% don't speak English at all).
0.4% of residents speak other Indo-European language at home (79% speak English very well, 13% speak English well, 8% speak English not well).
0.1% of residents speak other language at home (100% speak English very well).
In fiscal year 2004:
Federal Government expenditure: $312,137,000 ($7,706 per capita)
Department of Defense expenditure: $28,896,000
Federal direct payments to individuals for retirement and disability: $129,239,000
Federal other direct payments to individuals: $71,296,000
Federal direct payments not to individuals: $2,454,000
Federal grants: $77,856,000
Federal procurement contracts: $25,111,000 ($23,785,000 Department of Defense)
Federal salaries and wages: $6,180,000 ($919,000 Department of Defense)
Federal Government direct loans: $770,000
Federal guaranteed/insured loans: $7,020,000
Federal Government insurance: $6,331,000
Population change from April 1, 2000 to July 1, 2005:
Births: 2,610| Here: | 64 per 1000 residents |
| State: | 69 per 1000 residents |
Deaths: 2,486
| Here: | 61 per 1000 residents |
| State: | 50 per 1000 residents |
Net international migration: +144
| Here: | +4 per 1000 residents |
| State: | +8 per 1000 residents |
Net internal migration: +622
| Here: | +15 per 1000 residents |
| State: | +18 per 1000 residents |

Total withdrawal of fresh water for public supply: 3.54 millions of gallons per day (15% from ground, 85% from surface)
| Here: | 6.2 |
| State: | 6.5 |
| Here: | 4.7 |
| State: | 4.4 |

- Year house built in Campbell County, Tennessee
- 352020 or later
- 1,6752010 to 2019
- 3,0892000 to 2009
- 3,1471990 to 1999
- 3,2381980 to 1989
- 3,5421970 to 1979
- 2,0171960 to 1969
- 1,5961950 to 1959
- 6861940 to 1949
- 1,1271939 or earlier

- Rooms in owner-occupied houses in Campbell County, Tennessee
- 531 room
- 232 rooms
- 2423 rooms
- 9184 rooms
- 2,4855 rooms
- 2,7786 rooms
- 2,0827 rooms
- 1,3408 rooms
- 1,5529+ rooms

- Rooms in renter-occupied apartments in Campbell County, Tennessee
- 751 room
- 782 rooms
- 7823 rooms
- 1,4844 rooms
- 1,2755 rooms
- 9266 rooms
- 5127 rooms
- 1188 rooms
- 2499+ rooms

- Bedrooms in owner-occupied houses in Campbell County, Tennessee
- 96no bedroom
- 1181 bedroom
- 2,0742 bedrooms
- 7,1263 bedrooms
- 1,6584 bedrooms
- 4025+ bedrooms

- Bedrooms in renter-occupied apartments in Campbell County, Tennessee
- 86no bedroom
- 9371 bedroom
- 2,0572 bedrooms
- 2,0543 bedrooms
- 2884 bedrooms
- 865+ bedrooms

- Cars and other vehicles available in Campbell County in owner-occupied houses/condos
- 379no vehicle
- 2,7271 vehicle
- 4,0542 vehicles
- 2,5813 vehicles
- 1,2584 vehicles
- 4725+ vehicles

- Cars and other vehicles available in Campbell County in renter-occupied apartments
- 633no vehicle
- 2,5901 vehicle
- 1,2332 vehicles
- 7493 vehicles
- 1314 vehicles
- 2525+ vehicles
88.6% of Campbell County residents lived in the same house 1 years ago.
Out of people who lived in different houses, 36% lived in this county.
Out of people who lived in different counties, 63% lived in Tennessee.
| Campbell County: | 88.6% |
| State average: | 87.0% |
Place of birth for U.S.-born residents:
- This state: 26,452
- Other state: 13,031
- Northeast: 940
- Midwest: 5,454
- South: 5,459
- West: 1,066


- 56.5%Electricity
- 27.1%Utility gas
- 10.9%Bottled, tank, or LP gas
- 3.8%Wood
- 1.2%Fuel oil, kerosene, etc.
- 0.3%Other fuel
- 0.2%No fuel used

- 63.8%Electricity
- 28.2%Utility gas
- 4.8%Bottled, tank, or LP gas
- 2.1%Wood
- 0.6%Fuel oil, kerosene, etc.
- 0.3%No fuel used
- 0.2%Coal or coke
Private vs. public school enrollment:
| Here: | 9.0% |
| Tennessee: | 15.0% |
| Here: | 14.9% |
| Tennessee: | 16.2% |
| Here: | 31.7% |
| Tennessee: | 23.5% |


Campbell County government finances - Expenditure in 2018:
- Assistance and Subsidies - Public Welfare, Cash Assistance Programs - Other: $7,000
- Bond Funds - Cash and Securities: $12,504,000
- Charges - Other: $3,345,000
Elementary and Secondary Education - Other: $1,705,000
Elementary and Secondary Education - Other: $1,521,000
Other: $191,000
Elementary and Secondary Education School Lunch: $171,000
Elementary and Secondary Education School Lunch: $129,000
Air Transportation: $125,000
Solid Waste Management: $64,000
Parks and Recreation: $2,000
- Construction - Judicial and Legal Services: $22,785,000
Regular Highways: $2,807,000
Regular Highways: $2,300,000
Solid Waste Management: $924,000
Health - Other: $779,000
General - Other: $741,000
Central Staff Services: $486,000
Parks and Recreation: $150,000
Elementary and Secondary Education: $96,000
Elementary and Secondary Education: $9,000
- Current Operations - Elementary and Secondary Education: $49,324,000
Elementary and Secondary Education: $47,514,000
Police Protection: $4,000,000
Regular Highways: $3,627,000
Correctional Institutions: $2,980,000
Police Protection: $2,911,000
Correctional Institutions: $2,500,000
Solid Waste Management: $2,450,000
Health - Other: $2,230,000
Judicial and Legal Services: $2,000,000
Solid Waste Management: $1,800,000
Central Staff Services: $1,380,000
General - Other: $1,342,000
Health - Other: $1,331,000
Judicial and Legal Services: $1,285,000
Regular Highways: $1,200,000
Financial Administration: $1,157,000
Financial Administration: $930,000
General Public Buildings: $450,000
Central Staff Services: $375,000
Local Fire Protection: $291,000
General Public Buildings: $279,000
Parks and Recreation: $130,000
Natural Resources - Other: $129,000
General - Other: $125,000
Public Welfare - Other: $104,000
Air Transportation: $77,000
Parks and Recreation: $61,000
Air Transportation: $60,000
Libraries: $41,000
Libraries: $34,000
Local Fire Protection: $25,000
- Federal Intergovernmental - Highways: $2,450,000
Housing and Community Development: $197,000
Education: $63,000
Other: $49,000
Education: $47,000
- General - Interest on Debt: $2,132,000
Interest on Debt: $1,920,000
- Intergovernmental to Local - Other - General - Other: $697,000
Other - Correctional Institutions: $55,000
Other - Public Welfare - Other: $55,000
Other - Corrections: $35,000
Other - Libraries: $34,000
Other - Health - Other: $18,000
Other - Financial Administration: $4,000
Other - Judicial and Legal Services: $4,000
Other - Parks and Recreation: $4,000
Other - Correctional Institutions: $1,000
- Intergovernmental to State - Health - Other: $180,000
Financial Administration: $20,000
Health - Other: $5,000
- Local Intergovernmental - Other: $4,036,000
Highways: $350,000
Health and Hospitals: $26,000
General Local Government Support: $21,000
Education: $8,000
- Long Term Debt - Beginning Outstanding - Unspecified Public Purpose: $48,000,000
Retired Unspecified Public Purpose: $40,000,000
Beginning Outstanding - Unspecified Public Purpose: $39,093,000
Outstanding Unspecified Public Purpose: $35,307,000
Outstanding Unspecified Public Purpose: $12,000,000
Issue, Unspecified Public Purpose: $4,000,000
Retired Unspecified Public Purpose: $3,786,000
- Miscellaneous - Interest Earnings: $1,596,000
General Revenue - Other: $1,353,000
Sale of Property: $817,000
Fines and Forfeits: $320,000
Donations From Private Sources: $137,000
General Revenue - Other: $110,000
Interest Earnings: $100,000
Sale of Property: $60,000
Rents: $54,000
Donations From Private Sources: $43,000
Rents: $42,000
Fines and Forfeits: $35,000
- Other Capital Outlay - Elementary and Secondary Education: $1,959,000
Elementary and Secondary Education: $1,772,000
Police Protection: $1,000,000
Regular Highways: $500,000
Solid Waste Management: $400,000
General - Other: $152,000
Correctional Institutions: $150,000
General Public Building: $150,000
Financial Administration: $89,000
Health - Other: $79,000
Regular Highways: $76,000
General Public Building: $62,000
Judicial and Legal Services: $50,000
Solid Waste Management: $50,000
Police Protection: $50,000
Central Staff Services: $23,000
Correctional Institutions: $19,000
Parks and Recreation: $5,000
Health - Other: $5,000
Public Welfare - Other: $1,000
Parks and Recreation: $1,000
- Other Funds - Cash and Securities: $18,072,000
Cash and Securities: $10,000,000
- Sinking Funds - Cash and Securities: $2,143,000
- State Intergovernmental - Education: $40,589,000
Education: $40,075,000
Highways: $3,750,000
Other: $2,276,000
Health and Hospitals: $1,119,000
General Local Government Support: $807,000
Highways: $788,000
Health and Hospitals: $258,000
General Local Government Support: $29,000
Public Welfare: $29,000
Housing and Community Development: $19,000
- Tax - Property: $13,587,000
Property: $10,070,000
General Sales and Gross Receipts: $7,063,000
General Sales and Gross Receipts: $5,644,000
Motor Vehicle License: $1,474,000
Other Selective Sales: $1,051,000
Motor Vehicle License: $994,000
Occupation and Business License - Other: $344,000
Public Utilities Sales: $341,000
Occupation and Business License - Other: $253,000
Public Utility License: $136,000
Alcoholic Beverage Sales: $127,000
Alcoholic Beverage Sales: $97,000
Other License: $7,000
Alcoholic Beverage License: $1,000
Alcoholic Beverage License: $1,000
- Total Salaries and Wages: $28,922,000
: $27,864,000
Campbell County government finances - Revenue in 2018:
- Assistance and Subsidies - Public Welfare, Cash Assistance Programs - Other: $7,000
- Bond Funds - Cash and Securities: $12,504,000
- Charges - Other: $3,345,000
Elementary and Secondary Education - Other: $1,705,000
Elementary and Secondary Education - Other: $1,521,000
Other: $191,000
Elementary and Secondary Education School Lunch: $171,000
Elementary and Secondary Education School Lunch: $129,000
Air Transportation: $125,000
Solid Waste Management: $64,000
Parks and Recreation: $2,000
- Construction - Judicial and Legal Services: $22,785,000
Regular Highways: $2,807,000
Regular Highways: $2,300,000
Solid Waste Management: $924,000
Health - Other: $779,000
General - Other: $741,000
Central Staff Services: $486,000
Parks and Recreation: $150,000
Elementary and Secondary Education: $96,000
Elementary and Secondary Education: $9,000
- Current Operations - Elementary and Secondary Education: $49,324,000
Elementary and Secondary Education: $47,514,000
Police Protection: $4,000,000
Regular Highways: $3,627,000
Correctional Institutions: $2,980,000
Police Protection: $2,911,000
Correctional Institutions: $2,500,000
Solid Waste Management: $2,450,000
Health - Other: $2,230,000
Judicial and Legal Services: $2,000,000
Solid Waste Management: $1,800,000
Central Staff Services: $1,380,000
General - Other: $1,342,000
Health - Other: $1,331,000
Judicial and Legal Services: $1,285,000
Regular Highways: $1,200,000
Financial Administration: $1,157,000
Financial Administration: $930,000
General Public Buildings: $450,000
Central Staff Services: $375,000
Local Fire Protection: $291,000
General Public Buildings: $279,000
Parks and Recreation: $130,000
Natural Resources - Other: $129,000
General - Other: $125,000
Public Welfare - Other: $104,000
Air Transportation: $77,000
Parks and Recreation: $61,000
Air Transportation: $60,000
Libraries: $41,000
Libraries: $34,000
Local Fire Protection: $25,000
- Federal Intergovernmental - Highways: $2,450,000
Housing and Community Development: $197,000
Education: $63,000
Other: $49,000
Education: $47,000
- General - Interest on Debt: $2,132,000
Interest on Debt: $1,920,000
- Intergovernmental to Local - Other - General - Other: $697,000
Other - Correctional Institutions: $55,000
Other - Public Welfare - Other: $55,000
Other - Corrections: $35,000
Other - Libraries: $34,000
Other - Health - Other: $18,000
Other - Financial Administration: $4,000
Other - Judicial and Legal Services: $4,000
Other - Parks and Recreation: $4,000
Other - Correctional Institutions: $1,000
- Intergovernmental to State - Health - Other: $180,000
Financial Administration: $20,000
Health - Other: $5,000
- Local Intergovernmental - Other: $4,036,000
Highways: $350,000
Health and Hospitals: $26,000
General Local Government Support: $21,000
Education: $8,000
- Long Term Debt - Beginning Outstanding - Unspecified Public Purpose: $48,000,000
Retired Unspecified Public Purpose: $40,000,000
Beginning Outstanding - Unspecified Public Purpose: $39,093,000
Outstanding Unspecified Public Purpose: $35,307,000
Outstanding Unspecified Public Purpose: $12,000,000
Issue, Unspecified Public Purpose: $4,000,000
Retired Unspecified Public Purpose: $3,786,000
- Miscellaneous - Interest Earnings: $1,596,000
General Revenue - Other: $1,353,000
Sale of Property: $817,000
Fines and Forfeits: $320,000
Donations From Private Sources: $137,000
General Revenue - Other: $110,000
Interest Earnings: $100,000
Sale of Property: $60,000
Rents: $54,000
Donations From Private Sources: $43,000
Rents: $42,000
Fines and Forfeits: $35,000
- Other Capital Outlay - Elementary and Secondary Education: $1,959,000
Elementary and Secondary Education: $1,772,000
Police Protection: $1,000,000
Regular Highways: $500,000
Solid Waste Management: $400,000
General - Other: $152,000
Correctional Institutions: $150,000
General Public Building: $150,000
Financial Administration: $89,000
Health - Other: $79,000
Regular Highways: $76,000
General Public Building: $62,000
Judicial and Legal Services: $50,000
Solid Waste Management: $50,000
Police Protection: $50,000
Central Staff Services: $23,000
Correctional Institutions: $19,000
Parks and Recreation: $5,000
Health - Other: $5,000
Public Welfare - Other: $1,000
Parks and Recreation: $1,000
- Other Funds - Cash and Securities: $18,072,000
Cash and Securities: $10,000,000
- Sinking Funds - Cash and Securities: $2,143,000
- State Intergovernmental - Education: $40,589,000
Education: $40,075,000
Highways: $3,750,000
Other: $2,276,000
Health and Hospitals: $1,119,000
General Local Government Support: $807,000
Highways: $788,000
Health and Hospitals: $258,000
General Local Government Support: $29,000
Public Welfare: $29,000
Housing and Community Development: $19,000
- Tax - Property: $13,587,000
Property: $10,070,000
General Sales and Gross Receipts: $7,063,000
General Sales and Gross Receipts: $5,644,000
Motor Vehicle License: $1,474,000
Other Selective Sales: $1,051,000
Motor Vehicle License: $994,000
Occupation and Business License - Other: $344,000
Public Utilities Sales: $341,000
Occupation and Business License - Other: $253,000
Public Utility License: $136,000
Alcoholic Beverage Sales: $127,000
Alcoholic Beverage Sales: $97,000
Other License: $7,000
Alcoholic Beverage License: $1,000
Alcoholic Beverage License: $1,000
- Total Salaries and Wages: $28,922,000
: $27,864,000
Campbell County government finances - Debt in 2018:
- Assistance and Subsidies - Public Welfare, Cash Assistance Programs - Other: $7,000
- Bond Funds - Cash and Securities: $12,504,000
- Charges - Other: $3,345,000
Elementary and Secondary Education - Other: $1,705,000
Elementary and Secondary Education - Other: $1,521,000
Other: $191,000
Elementary and Secondary Education School Lunch: $171,000
Elementary and Secondary Education School Lunch: $129,000
Air Transportation: $125,000
Solid Waste Management: $64,000
Parks and Recreation: $2,000
- Construction - Judicial and Legal Services: $22,785,000
Regular Highways: $2,807,000
Regular Highways: $2,300,000
Solid Waste Management: $924,000
Health - Other: $779,000
General - Other: $741,000
Central Staff Services: $486,000
Parks and Recreation: $150,000
Elementary and Secondary Education: $96,000
Elementary and Secondary Education: $9,000
- Current Operations - Elementary and Secondary Education: $49,324,000
Elementary and Secondary Education: $47,514,000
Police Protection: $4,000,000
Regular Highways: $3,627,000
Correctional Institutions: $2,980,000
Police Protection: $2,911,000
Correctional Institutions: $2,500,000
Solid Waste Management: $2,450,000
Health - Other: $2,230,000
Judicial and Legal Services: $2,000,000
Solid Waste Management: $1,800,000
Central Staff Services: $1,380,000
General - Other: $1,342,000
Health - Other: $1,331,000
Judicial and Legal Services: $1,285,000
Regular Highways: $1,200,000
Financial Administration: $1,157,000
Financial Administration: $930,000
General Public Buildings: $450,000
Central Staff Services: $375,000
Local Fire Protection: $291,000
General Public Buildings: $279,000
Parks and Recreation: $130,000
Natural Resources - Other: $129,000
General - Other: $125,000
Public Welfare - Other: $104,000
Air Transportation: $77,000
Parks and Recreation: $61,000
Air Transportation: $60,000
Libraries: $41,000
Libraries: $34,000
Local Fire Protection: $25,000
- Federal Intergovernmental - Highways: $2,450,000
Housing and Community Development: $197,000
Education: $63,000
Other: $49,000
Education: $47,000
- General - Interest on Debt: $2,132,000
Interest on Debt: $1,920,000
- Intergovernmental to Local - Other - General - Other: $697,000
Other - Correctional Institutions: $55,000
Other - Public Welfare - Other: $55,000
Other - Corrections: $35,000
Other - Libraries: $34,000
Other - Health - Other: $18,000
Other - Financial Administration: $4,000
Other - Judicial and Legal Services: $4,000
Other - Parks and Recreation: $4,000
Other - Correctional Institutions: $1,000
- Intergovernmental to State - Health - Other: $180,000
Financial Administration: $20,000
Health - Other: $5,000
- Local Intergovernmental - Other: $4,036,000
Highways: $350,000
Health and Hospitals: $26,000
General Local Government Support: $21,000
Education: $8,000
- Long Term Debt - Beginning Outstanding - Unspecified Public Purpose: $48,000,000
Retired Unspecified Public Purpose: $40,000,000
Beginning Outstanding - Unspecified Public Purpose: $39,093,000
Outstanding Unspecified Public Purpose: $35,307,000
Outstanding Unspecified Public Purpose: $12,000,000
Issue, Unspecified Public Purpose: $4,000,000
Retired Unspecified Public Purpose: $3,786,000
- Miscellaneous - Interest Earnings: $1,596,000
General Revenue - Other: $1,353,000
Sale of Property: $817,000
Fines and Forfeits: $320,000
Donations From Private Sources: $137,000
General Revenue - Other: $110,000
Interest Earnings: $100,000
Sale of Property: $60,000
Rents: $54,000
Donations From Private Sources: $43,000
Rents: $42,000
Fines and Forfeits: $35,000
- Other Capital Outlay - Elementary and Secondary Education: $1,959,000
Elementary and Secondary Education: $1,772,000
Police Protection: $1,000,000
Regular Highways: $500,000
Solid Waste Management: $400,000
General - Other: $152,000
Correctional Institutions: $150,000
General Public Building: $150,000
Financial Administration: $89,000
Health - Other: $79,000
Regular Highways: $76,000
General Public Building: $62,000
Judicial and Legal Services: $50,000
Solid Waste Management: $50,000
Police Protection: $50,000
Central Staff Services: $23,000
Correctional Institutions: $19,000
Parks and Recreation: $5,000
Health - Other: $5,000
Public Welfare - Other: $1,000
Parks and Recreation: $1,000
- Other Funds - Cash and Securities: $18,072,000
Cash and Securities: $10,000,000
- Sinking Funds - Cash and Securities: $2,143,000
- State Intergovernmental - Education: $40,589,000
Education: $40,075,000
Highways: $3,750,000
Other: $2,276,000
Health and Hospitals: $1,119,000
General Local Government Support: $807,000
Highways: $788,000
Health and Hospitals: $258,000
General Local Government Support: $29,000
Public Welfare: $29,000
Housing and Community Development: $19,000
- Tax - Property: $13,587,000
Property: $10,070,000
General Sales and Gross Receipts: $7,063,000
General Sales and Gross Receipts: $5,644,000
Motor Vehicle License: $1,474,000
Other Selective Sales: $1,051,000
Motor Vehicle License: $994,000
Occupation and Business License - Other: $344,000
Public Utilities Sales: $341,000
Occupation and Business License - Other: $253,000
Public Utility License: $136,000
Alcoholic Beverage Sales: $127,000
Alcoholic Beverage Sales: $97,000
Other License: $7,000
Alcoholic Beverage License: $1,000
Alcoholic Beverage License: $1,000
- Total Salaries and Wages: $28,922,000
: $27,864,000
Campbell County government finances - Cash and Securities in 2018:
- Assistance and Subsidies - Public Welfare, Cash Assistance Programs - Other: $7,000
- Bond Funds - Cash and Securities: $12,504,000
- Charges - Other: $3,345,000
Elementary and Secondary Education - Other: $1,705,000
Elementary and Secondary Education - Other: $1,521,000
Other: $191,000
Elementary and Secondary Education School Lunch: $171,000
Elementary and Secondary Education School Lunch: $129,000
Air Transportation: $125,000
Solid Waste Management: $64,000
Parks and Recreation: $2,000
- Construction - Judicial and Legal Services: $22,785,000
Regular Highways: $2,807,000
Regular Highways: $2,300,000
Solid Waste Management: $924,000
Health - Other: $779,000
General - Other: $741,000
Central Staff Services: $486,000
Parks and Recreation: $150,000
Elementary and Secondary Education: $96,000
Elementary and Secondary Education: $9,000
- Current Operations - Elementary and Secondary Education: $49,324,000
Elementary and Secondary Education: $47,514,000
Police Protection: $4,000,000
Regular Highways: $3,627,000
Correctional Institutions: $2,980,000
Police Protection: $2,911,000
Correctional Institutions: $2,500,000
Solid Waste Management: $2,450,000
Health - Other: $2,230,000
Judicial and Legal Services: $2,000,000
Solid Waste Management: $1,800,000
Central Staff Services: $1,380,000
General - Other: $1,342,000
Health - Other: $1,331,000
Judicial and Legal Services: $1,285,000
Regular Highways: $1,200,000
Financial Administration: $1,157,000
Financial Administration: $930,000
General Public Buildings: $450,000
Central Staff Services: $375,000
Local Fire Protection: $291,000
General Public Buildings: $279,000
Parks and Recreation: $130,000
Natural Resources - Other: $129,000
General - Other: $125,000
Public Welfare - Other: $104,000
Air Transportation: $77,000
Parks and Recreation: $61,000
Air Transportation: $60,000
Libraries: $41,000
Libraries: $34,000
Local Fire Protection: $25,000
- Federal Intergovernmental - Highways: $2,450,000
Housing and Community Development: $197,000
Education: $63,000
Other: $49,000
Education: $47,000
- General - Interest on Debt: $2,132,000
Interest on Debt: $1,920,000
- Intergovernmental to Local - Other - General - Other: $697,000
Other - Correctional Institutions: $55,000
Other - Public Welfare - Other: $55,000
Other - Corrections: $35,000
Other - Libraries: $34,000
Other - Health - Other: $18,000
Other - Financial Administration: $4,000
Other - Judicial and Legal Services: $4,000
Other - Parks and Recreation: $4,000
Other - Correctional Institutions: $1,000
- Intergovernmental to State - Health - Other: $180,000
Financial Administration: $20,000
Health - Other: $5,000
- Local Intergovernmental - Other: $4,036,000
Highways: $350,000
Health and Hospitals: $26,000
General Local Government Support: $21,000
Education: $8,000
- Long Term Debt - Beginning Outstanding - Unspecified Public Purpose: $48,000,000
Retired Unspecified Public Purpose: $40,000,000
Beginning Outstanding - Unspecified Public Purpose: $39,093,000
Outstanding Unspecified Public Purpose: $35,307,000
Outstanding Unspecified Public Purpose: $12,000,000
Issue, Unspecified Public Purpose: $4,000,000
Retired Unspecified Public Purpose: $3,786,000
- Miscellaneous - Interest Earnings: $1,596,000
General Revenue - Other: $1,353,000
Sale of Property: $817,000
Fines and Forfeits: $320,000
Donations From Private Sources: $137,000
General Revenue - Other: $110,000
Interest Earnings: $100,000
Sale of Property: $60,000
Rents: $54,000
Donations From Private Sources: $43,000
Rents: $42,000
Fines and Forfeits: $35,000
- Other Capital Outlay - Elementary and Secondary Education: $1,959,000
Elementary and Secondary Education: $1,772,000
Police Protection: $1,000,000
Regular Highways: $500,000
Solid Waste Management: $400,000
General - Other: $152,000
Correctional Institutions: $150,000
General Public Building: $150,000
Financial Administration: $89,000
Health - Other: $79,000
Regular Highways: $76,000
General Public Building: $62,000
Judicial and Legal Services: $50,000
Solid Waste Management: $50,000
Police Protection: $50,000
Central Staff Services: $23,000
Correctional Institutions: $19,000
Parks and Recreation: $5,000
Health - Other: $5,000
Public Welfare - Other: $1,000
Parks and Recreation: $1,000
- Other Funds - Cash and Securities: $18,072,000
Cash and Securities: $10,000,000
- Sinking Funds - Cash and Securities: $2,143,000
- State Intergovernmental - Education: $40,589,000
Education: $40,075,000
Highways: $3,750,000
Other: $2,276,000
Health and Hospitals: $1,119,000
General Local Government Support: $807,000
Highways: $788,000
Health and Hospitals: $258,000
General Local Government Support: $29,000
Public Welfare: $29,000
Housing and Community Development: $19,000
- Tax - Property: $13,587,000
Property: $10,070,000
General Sales and Gross Receipts: $7,063,000
General Sales and Gross Receipts: $5,644,000
Motor Vehicle License: $1,474,000
Other Selective Sales: $1,051,000
Motor Vehicle License: $994,000
Occupation and Business License - Other: $344,000
Public Utilities Sales: $341,000
Occupation and Business License - Other: $253,000
Public Utility License: $136,000
Alcoholic Beverage Sales: $127,000
Alcoholic Beverage Sales: $97,000
Other License: $7,000
Alcoholic Beverage License: $1,000
Alcoholic Beverage License: $1,000
- Total Salaries and Wages: $28,922,000
: $27,864,000
Supplemental Security Income (SSI) in 2006:
- Total number of recipients: 2,779
- Number of aged recipients: 152
- Number of blind and disabled recipients: 2,627
- Number of recipients under 18: 202
- Number of recipients between 18 and 64: 2,088
- Number of recipients older than 64: 489
- Number of recipients also receiving OASDI: 967
- Amount of payments (thousands of dollars): 1,210
| Most common first names in Campbell County, TN among deceased individuals | ||
| Name | Count | Lived (average) |
|---|---|---|
| James | 420 | 71.0 years |
| William | 273 | 72.8 years |
| John | 259 | 74.1 years |
| Mary | 257 | 79.2 years |
| Charles | 165 | 69.8 years |
| Robert | 164 | 70.3 years |
| George | 144 | 76.4 years |
| Walter | 88 | 75.1 years |
| Edna | 80 | 77.5 years |
| Martha | 75 | 81.2 years |
| Most common last names in Campbell County, TN among deceased individuals | ||
| Last name | Count | Lived (average) |
|---|---|---|
| Wilson | 197 | 74.2 years |
| Smith | 175 | 74.3 years |
| Miller | 148 | 75.8 years |
| Sharp | 146 | 76.8 years |
| Davis | 132 | 74.5 years |
| Goins | 115 | 74.0 years |
| Jones | 111 | 75.2 years |
| Baird | 105 | 76.2 years |
| Lawson | 89 | 74.0 years |
| Brown | 89 | 76.8 years |
| Businesses in Campbell County, TN | ||||
| Name | Count | Name | Count | |
|---|---|---|---|---|
| AT&T | 1 | Long John Silver's | 1 | |
| Ace Hardware | 1 | Lowe's | 1 | |
| Advance Auto Parts | 1 | McDonald's | 1 | |
| Arby's | 2 | Motel 6 | 1 | |
| AutoZone | 1 | Nike | 1 | |
| Burger King | 1 | Papa John's Pizza | 1 | |
| CVS | 1 | Pizza Hut | 1 | |
| Comfort Inn | 1 | RadioShack | 1 | |
| Days Inn | 1 | Rite Aid | 1 | |
| Domino's Pizza | 1 | SONIC Drive-In | 1 | |
| FedEx | 3 | Sears | 1 | |
| Ford | 1 | Subway | 3 | |
| GNC | 1 | Super 8 | 1 | |
| GameStop | 1 | Taco Bell | 1 | |
| Goodwill | 2 | U-Haul | 4 | |
| H&R Block | 2 | U.S. Cellular | 1 | |
| Hardee's | 2 | UPS | 3 | |
| KFC | 1 | Waffle House | 1 | |
| Kincaid | 1 | Walgreens | 1 | |
| Lane Furniture | 1 | Walmart | 1 | |
| Little Caesars Pizza | 1 | Wendy's | 2 | |
Campbell County on our top lists:
- #38 on the list of "Top 101 counties with the smallest number of children under 18 without health insurance coverage in 2000"
- #67 on the list of "Top 101 counties with the smallest number of people without health insurance coverage in 2000"