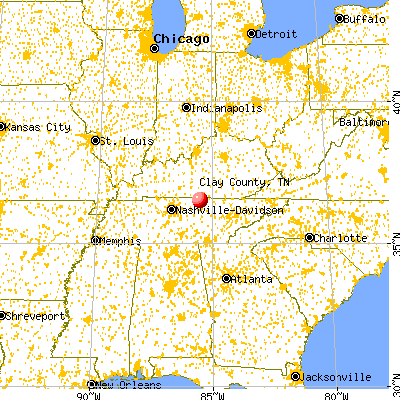
Clay County, Tennessee (TN)
County owner-occupied free and clear houses and condos in 2010: 1,504
County owner-occupied houses and condos in 2000: 2,702
Renter-occupied apartments: 741 (it was 677 in 2000)
| % of renters here: | 20% |
| State: | 32% |
Land area: 236 sq. mi.
Water area: 23.1 sq. mi.
Population density: 33 people per square mile (low).
Industries providing employment: Educational, health and social services (23.9%), Manufacturing (16.0%), Construction (14.2%).
Type of workers:
- Private wage or salary: 65%
- Government: 21%
- Self-employed, not incorporated: 15%
- Unpaid family work: 0%
- OSM Map
- General Map
- Google Map
- MSN Map

- 7,18993.3%White Non-Hispanic Alone
- 2262.9%Hispanic or Latino
- 1752.3%Two or more races
- 510.7%Black Non-Hispanic Alone
- 440.6%Asian alone
- 220.3%American Indian and Alaska Native alone

| Median resident age: | 47.8 years |
| Tennessee median age: | 39.2 years |
| Males: 3,695 | |
| Females: 4,036 |

 | Wish You Were Here (25 replies) |
| COVID-19 in Tennessee (237 replies) |
| Why doesn't Nashville have a bypass? (103 replies) |
| POLL: Which town/area of the following and why? (5 replies) |
| Are you for or against the idea that 4 lane should be built to every county seat? Why? (18 replies) |
| Is Woodbury doomed? (4 replies) |
| Clay County: | 2.0 people |
| Tennessee: | 2 people |
Estimated median household income in 2022: $40,325 ($23,958 in 1999)
| This county: | $40,325 |
| Tennessee: | $65,254 |
Median contract rent in 2022 for apartments: $406 (lower quartile is $285, upper quartile is $529)
| This county: | $406 |
| State: | $884 |
Estimated median house or condo value in 2022: $162,585 (it was $51,700 in 2000)
| Clay: | $162,585 |
| Tennessee: | $284,800 |
Mean price in 2022:
Median monthly housing costs for homes and condos with a mortgage: $1,029Detached houses: $215,354
Here: $215,354 State: $374,382 Townhouses or other attached units: $190,501
Here: $190,501 State: $354,101 Mobile homes: $63,525
Here: $63,525 State: $101,421
Median monthly housing costs for units without a mortgage: $350
Institutionalized population: 84
Crime in 2021 (reported by the sheriff's office or county police, not the county total):
- Murders: 0
- Rapes: 1
- Robberies: 0
- Assaults: 4
- Burglaries: 7
- Thefts: 10
- Auto thefts: 2
Crime in 2020 (reported by the sheriff's office or county police, not the county total):
- Murders: 0
- Rapes: 0
- Robberies: 0
- Assaults: 4
- Burglaries: 18
- Thefts: 25
- Auto thefts: 6
Single-family new house construction building permits:
- 2022: 26 buildings, average cost: $153,400
- 2021: 27 buildings, average cost: $153,400
- 2020: 22 buildings, average cost: $153,400
- 2019: 20 buildings, average cost: $153,400
- 2018: 18 buildings, average cost: $153,400
- 2017: 17 buildings, average cost: $153,400
- 2016: 15 buildings, average cost: $153,400
- 2015: 13 buildings, average cost: $153,400


Median real estate property taxes paid for housing units with mortgages in 2022: $898 (0.4%)
Median real estate property taxes paid for housing units with no mortgage in 2022: $737 (0.5%)


| Clay County: | 21.2% |
| Tennessee: | 13.3% |
Median age of residents in 2022: 47.8 years old
(Males: 47.1 years old, Females: 48.0 years old)
(Median age for: White residents: 48.3 years old, Black residents: 53.2 years old, Hispanic or Latino residents: 31.5 years old, Other race residents: 17.2 years old)
Fair market rent in 2006 for a 1-bedroom apartment in Clay County is $373 a month.
Fair market rent for a 2-bedroom apartment is $460 a month.
Fair market rent for a 3-bedroom apartment is $597 a month.
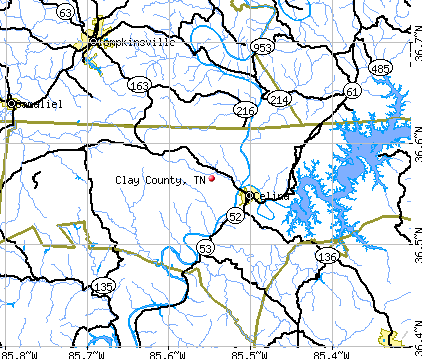
Cities in this county include: Hermitage Springs, Celina.
Notable locations in this county outside city limits:
Notable locations in Clay County: Clark Mountain Poultry Farms (A), Eagles Cove Marina (B), Star Point Dock (C), Sunset Dock (D), Eastport Dock (E), Cordell Hull Birthplace (F). Display/hide their locations on the map
Churches in Clay County include: Moodyville Baptist Church (A), Etter Baptist Church (B), Red Hill Church (C), Smyrna Church (D), Asbury Chapel (E), Sand Branch Church (F), Grace Chapel (G), United Church (H), Travisville Church (I). Display/hide their locations on the map
Cemeteries: Huddleston Cemetery (1), Taylor Cemetery (2), Scotch-Rich Cemetery (3), Tompkins Cemetery (4), Winningham Cemetery (5), Amonette Cemetery (6), Anderson-Jones Cemetery (7). Display/hide their locations on the map
Lakes and reservoirs: Pickett Lake (A), Akers Lake (B). Display/hide their locations on the map
Streams, rivers, and creeks: Big Eagle Creek (A), Little Rock Creek (B), Key Branch (C), Jouett Creek (D), Wright Branch (E), Jolly Creek (F), Andy Creek (G), Jackson Creek (H), Hurricane Creek (I). Display/hide their locations on the map
Parks in Clay County include: Pickett State Park and Forest (1), Pickett State Rustic Park Historic District (2), Cove Creek Recreation Area (3), Obey River Recreation Area (4). Display/hide their locations on the map
Neighboring counties: Ashe County, North Carolina  , Caswell County, North Carolina , Dunklin County, Missouri
  , Johnson County , Texas County, Oklahoma , Oregon County, Missouri .
| Here: | 4.1% |
| Tennessee: | 3.0% |


Current college students: 245
People 25 years of age or older with a high school degree or higher: 85.0%
People 25 years of age or older with a bachelor's degree or higher: 12.3%
Number of foreign born residents: 232 (39.6% naturalized citizens)
| Clay County: | 3.0% |
| Whole state: | 5.6% |

- Year of entry for the foreign-born population
- 1092010 or later
- 542000 to 2009
- 141990 to 1999
- 261980 to 1989
- 01970 to 1979
- 23Before 1970
Mean travel time to work (commute): minutes
Percentage of county residents living and working in this county: 99.3%
Housing units in structures:
- One, detached: 2,628
- One, attached: 19
- Two: 24
- 3 or 4: 52
- 5 to 9: 53
- 10 to 19: 41
- 20 to 49: 37
- 50 or more: 4
- Mobile homes: 1,179
- Boats, RVs, vans, etc.: 17
Housing units in Clay County with a mortgage: 724 (20 second mortgage, 0 home equity loan, 13 both second mortgage and home equity loan)
Houses without a mortgage: 0
| Here: | 100.0% with mortgage |
| State: | 97.8% with mortgage |
Religion statistics for Clay County
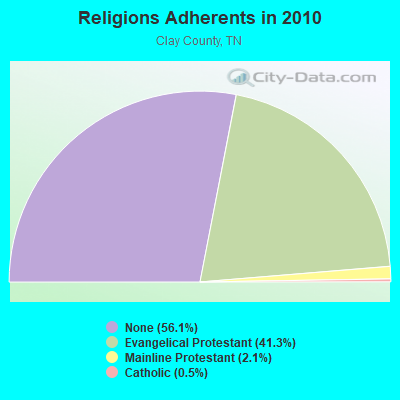
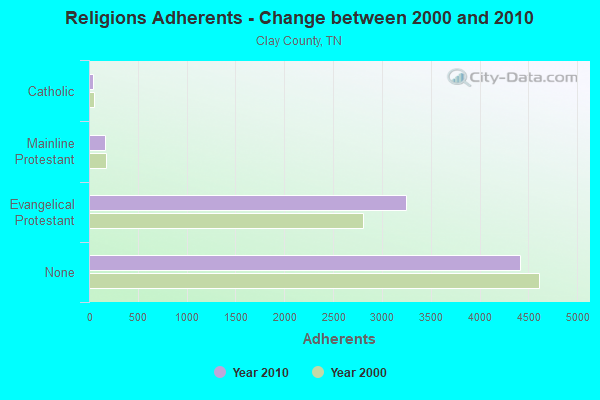
| Religion | Adherents | Congregations |
|---|---|---|
| Evangelical Protestant | 3,246 | 29 |
| Mainline Protestant | 164 | 1 |
| Catholic | 40 | 1 |
| None | 4,411 | - |
Source: Clifford Grammich, Kirk Hadaway, Richard Houseal, Dale E.Jones, Alexei Krindatch, Richie Stanley and Richard H.Taylor. 2012. 2010 U.S.Religion Census: Religious Congregations & Membership Study. Association of Statisticians of American Religious Bodies. Jones, Dale E., et al. 2002. Congregations and Membership in the United States 2000. Nashville, TN: Glenmary Research Center.
Food Environment Statistics:
| Clay County: | 2.55 / 10,000 pop. |
| State: | 1.99 / 10,000 pop. |
| Clay County: | 7.65 / 10,000 pop. |
| Tennessee: | 5.16 / 10,000 pop. |
| This county: | 6.37 / 10,000 pop. |
| State: | 6.56 / 10,000 pop. |
| Clay County: | 11.7% |
| Tennessee: | 11.4% |
| Clay County: | 31.6% |
| State: | 30.2% |
| Here: | 17.3% |
| State: | 13.5% |
Agriculture in Clay County:
Average size of farms: 137 acresAverage value of agricultural products sold per farm: $40,362
Average value of crops sold per acre for harvested cropland: $137.08
The value of nursery, greenhouse, floriculture, and sod as a percentage of the total market value of agricultural products sold: 0.10%
The value of livestock, poultry, and their products as a percentage of the total market value of agricultural products sold: 89.53%
Average total farm production expenses per farm: $39,998
Harvested cropland as a percentage of land in farms: 22.56%
Irrigated harvested cropland as a percentage of land in farms: 0.30%
Average market value of all machinery and equipment per farm: $38,034
The percentage of farms operated by a family or individual: 95.72%
Average age of principal farm operators: 54 years
Average number of cattle and calves per 100 acres of all land in farms: 28.20
Corn for grain: 473 harvested acres
Vegetables: 16 harvested acres
Land in orchards: 8 acres
Tornado activity:
Clay County historical area-adjusted tornado activity is significantly below Tennessee state average. It is 2139640.2 times below overall U.S. average.Tornadoes in this county have caused 5 fatalities and 10 injuries recorded between 1950 and 2004.
On 4/3/1974, a category 4 (max. wind speeds 207-260 mph) tornado killed 5 people and injured 6 people and caused between $500,000 and $5,000,000 in damages.
Earthquake activity:
Clay County-area historical earthquake activity is significantly above Tennessee state average. It is 135% greater than the overall U.S. average.On 4/18/2008 at 09:36:59, a magnitude 5.4 (5.1 MB, 4.8 MS, 5.4 MW, 5.2 MW, Class: Moderate, Intensity: VI - VII) earthquake occurred 183.0 miles away from Clay County center
On 7/27/1980 at 18:52:21, a magnitude 5.2 (5.1 MB, 4.7 MS, 5.0 UK, 5.2 UK) earthquake occurred 143.7 miles away from the county center
On 4/18/2008 at 09:36:59, a magnitude 5.2 (5.2 MW, Depth: 8.9 mi) earthquake occurred 183.0 miles away from the county center
On 6/18/2002 at 17:37:15, a magnitude 5.0 (4.3 MB, 4.6 MW, 5.0 LG) earthquake occurred 157.4 miles away from the county center
On 4/29/2003 at 08:59:39, a magnitude 4.9 (4.4 MB, 4.6 MW, 4.9 LG, Class: Light, Intensity: IV - V) earthquake occurred 143.3 miles away from Clay County center
On 11/30/1973 at 07:48:41, a magnitude 4.7 (4.7 MB, 4.6 ML) earthquake occurred 103.2 miles away from the county center
Magnitude types: regional Lg-wave magnitude (LG), body-wave magnitude (MB), local magnitude (ML), surface-wave magnitude (MS), moment magnitude (MW)
Most recent natural disasters:
- Tennessee Covid-19 Pandemic, Incident Period: January 20, 2020, FEMA Id: 4514, Natural disaster type: Other
- Tennessee Severe Storms, Flooding, Landslides, And Mudslides, Incident Period: February 19, 2019 - March 30, 2019, FEMA Id: 4427, Natural disaster type: Storm, Mudslide, Landslide, Flood
- Tennessee Severe Winter Storm and Flooding, Incident Period: February 15, 2015 to February 23, 2015, Major Disaster (Presidential) Declared DR-4211: April 02, 2015, FEMA Id: 4211, Natural disaster type: Winter Storm, Flood
- Tennessee Severe Storms and Flooding, Incident Period: August 17, 2010 to August 21, 2010, Major Disaster (Presidential) Declared DR-1937: September 15, 2010, FEMA Id: 1937, Natural disaster type: Storm, Flood
- Tennessee Severe Storms, Flooding, Straight-Line Winds, and Tornadoes, Incident Period: April 30, 2010 to May 18, 2010, Major Disaster (Presidential) Declared DR-1909: May 04, 2010, FEMA Id: 1909, Natural disaster type: Storm, Tornado, Flood, Wind
- Tennessee Severe Storms and Flooding, Incident Period: July 15, 2009 to July 17, 2009, Major Disaster (Presidential) Declared DR-1856: August 21, 2009, FEMA Id: 1856, Natural disaster type: Storm, Flood
- Tennessee Hurricane Katrina Evacuation, Incident Period: August 29, 2005 to October 01, 2005, Emergency Declared EM-3217: September 05, 2005, FEMA Id: 3217, Natural disaster type: Hurricane
- Tennessee Severe Storms and Flooding, Incident Period: September 16, 2004 to September 20, 2004, Major Disaster (Presidential) Declared DR-1568: October 07, 2004, FEMA Id: 1568, Natural disaster type: Storm, Flood
- Tennessee Storms and Flooding, Incident Period: January 23, 2002 to March 20, 2002, Major Disaster (Presidential) Declared DR-1408: April 05, 2002, FEMA Id: 1408, Natural disaster type: Storm, Flood
- Tennessee Severe Storms and Flooding, Incident Period: January 06, 1998 to February 12, 1998, Major Disaster (Presidential) Declared DR-1197: January 13, 1998, FEMA Id: 1197, Natural disaster type: Storm, Flood
- 6 other natural disasters have been reported since 1953.
The number of natural disasters in Clay County (16) is near the US average (15).
Major Disasters (Presidential) Declared: 12
Emergencies Declared: 2
Causes of natural disasters: Floods: 11, Storms: 10, Winter Storms: 3, Tornadoes: 2, Flash Flood: 1, Hurricane: 1, Ice Storm: 1, Landslide: 1, Mudslide: 1, Snowfall: 1, Wind: 1, Other: 1 (Note: some incidents may be assigned to more than one category).

Means of transportation to work:
- Drove a car alone: 1,331 (76.6%)
- Carpooled: 134 (7.7%)
- Bus: 11 (0.6%)
- Taxicab, motorcycle, or other means: 70 (4.0%)
- Walked: 20 (1.2%)
- Worked at home: 154 (8.9%)


- Health care and social assistance (23%)
- Educational services (13%)
- Accommodation and food services (9%)
- Manufacturing (9%)
- Professional, scientific, and technical services (9%)
- Other services, except public administration (7%)
- Retail trade (6%)

- Health care and social assistance (24%)
- Educational services (14%)
- Accommodation and food services (9%)
- Manufacturing (9%)
- Professional, scientific, and technical services (9%)
- Other services, except public administration (7%)
- Retail trade (6%)

- Construction and extraction occupations (22%)
- Production occupations (11%)
- Management occupations (10%)
- Installation, maintenance, and repair occupations (9%)
- Office and administrative support occupations (8%)
- Farming, fishing, and forestry occupations (7%)
- Transportation occupations (7%)

- Office and administrative support occupations (20%)
- Management occupations (13%)
- Educational instruction, and library occupations (10%)
- Health technologists and technicians (10%)
- Health diagnosing and treating practitioners and other technical occupations (8%)
- Sales and related occupations (6%)
- Personal care and service occupations (6%)

- Guatemala (56%)
- Philippines (16%)
- England (7%)
- Austria (7%)
- Cuba (6%)
- Mexico (5%)
- United Kingdom, excluding England and Scotland (4%)

- American (54%)
- Irish (11%)
- English (9%)
- German (4%)
- Polish (2%)
- Scotch-Irish (2%)
- Italian (1%)


People in group quarters in Clay County, Tennessee in 2010:
- 64 people in nursing facilities/skilled-nursing facilities
- 20 people in local jails and other municipal confinement facilities
- 12 people in group homes intended for adults
People in group quarters in Clay County, Tennessee in 2000:
- 63 people in nursing homes
- 9 people in local jails and other confinement facilities (including police lockups)
- 9 people in mental (psychiatric) hospitals or wards
- 8 people in homes for the mentally retarded
9.55% of this county's 2021 resident taxpayers lived in other counties in 2020 ($51,079 average adjusted gross income)
| Here: | 9.55% |
| Tennessee average: | 8.49% |
10 or fewer of this county's residents moved from foreign countries.
5.02% relocated from other counties in Tennessee ($21,826 average AGI)
4.53% relocated from other states ($29,253 average AGI)
Clay County: 4.53% Tennessee average: 4.34%

Top counties from which taxpayers relocated into this county between 2020 and 2021:
| from Macon County, TN | |
| from Overton County, TN |
5.07% of this county's 2020 resident taxpayers moved to other counties in 2021 ($32,859 average adjusted gross income)
| Here: | 5.07% |
| Tennessee average: | 7.40% |
10 or fewer of this county's residents moved to foreign countries.
3.80% relocated to other counties in Tennessee ($24,656 average AGI)
1.27% relocated to other states ($8,203 average AGI)
Clay County: 1.27% Tennessee average: 3.20%

Top counties to which taxpayers relocated from this county between 2020 and 2021:
| to Macon County, TN | |
| to Overton County, TN |
Births per 1000 population from 1990 to 1999: 10.6
Births per 1000 population from 2000 to 2006: 11.2

Deaths per 1000 population from 1990 to 1999: 12.7
Deaths per 1000 population from 2000 to 2009: 12.5
Deaths per 1000 population from 2010 to 2020: 15.4

Infant deaths per 1000 live births from 1990 to 1999: 8.9
Infant deaths per 1000 live births from 2000 to 2006: 4.3

Persons under 19 years old without health insurance coverage in 2018: 5.6%


Persons enrolled in hospital insurance and/or supplemental medical insurance (Medicare) in July 1, 2007: 1,705 (1,232 aged, 473 disabled)
Children under 18 without health insurance coverage in 2007: 203 (13%)


Most common underlying causes of death in Clay County, Tennessee in 1999 - 2019:
- Acute myocardial infarction, unspecified (162)
- Atherosclerotic heart disease (105)
- Bronchus or lung, unspecified - Malignant neoplasms (30)
- Chronic obstructive pulmonary disease, unspecified (23)
- Stroke, not specified as haemorrhage or infarction (10)
Population without health insurance coverage in 2000: 18%
Children under 18 without health insurance coverage in 2000: 12%
Short term general hospital admissions per 100,000 population in 2004: 16,937
Short term general hospital beds per 100,000 population in 2004: 425
Emergency room visits per 100,000 population in 2004: 53,535
General practice office based MDs per 100,000 population in 2005: 1,602
Medical specialist MDs per 100,000 population in 2005: 1,527
Dentists per 100,000 population in 1998: 38
Total births per 100,000 population, July 2005 - July 2006 : 28
Total deaths per 100,000 population, July 2005 - July 2006: 88
Crimes per 100,000 population in 1996: 1
Household type by relationship:
Households: 7,731- Male householders: 1,690 (492 living alone), Female householders: 1,490 (514 living alone)
1,633 spouses (1,624 opposite-sex spouses), 141 unmarried partners, (137 opposite-sex unmarried partners), 1,982 children (1,773 natural, 69 adopted, 137 stepchildren), 218 grandchildren, 23 brothers or sisters, 45 parents, 0 foster children, 199 other relatives, 199 non-relatives
- In group quarters: 110
Size of family households: 1,014 2-persons, 312 3-persons, 376 4-persons, 210 5-persons, 86 6-persons, 5 7-or-more-persons.
Size of nonfamily households: 1,006 1-person, 161 2-persons, 2 3-persons.
830 married couples with children.
503 single-parent households (105 men, 398 women).
95.3% of residents of Clay speak English at home.
4.1% of residents speak Spanish at home (27% speak English very well, 11% speak English well, 34% speak English not well, 29% don't speak English at all).
0.2% of residents speak other Indo-European language at home (100% speak English very well).
0.9% of residents speak Asian or Pacific Island language at home (94% speak English very well, 6% speak English not well).
In fiscal year 2004:
Federal Government expenditure: $58,357,000 ($7,289 per capita)
Department of Defense expenditure: $2,699,000
Federal direct payments to individuals for retirement and disability: $17,823,000
Federal other direct payments to individuals: $13,304,000
Federal direct payments not to individuals: $250,000
Federal grants: $22,940,000
Federal procurement contracts: $1,970,000 ($1,544,000 Department of Defense)
Federal salaries and wages: $2,070,000 ($847,000 Department of Defense)
Federal Government direct loans: $1,043,000
Federal guaranteed/insured loans: $380,000
Federal Government insurance: $1,437,000
Population change from April 1, 2000 to July 1, 2005:
Births: 387| Here: | 48 per 1000 residents |
| State: | 69 per 1000 residents |
Deaths: 538
| Here: | 67 per 1000 residents |
| State: | 50 per 1000 residents |
Net international migration: +29
| Here: | +4 per 1000 residents |
| State: | +8 per 1000 residents |
Net internal migration: +153
| Here: | +19 per 1000 residents |
| State: | +18 per 1000 residents |

Total withdrawal of fresh water for public supply: 1.10 millions of gallons per day (all from surface)
| Here: | 5.8 |
| State: | 6.5 |
| Here: | 4.5 |
| State: | 4.4 |

- Year house built in Clay County, Tennessee
- 202020 or later
- 3802010 to 2019
- 6042000 to 2009
- 5191990 to 1999
- 5911980 to 1989
- 7781970 to 1979
- 5541960 to 1969
- 2001950 to 1959
- 651940 to 1949
- 2951939 or earlier

- Rooms in owner-occupied houses in Clay County, Tennessee
- 281 room
- 132 rooms
- 423 rooms
- 2914 rooms
- 7355 rooms
- 4996 rooms
- 4287 rooms
- 2848 rooms
- 1779+ rooms

- Rooms in renter-occupied apartments in Clay County, Tennessee
- 151 room
- 72 rooms
- 833 rooms
- 2334 rooms
- 865 rooms
- 1186 rooms
- 337 rooms
- 838 rooms
- 189+ rooms

- Bedrooms in owner-occupied houses in Clay County, Tennessee
- 34no bedroom
- 531 bedroom
- 4712 bedrooms
- 1,5133 bedrooms
- 3384 bedrooms
- 945+ bedrooms

- Bedrooms in renter-occupied apartments in Clay County, Tennessee
- 15no bedroom
- 501 bedroom
- 3322 bedrooms
- 2533 bedrooms
- 74 bedrooms
- 125+ bedrooms

- Cars and other vehicles available in Clay County in owner-occupied houses/condos
- 121no vehicle
- 5251 vehicle
- 9502 vehicles
- 5713 vehicles
- 1394 vehicles
- 2075+ vehicles

- Cars and other vehicles available in Clay County in renter-occupied apartments
- 81no vehicle
- 3661 vehicle
- 1782 vehicles
- 503 vehicles
- 04 vehicles
- 05+ vehicles
94.3% of Clay County residents lived in the same house 1 years ago.
Out of people who lived in different houses, 19% lived in this county.
Out of people who lived in different counties, 46% lived in Tennessee.
| Clay County: | 94.3% |
| State average: | 87.0% |
Place of birth for U.S.-born residents:
- This state: 4,218
- Other state: 3,272
- Northeast: 195
- Midwest: 1,493
- South: 1,397
- West: 143


- 75.6%Electricity
- 10.2%Utility gas
- 7.5%Bottled, tank, or LP gas
- 6.6%Wood

- 88.0%Electricity
- 9.2%Bottled, tank, or LP gas
- 2.8%Wood
Private vs. public school enrollment:
| Here: | 0.0% |
| Tennessee: | 15.0% |
| Here: | 0.0% |
| Tennessee: | 16.2% |
| Here: | 20.2% |
| Tennessee: | 23.5% |


Clay County government finances - Expenditure in 2017:
- Charges - Elementary and Secondary Education - Other: $615,000
Elementary and Secondary Education - Other: $562,000
Other: $447,000
Other: $124,000
Solid Waste Management: $111,000
Solid Waste Management: $104,000
Elementary and Secondary Education School Lunch: $103,000
Elementary and Secondary Education School Lunch: $69,000
Parks and Recreation: $4,000
- Construction - Elementary and Secondary Education: $85,000
Elementary and Secondary Education: $78,000
- Current Operations - Elementary and Secondary Education: $10,769,000
Elementary and Secondary Education: $9,929,000
Regular Highways: $2,593,000
Regular Highways: $1,645,000
Police Protection: $1,019,000
Police Protection: $1,004,000
Health - Other: $918,000
General - Other: $901,000
General - Other: $666,000
Health - Other: $645,000
Correctional Institutions: $584,000
Solid Waste Management: $535,000
Correctional Institutions: $474,000
Solid Waste Management: $451,000
Central Staff Services: $403,000
Central Staff Services: $403,000
Judicial and Legal Services: $389,000
Judicial and Legal Services: $368,000
Financial Administration: $334,000
Financial Administration: $240,000
General Public Buildings: $165,000
Natural Resources - Other: $149,000
Natural Resources - Other: $147,000
General Public Buildings: $118,000
Local Fire Protection: $113,000
Parks and Recreation: $104,000
Libraries: $102,000
Parks and Recreation: $100,000
Libraries: $99,000
Public Welfare - Other: $67,000
Local Fire Protection: $38,000
- Federal Intergovernmental - Other: $716,000
Other: $274,000
Education: $138,000
Education: $123,000
- General - Interest on Debt: $225,000
Interest on Debt: $205,000
- Intergovernmental to State - Health - Other: $11,000
Health - Other: $5,000
- Local Intergovernmental - Other: $641,000
Other: $610,000
General Local Government Support: $322,000
Education: $42,000
Education: $21,000
- Long Term Debt - Beginning Outstanding - Unspecified Public Purpose: $5,625,000
Outstanding Unspecified Public Purpose: $5,211,000
Beginning Outstanding - Unspecified Public Purpose: $4,515,000
Outstanding Unspecified Public Purpose: $4,198,000
Retired Unspecified Public Purpose: $438,000
Retired Unspecified Public Purpose: $317,000
Issue, Unspecified Public Purpose: $24,000
- Miscellaneous - Fines and Forfeits: $126,000
Fines and Forfeits: $125,000
General Revenue - Other: $102,000
General Revenue - Other: $86,000
Interest Earnings: $83,000
Donations From Private Sources: $45,000
Sale of Property: $44,000
Sale of Property: $33,000
Interest Earnings: $23,000
- Other Capital Outlay - Regular Highways: $641,000
Elementary and Secondary Education: $554,000
Elementary and Secondary Education: $323,000
- Other Funds - Cash and Securities: $4,082,000
Cash and Securities: $3,169,000
- Sinking Funds - Cash and Securities: $1,420,000
Cash and Securities: $1,144,000
- State Intergovernmental - Education: $9,579,000
Education: $8,540,000
General Local Government Support: $1,900,000
Highways: $1,883,000
Highways: $1,698,000
General Local Government Support: $622,000
Other: $334,000
Public Welfare: $22,000
Health and Hospitals: $13,000
Other: $8,000
Health and Hospitals: $4,000
- Tax - Property: $2,540,000
Property: $2,313,000
General Sales and Gross Receipts: $366,000
General Sales and Gross Receipts: $332,000
Motor Vehicle License: $198,000
Motor Vehicle License: $193,000
Alcoholic Beverage Sales: $165,000
Other Selective Sales: $136,000
Other Selective Sales: $110,000
Alcoholic Beverage Sales: $107,000
Occupation and Business License - Other: $44,000
Occupation and Business License - Other: $28,000
Other License: $27,000
Other License: $8,000
Severance: $5,000
Public Utilities Sales: $1,000
- Total Salaries and Wages: $6,504,000
: $6,006,000
Clay County government finances - Revenue in 2017:
- Charges - Elementary and Secondary Education - Other: $615,000
Elementary and Secondary Education - Other: $562,000
Other: $447,000
Other: $124,000
Solid Waste Management: $111,000
Solid Waste Management: $104,000
Elementary and Secondary Education School Lunch: $103,000
Elementary and Secondary Education School Lunch: $69,000
Parks and Recreation: $4,000
- Construction - Elementary and Secondary Education: $85,000
Elementary and Secondary Education: $78,000
- Current Operations - Elementary and Secondary Education: $10,769,000
Elementary and Secondary Education: $9,929,000
Regular Highways: $2,593,000
Regular Highways: $1,645,000
Police Protection: $1,019,000
Police Protection: $1,004,000
Health - Other: $918,000
General - Other: $901,000
General - Other: $666,000
Health - Other: $645,000
Correctional Institutions: $584,000
Solid Waste Management: $535,000
Correctional Institutions: $474,000
Solid Waste Management: $451,000
Central Staff Services: $403,000
Central Staff Services: $403,000
Judicial and Legal Services: $389,000
Judicial and Legal Services: $368,000
Financial Administration: $334,000
Financial Administration: $240,000
General Public Buildings: $165,000
Natural Resources - Other: $149,000
Natural Resources - Other: $147,000
General Public Buildings: $118,000
Local Fire Protection: $113,000
Parks and Recreation: $104,000
Libraries: $102,000
Parks and Recreation: $100,000
Libraries: $99,000
Public Welfare - Other: $67,000
Local Fire Protection: $38,000
- Federal Intergovernmental - Other: $716,000
Other: $274,000
Education: $138,000
Education: $123,000
- General - Interest on Debt: $225,000
Interest on Debt: $205,000
- Intergovernmental to State - Health - Other: $11,000
Health - Other: $5,000
- Local Intergovernmental - Other: $641,000
Other: $610,000
General Local Government Support: $322,000
Education: $42,000
Education: $21,000
- Long Term Debt - Beginning Outstanding - Unspecified Public Purpose: $5,625,000
Outstanding Unspecified Public Purpose: $5,211,000
Beginning Outstanding - Unspecified Public Purpose: $4,515,000
Outstanding Unspecified Public Purpose: $4,198,000
Retired Unspecified Public Purpose: $438,000
Retired Unspecified Public Purpose: $317,000
Issue, Unspecified Public Purpose: $24,000
- Miscellaneous - Fines and Forfeits: $126,000
Fines and Forfeits: $125,000
General Revenue - Other: $102,000
General Revenue - Other: $86,000
Interest Earnings: $83,000
Donations From Private Sources: $45,000
Sale of Property: $44,000
Sale of Property: $33,000
Interest Earnings: $23,000
- Other Capital Outlay - Regular Highways: $641,000
Elementary and Secondary Education: $554,000
Elementary and Secondary Education: $323,000
- Other Funds - Cash and Securities: $4,082,000
Cash and Securities: $3,169,000
- Sinking Funds - Cash and Securities: $1,420,000
Cash and Securities: $1,144,000
- State Intergovernmental - Education: $9,579,000
Education: $8,540,000
General Local Government Support: $1,900,000
Highways: $1,883,000
Highways: $1,698,000
General Local Government Support: $622,000
Other: $334,000
Public Welfare: $22,000
Health and Hospitals: $13,000
Other: $8,000
Health and Hospitals: $4,000
- Tax - Property: $2,540,000
Property: $2,313,000
General Sales and Gross Receipts: $366,000
General Sales and Gross Receipts: $332,000
Motor Vehicle License: $198,000
Motor Vehicle License: $193,000
Alcoholic Beverage Sales: $165,000
Other Selective Sales: $136,000
Other Selective Sales: $110,000
Alcoholic Beverage Sales: $107,000
Occupation and Business License - Other: $44,000
Occupation and Business License - Other: $28,000
Other License: $27,000
Other License: $8,000
Severance: $5,000
Public Utilities Sales: $1,000
- Total Salaries and Wages: $6,504,000
: $6,006,000
Clay County government finances - Debt in 2017:
- Charges - Elementary and Secondary Education - Other: $615,000
Elementary and Secondary Education - Other: $562,000
Other: $447,000
Other: $124,000
Solid Waste Management: $111,000
Solid Waste Management: $104,000
Elementary and Secondary Education School Lunch: $103,000
Elementary and Secondary Education School Lunch: $69,000
Parks and Recreation: $4,000
- Construction - Elementary and Secondary Education: $85,000
Elementary and Secondary Education: $78,000
- Current Operations - Elementary and Secondary Education: $10,769,000
Elementary and Secondary Education: $9,929,000
Regular Highways: $2,593,000
Regular Highways: $1,645,000
Police Protection: $1,019,000
Police Protection: $1,004,000
Health - Other: $918,000
General - Other: $901,000
General - Other: $666,000
Health - Other: $645,000
Correctional Institutions: $584,000
Solid Waste Management: $535,000
Correctional Institutions: $474,000
Solid Waste Management: $451,000
Central Staff Services: $403,000
Central Staff Services: $403,000
Judicial and Legal Services: $389,000
Judicial and Legal Services: $368,000
Financial Administration: $334,000
Financial Administration: $240,000
General Public Buildings: $165,000
Natural Resources - Other: $149,000
Natural Resources - Other: $147,000
General Public Buildings: $118,000
Local Fire Protection: $113,000
Parks and Recreation: $104,000
Libraries: $102,000
Parks and Recreation: $100,000
Libraries: $99,000
Public Welfare - Other: $67,000
Local Fire Protection: $38,000
- Federal Intergovernmental - Other: $716,000
Other: $274,000
Education: $138,000
Education: $123,000
- General - Interest on Debt: $225,000
Interest on Debt: $205,000
- Intergovernmental to State - Health - Other: $11,000
Health - Other: $5,000
- Local Intergovernmental - Other: $641,000
Other: $610,000
General Local Government Support: $322,000
Education: $42,000
Education: $21,000
- Long Term Debt - Beginning Outstanding - Unspecified Public Purpose: $5,625,000
Outstanding Unspecified Public Purpose: $5,211,000
Beginning Outstanding - Unspecified Public Purpose: $4,515,000
Outstanding Unspecified Public Purpose: $4,198,000
Retired Unspecified Public Purpose: $438,000
Retired Unspecified Public Purpose: $317,000
Issue, Unspecified Public Purpose: $24,000
- Miscellaneous - Fines and Forfeits: $126,000
Fines and Forfeits: $125,000
General Revenue - Other: $102,000
General Revenue - Other: $86,000
Interest Earnings: $83,000
Donations From Private Sources: $45,000
Sale of Property: $44,000
Sale of Property: $33,000
Interest Earnings: $23,000
- Other Capital Outlay - Regular Highways: $641,000
Elementary and Secondary Education: $554,000
Elementary and Secondary Education: $323,000
- Other Funds - Cash and Securities: $4,082,000
Cash and Securities: $3,169,000
- Sinking Funds - Cash and Securities: $1,420,000
Cash and Securities: $1,144,000
- State Intergovernmental - Education: $9,579,000
Education: $8,540,000
General Local Government Support: $1,900,000
Highways: $1,883,000
Highways: $1,698,000
General Local Government Support: $622,000
Other: $334,000
Public Welfare: $22,000
Health and Hospitals: $13,000
Other: $8,000
Health and Hospitals: $4,000
- Tax - Property: $2,540,000
Property: $2,313,000
General Sales and Gross Receipts: $366,000
General Sales and Gross Receipts: $332,000
Motor Vehicle License: $198,000
Motor Vehicle License: $193,000
Alcoholic Beverage Sales: $165,000
Other Selective Sales: $136,000
Other Selective Sales: $110,000
Alcoholic Beverage Sales: $107,000
Occupation and Business License - Other: $44,000
Occupation and Business License - Other: $28,000
Other License: $27,000
Other License: $8,000
Severance: $5,000
Public Utilities Sales: $1,000
- Total Salaries and Wages: $6,504,000
: $6,006,000
Clay County government finances - Cash and Securities in 2017:
- Charges - Elementary and Secondary Education - Other: $615,000
Elementary and Secondary Education - Other: $562,000
Other: $447,000
Other: $124,000
Solid Waste Management: $111,000
Solid Waste Management: $104,000
Elementary and Secondary Education School Lunch: $103,000
Elementary and Secondary Education School Lunch: $69,000
Parks and Recreation: $4,000
- Construction - Elementary and Secondary Education: $85,000
Elementary and Secondary Education: $78,000
- Current Operations - Elementary and Secondary Education: $10,769,000
Elementary and Secondary Education: $9,929,000
Regular Highways: $2,593,000
Regular Highways: $1,645,000
Police Protection: $1,019,000
Police Protection: $1,004,000
Health - Other: $918,000
General - Other: $901,000
General - Other: $666,000
Health - Other: $645,000
Correctional Institutions: $584,000
Solid Waste Management: $535,000
Correctional Institutions: $474,000
Solid Waste Management: $451,000
Central Staff Services: $403,000
Central Staff Services: $403,000
Judicial and Legal Services: $389,000
Judicial and Legal Services: $368,000
Financial Administration: $334,000
Financial Administration: $240,000
General Public Buildings: $165,000
Natural Resources - Other: $149,000
Natural Resources - Other: $147,000
General Public Buildings: $118,000
Local Fire Protection: $113,000
Parks and Recreation: $104,000
Libraries: $102,000
Parks and Recreation: $100,000
Libraries: $99,000
Public Welfare - Other: $67,000
Local Fire Protection: $38,000
- Federal Intergovernmental - Other: $716,000
Other: $274,000
Education: $138,000
Education: $123,000
- General - Interest on Debt: $225,000
Interest on Debt: $205,000
- Intergovernmental to State - Health - Other: $11,000
Health - Other: $5,000
- Local Intergovernmental - Other: $641,000
Other: $610,000
General Local Government Support: $322,000
Education: $42,000
Education: $21,000
- Long Term Debt - Beginning Outstanding - Unspecified Public Purpose: $5,625,000
Outstanding Unspecified Public Purpose: $5,211,000
Beginning Outstanding - Unspecified Public Purpose: $4,515,000
Outstanding Unspecified Public Purpose: $4,198,000
Retired Unspecified Public Purpose: $438,000
Retired Unspecified Public Purpose: $317,000
Issue, Unspecified Public Purpose: $24,000
- Miscellaneous - Fines and Forfeits: $126,000
Fines and Forfeits: $125,000
General Revenue - Other: $102,000
General Revenue - Other: $86,000
Interest Earnings: $83,000
Donations From Private Sources: $45,000
Sale of Property: $44,000
Sale of Property: $33,000
Interest Earnings: $23,000
- Other Capital Outlay - Regular Highways: $641,000
Elementary and Secondary Education: $554,000
Elementary and Secondary Education: $323,000
- Other Funds - Cash and Securities: $4,082,000
Cash and Securities: $3,169,000
- Sinking Funds - Cash and Securities: $1,420,000
Cash and Securities: $1,144,000
- State Intergovernmental - Education: $9,579,000
Education: $8,540,000
General Local Government Support: $1,900,000
Highways: $1,883,000
Highways: $1,698,000
General Local Government Support: $622,000
Other: $334,000
Public Welfare: $22,000
Health and Hospitals: $13,000
Other: $8,000
Health and Hospitals: $4,000
- Tax - Property: $2,540,000
Property: $2,313,000
General Sales and Gross Receipts: $366,000
General Sales and Gross Receipts: $332,000
Motor Vehicle License: $198,000
Motor Vehicle License: $193,000
Alcoholic Beverage Sales: $165,000
Other Selective Sales: $136,000
Other Selective Sales: $110,000
Alcoholic Beverage Sales: $107,000
Occupation and Business License - Other: $44,000
Occupation and Business License - Other: $28,000
Other License: $27,000
Other License: $8,000
Severance: $5,000
Public Utilities Sales: $1,000
- Total Salaries and Wages: $6,504,000
: $6,006,000
Supplemental Security Income (SSI) in 2006:
- Total number of recipients: 429
- Number of aged recipients: 77
- Number of blind and disabled recipients: 352
- Number of recipients under 18: 18
- Number of recipients between 18 and 64: 257
- Number of recipients older than 64: 154
- Number of recipients also receiving OASDI: 213
- Amount of payments (thousands of dollars): 169
| Most common first names in Clay County, TN among deceased individuals | ||
| Name | Count | Lived (average) |
|---|---|---|
| James | 47 | 72.4 years |
| Mary | 38 | 82.1 years |
| John | 38 | 77.0 years |
| William | 34 | 74.1 years |
| Willie | 26 | 75.1 years |
| Charles | 21 | 71.6 years |
| Joe | 20 | 73.7 years |
| Robert | 20 | 68.5 years |
| Walter | 19 | 73.5 years |
| Charlie | 17 | 73.2 years |
| Most common last names in Clay County, TN among deceased individuals | ||
| Last name | Count | Lived (average) |
|---|---|---|
| Watson | 46 | 75.9 years |
| Smith | 45 | 73.8 years |
| Brown | 38 | 71.6 years |
| Scott | 34 | 75.0 years |
| Rich | 27 | 72.8 years |
| Poindexter | 26 | 69.5 years |
| Boles | 25 | 70.7 years |
| Johnson | 25 | 69.1 years |
| Key | 25 | 68.4 years |
| Hamilton | 24 | 79.3 years |
| Businesses in Clay County, TN | ||||
| Name | Count | Name | Count | |
|---|---|---|---|---|
| Dairy Queen | 1 | Rite Aid | 1 | |
| GNC | 1 | Subway | 1 | |
| H&R Block | 1 | U-Haul | 1 | |
| MasterBrand Cabinets | 2 | U.S. Cellular | 1 | |
| RadioShack | 1 | |||