Crime rate in Birmingham, Alabama (AL): murders, rapes, robberies, assaults, burglaries, thefts, auto thefts, arson, law enforcement employees, police officers, crime map
Crime rate in Birmingham, AL
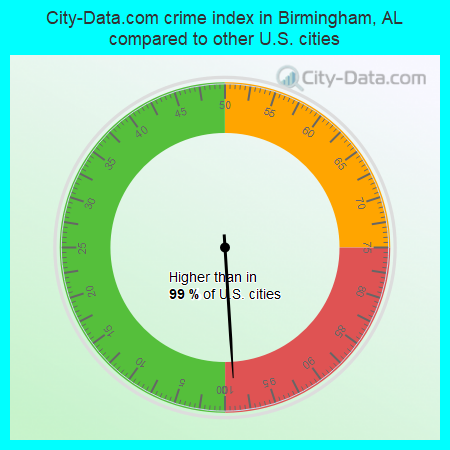
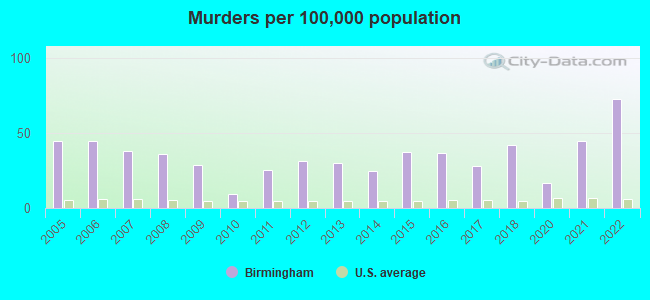
The 2022 crime rate in Birmingham, AL is 738 (City-Data.com crime index), which is 3.0 times greater than the U.S. average. It was higher than in 99.0% U.S. cities. The 2022 Birmingham crime rate rose by 20% compared to 2021. The number of homicides stood at 142 - an increase of 50 compared to 2021. In the last 5 years Birmingham has seen decreasing violent crime and decreasing property crime.See how dangerous Birmingham, AL is compared to the nearest cities:
(Note: Higher means more crime)
(Note: Higher means more crime)
| Birmingham: | 738.1 |
| Homewood: | 79.5 |
| Mountain Brook: | 52.4 |
| Tarrant: | 801.6 |
| Fultondale: | 187.1 |
| Vestavia Hills: | 76.4 |
| Fairfield: | 3.3 |
| Irondale: | 218.7 |
| Midfield: | 203.9 |
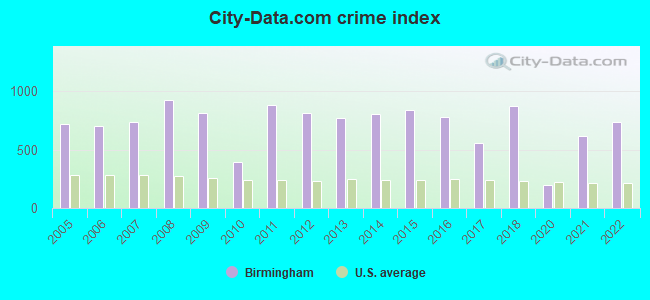
The City-Data.com crime index weighs serious crimes and violent crimes more heavily. Higher means more crime, U.S. average is 246.1. It adjusts for the number of visitors and daily workers commuting into cities.
- means the value is smaller than the state average.- means the value is about the same as the state average.
- means the value is bigger than the state average.
- means the value is much bigger than the state average.
According to our research of Alabama and other state lists, there were 660 registered sex offenders living in Birmingham, Alabama as of June 02, 2024.
The ratio of all residents to sex offenders in Birmingham is 322 to 1.
Violent crime rate in 2022
| Birmingham: | 965.9 |
| U.S. Average: | 219.8 |
Violent crime rate in 2021
| Birmingham: | 841.0 |
| U.S. Average: | 224.8 |
Violent crime rate in 2020
| Birmingham: | 237.5 |
| U.S. Average: | 228.2 |
Violent crime rate in 2018
| Birmingham: | 1,061.2 |
| U.S. Average: | 221.2 |
Violent crime rate in 2017
| Birmingham: | 639.1 |
| U.S. Average: | 226.2 |
Violent crime rate in 2016
| Birmingham: | 894.9 |
| U.S. Average: | 227.3 |
Violent crime rate in 2015
| Birmingham: | 966.4 |
| U.S. Average: | 219.3 |
Violent crime rate in 2014
| Birmingham: | 873.8 |
| U.S. Average: | 211.1 |
Violent crime rate in 2013
| Birmingham: | 759.2 |
| U.S. Average: | 214.2 |
Violent crime rate in 2012
| Birmingham: | 841.7 |
| U.S. Average: | 187.4 |
Violent crime rate in 2011
| Birmingham: | 822.2 |
| U.S. Average: | 187.1 |
Violent crime rate in 2010
| Birmingham: | 349.6 |
| U.S. Average: | 195.7 |
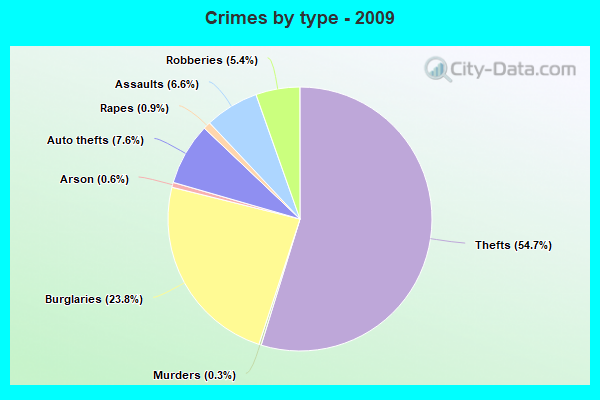
Violent crime rate in 2009
| Birmingham: | 704.8 |
| U.S. Average: | 208.9 |
Violent crime rate in 2008
| Birmingham: | 811.8 |
| U.S. Average: | 222.5 |
Violent crime rate in 2007
| Birmingham: | 659.6 |
| U.S. Average: | 229.1 |
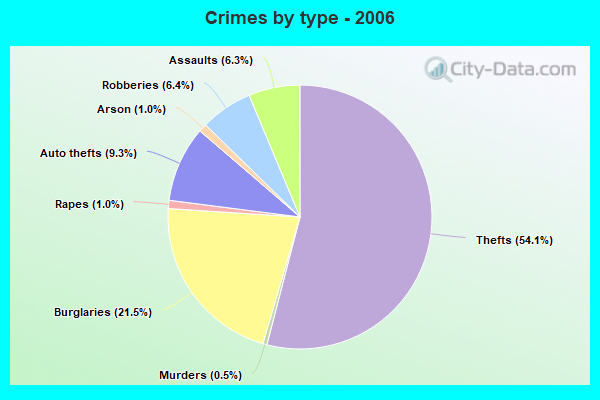
Violent crime rate in 2006
| Birmingham: | 626.1 |
| U.S. Average: | 232.6 |
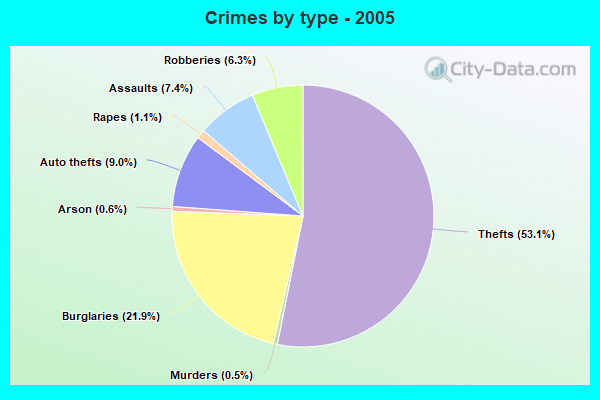
Violent crime rate in 2005
| Birmingham: | 673.0 |
| U.S. Average: | 227.0 |
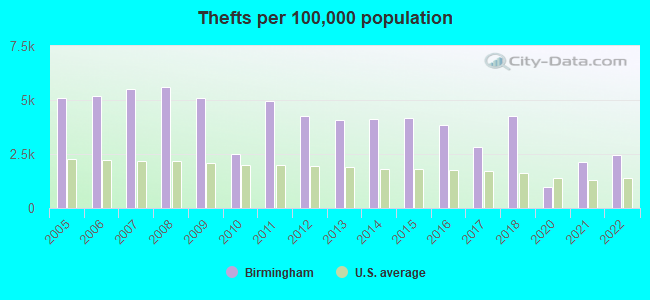
Property crime rate in 2022
| Birmingham: | 417.7 |
| U.S. Average: | 166.5 |
Property crime rate in 2021
| Birmingham: | 356.5 |
| U.S. Average: | 157.8 |
Property crime rate in 2020
| Birmingham: | 129.5 |
| U.S. Average: | 169.6 |
Property crime rate in 2018
| Birmingham: | 580.9 |
| U.S. Average: | 190.2 |
Property crime rate in 2017
| Birmingham: | 385.1 |
| U.S. Average: | 206.4 |
Property crime rate in 2016
| Birmingham: | 561.8 |
| U.S. Average: | 216.6 |
Property crime rate in 2015
| Birmingham: | 611.6 |
| U.S. Average: | 221.5 |
Property crime rate in 2014
| Birmingham: | 661.2 |
| U.S. Average: | 230.8 |
Property crime rate in 2013
| Birmingham: | 687.9 |
| U.S. Average: | 250.4 |
Property crime rate in 2012
| Birmingham: | 726.4 |
| U.S. Average: | 267.3 |
Property crime rate in 2011
| Birmingham: | 897.6 |
| U.S. Average: | 273.5 |
Property crime rate in 2010
| Birmingham: | 422.2 |
| U.S. Average: | 276.4 |
Property crime rate in 2009
| Birmingham: | 800.5 |
| U.S. Average: | 285.6 |
Property crime rate in 2008
| Birmingham: | 871.5 |
| U.S. Average: | 302.2 |
Property crime rate in 2007
| Birmingham: | 670.9 |
| U.S. Average: | 309.2 |
Property crime rate in 2006
| Birmingham: | 635.2 |
| U.S. Average: | 317.3 |
Property crime rate in 2005
| Birmingham: | 635.3 |
| U.S. Average: | 322.3 |
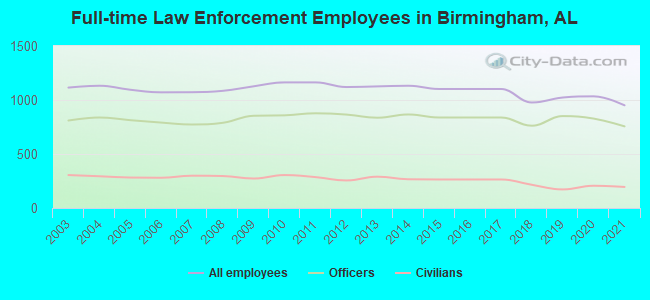
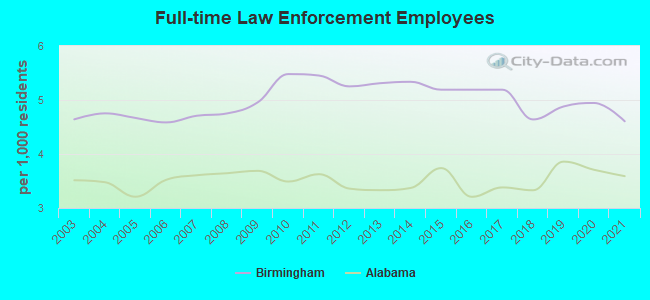
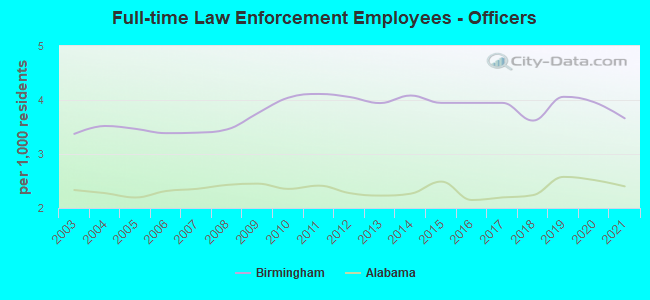
Full-time law enforcement employees in 2021, including police officers: 951 (756 officers - 651 male; 105 female).
| Officers per 1,000 residents here: | 3.66 |
| Alabama average: | 2.40 |
Full-time law enforcement employees in 2020, including police officers: 1,034 (828 officers - 714 male; 114 female).
| Officers per 1,000 residents here: | 3.96 |
| Alabama average: | 2.52 |
Full-time law enforcement employees in 2019, including police officers: 1,023 (851 officers - 731 male; 120 female).
| Officers per 1,000 residents here: | 4.06 |
| Alabama average: | 2.58 |
Full-time law enforcement employees in 2018, including police officers: 977 (762 officers - 650 male; 112 female).
| Officers per 1,000 residents here: | 3.62 |
| Alabama average: | 2.24 |
Full-time law enforcement employees in 2015, including police officers: 1,102 (838 officers - 710 male; 128 female).
| Officers per 1,000 residents here: | 3.95 |
| Alabama average: | 2.49 |
Full-time law enforcement employees in 2014, including police officers: 1,132 (866 officers - 735 male; 131 female).
| Officers per 1,000 residents here: | 4.08 |
| Alabama average: | 2.27 |
Full-time law enforcement employees in 2013, including police officers: 1,126 (836 officers - 707 male; 129 female).
| Officers per 1,000 residents here: | 3.94 |
| Alabama average: | 2.23 |
Full-time law enforcement employees in 2012, including police officers: 1,120 (865 officers - 731 male; 134 female).
| Officers per 1,000 residents here: | 4.06 |
| Alabama average: | 2.28 |
Full-time law enforcement employees in 2011, including police officers: 1,163 (877 officers - 737 male; 140 female).
| Officers per 1,000 residents here: | 4.11 |
| Alabama average: | 2.41 |
Full-time law enforcement employees in 2010, including police officers: 1,163 (858 officers - 722 male; 136 female).
| Officers per 1,000 residents here: | 4.04 |
| Alabama average: | 2.35 |
Full-time law enforcement employees in 2009, including police officers: 1,127 (854 officers - 718 male; 136 female).
| Officers per 1,000 residents here: | 3.76 |
| Alabama average: | 2.45 |
Full-time law enforcement employees in 2008, including police officers: 1,085 (789 officers - 653 male; 136 female).
| Officers per 1,000 residents here: | 3.46 |
| Alabama average: | 2.43 |
Full-time law enforcement employees in 2007, including police officers: 1,072 (773 officers - 639 male; 134 female).
| Officers per 1,000 residents here: | 3.40 |
| Alabama average: | 2.35 |
Full-time law enforcement employees in 2006, including police officers: 1,071 (791 officers - 654 male; 137 female).
| Officers per 1,000 residents here: | 3.39 |
| Alabama average: | 2.31 |
Full-time law enforcement employees in 2005, including police officers: 1,095 (813 officers - 674 male; 139 female).
| Officers per 1,000 residents here: | 3.47 |
| Alabama average: | 2.20 |
Full-time law enforcement employees in 2004, including police officers: 1,132 (838 officers - 692 male; 146 female).
| Officers per 1,000 residents here: | 3.52 |
| Alabama average: | 2.28 |
Full-time law enforcement employees in 2003, including police officers: 1,115 (810 officers - 675 male; 135 female).
| Officers per 1,000 residents here: | 3.37 |
| Alabama average: | 2.33 |


Zip codes: 35061, 35064, 35068, 35094, 35117, 35126, 35127, 35203, 35204, 35205, 35206, 35207, 35208, 35209, 35210, 35212, 35213, 35215, 35217, 35218, 35221, 35222, 35223, 35228, 35233, 35234, 35235, 35242, 35243, 35254.