Crime rate in Kenosha, Wisconsin (WI): murders, rapes, robberies, assaults, burglaries, thefts, auto thefts, arson, law enforcement employees, police officers, crime map
Crime rate in Kenosha, WI
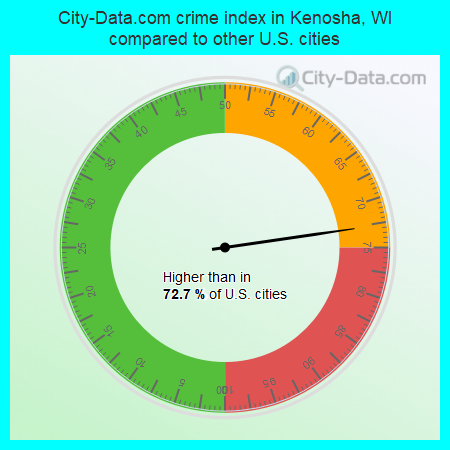
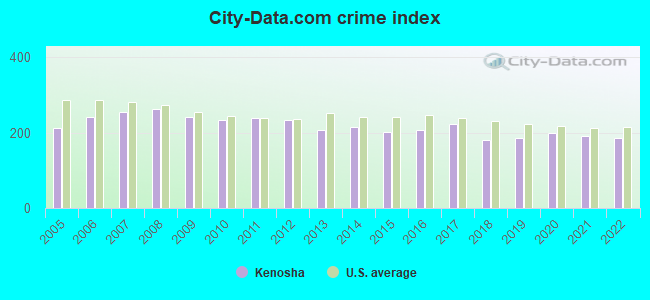
The 2022 crime rate in Kenosha, WI is 187 (City-Data.com crime index), which is 1.3 times smaller than the U.S. average. It was higher than in 72.7% U.S. cities. The 2022 Kenosha crime rate fell by 3% compared to 2021. The number of homicides stood at 7 - a decrease of 6 compared to 2021. In the last 5 years Kenosha has seen rise of violent crime and decline of property crime.See how dangerous Kenosha, WI is compared to the nearest cities:
(Note: Higher means more crime)
(Note: Higher means more crime)
| Kenosha: | 186.8 |
| Pleasant Prairie: | 113.3 |
| Winthrop Harbor: | 26.7 |
| Sturtevant: | 47.5 |
| Mount Pleasant: | 108.8 |
| Zion: | 301.6 |
| Racine: | 213.2 |
| Wind Point: | 6.8 |
| Antioch: | 15.6 |
The City-Data.com crime index weighs serious crimes and violent crimes more heavily. Higher means more crime, U.S. average is 246.1. It adjusts for the number of visitors and daily workers commuting into cities.
- means the value is smaller than the state average.- means the value is about the same as the state average.
- means the value is bigger than the state average.
- means the value is much bigger than the state average.
According to our research of Wisconsin and other state lists, there were 414 registered sex offenders living in Kenosha, Wisconsin as of June 02, 2024.
The ratio of all residents to sex offenders in Kenosha is 242 to 1.
Violent crime rate in 2022
| Kenosha: | 240.8 |
| U.S. Average: | 219.8 |
Violent crime rate in 2021
| Kenosha: | 232.0 |
| U.S. Average: | 224.8 |
Violent crime rate in 2020
| Kenosha: | 230.5 |
| U.S. Average: | 228.2 |
Violent crime rate in 2019
| Kenosha: | 191.5 |
| U.S. Average: | 219.9 |
Violent crime rate in 2018
| Kenosha: | 199.1 |
| U.S. Average: | 221.2 |
Violent crime rate in 2017
| Kenosha: | 239.3 |
| U.S. Average: | 226.2 |
Violent crime rate in 2016
| Kenosha: | 196.1 |
| U.S. Average: | 227.3 |
Violent crime rate in 2015
| Kenosha: | 170.9 |
| U.S. Average: | 219.3 |
Violent crime rate in 2014
| Kenosha: | 169.0 |
| U.S. Average: | 211.1 |
Violent crime rate in 2013
| Kenosha: | 156.8 |
| U.S. Average: | 214.2 |
Violent crime rate in 2012
| Kenosha: | 156.5 |
| U.S. Average: | 187.4 |
Violent crime rate in 2011
| Kenosha: | 165.1 |
| U.S. Average: | 187.1 |
Violent crime rate in 2010
| Kenosha: | 159.7 |
| U.S. Average: | 195.7 |
Violent crime rate in 2009
| Kenosha: | 162.8 |
| U.S. Average: | 208.9 |
Violent crime rate in 2008
| Kenosha: | 202.1 |
| U.S. Average: | 222.5 |
Violent crime rate in 2007
| Kenosha: | 183.2 |
| U.S. Average: | 229.1 |
Violent crime rate in 2006
| Kenosha: | 186.8 |
| U.S. Average: | 232.6 |
Violent crime rate in 2005
| Kenosha: | 135.1 |
| U.S. Average: | 227.0 |
Property crime rate in 2022
| Kenosha: | 84.8 |
| U.S. Average: | 166.5 |
Property crime rate in 2021
| Kenosha: | 93.4 |
| U.S. Average: | 157.8 |
Property crime rate in 2020
| Kenosha: | 126.9 |
| U.S. Average: | 169.6 |
Property crime rate in 2019
| Kenosha: | 124.2 |
| U.S. Average: | 179.7 |
Property crime rate in 2018
| Kenosha: | 117.1 |
| U.S. Average: | 190.2 |
Property crime rate in 2017
| Kenosha: | 148.9 |
| U.S. Average: | 206.4 |
Property crime rate in 2016
| Kenosha: | 177.9 |
| U.S. Average: | 216.6 |
Property crime rate in 2015
| Kenosha: | 175.0 |
| U.S. Average: | 221.5 |
Property crime rate in 2014
| Kenosha: | 212.4 |
| U.S. Average: | 230.8 |
Property crime rate in 2013
| Kenosha: | 214.0 |
| U.S. Average: | 250.4 |
Property crime rate in 2012
| Kenosha: | 265.8 |
| U.S. Average: | 267.3 |
Property crime rate in 2011
| Kenosha: | 250.9 |
| U.S. Average: | 273.5 |
Property crime rate in 2010
| Kenosha: | 253.4 |
| U.S. Average: | 276.4 |
Property crime rate in 2009
| Kenosha: | 258.7 |
| U.S. Average: | 285.6 |
Property crime rate in 2008
| Kenosha: | 263.2 |
| U.S. Average: | 302.2 |
Property crime rate in 2007
| Kenosha: | 278.6 |
| U.S. Average: | 309.2 |
Property crime rate in 2006
| Kenosha: | 235.7 |
| U.S. Average: | 317.3 |
Property crime rate in 2005
| Kenosha: | 231.1 |
| U.S. Average: | 322.3 |


Full-time law enforcement employees in 2021, including police officers: 427 (207 officers - 186 male; 21 female).
| Officers per 1,000 residents here: | 2.08 |
| Wisconsin average: | 2.07 |
Full-time law enforcement employees in 2020, including police officers: 212 (199 officers - 173 male; 26 female).
| Officers per 1,000 residents here: | 1.99 |
| Wisconsin average: | 2.11 |
Full-time law enforcement employees in 2019, including police officers: 218 (206 officers - 181 male; 25 female).
| Officers per 1,000 residents here: | 2.05 |
| Wisconsin average: | 2.27 |
Full-time law enforcement employees in 2018, including police officers: 207 (196 officers - 178 male; 18 female).
| Officers per 1,000 residents here: | 1.96 |
| Wisconsin average: | 2.23 |
Full-time law enforcement employees in 2017, including police officers: 210 (199 officers - 179 male; 20 female).
| Officers per 1,000 residents here: | 2.00 |
| Wisconsin average: | 2.24 |
Full-time law enforcement employees in 2016, including police officers: 208 (199 officers - 180 male; 19 female).
| Officers per 1,000 residents here: | 1.99 |
| Wisconsin average: | 2.23 |
Full-time law enforcement employees in 2015, including police officers: 215 (203 officers - 182 male; 21 female).
| Officers per 1,000 residents here: | 2.03 |
| Wisconsin average: | 2.22 |
Full-time law enforcement employees in 2014, including police officers: 210 (198 officers - 179 male; 19 female).
| Officers per 1,000 residents here: | 1.98 |
| Wisconsin average: | 2.23 |
Full-time law enforcement employees in 2013, including police officers: 210 (199 officers - 179 male; 20 female).
| Officers per 1,000 residents here: | 1.98 |
| Wisconsin average: | 2.19 |
Full-time law enforcement employees in 2012, including police officers: 209 (199 officers - 179 male; 20 female).
| Officers per 1,000 residents here: | 1.99 |
| Wisconsin average: | 2.22 |
Full-time law enforcement employees in 2011, including police officers: 208 (199 officers - 180 male; 19 female).
| Officers per 1,000 residents here: | 2.00 |
| Wisconsin average: | 2.24 |
Full-time law enforcement employees in 2010, including police officers: 208 (199 officers - 180 male; 19 female).
| Officers per 1,000 residents here: | 2.01 |
| Wisconsin average: | 2.31 |
Full-time law enforcement employees in 2009, including police officers: 209 (199 officers - 182 male; 17 female).
| Officers per 1,000 residents here: | 2.04 |
| Wisconsin average: | 2.32 |
Full-time law enforcement employees in 2008, including police officers: 204 (194 officers - 175 male; 19 female).
| Officers per 1,000 residents here: | 2.00 |
| Wisconsin average: | 2.32 |
Full-time law enforcement employees in 2007, including police officers: 196 (185 officers - 169 male; 16 female).
| Officers per 1,000 residents here: | 1.91 |
| Wisconsin average: | 2.32 |
Full-time law enforcement employees in 2006, including police officers: 197 (186 officers - 169 male; 17 female).
| Officers per 1,000 residents here: | 1.95 |
| Wisconsin average: | 2.35 |
Full-time law enforcement employees in 2005, including police officers: 194 (183 officers - 169 male; 14 female).
| Officers per 1,000 residents here: | 1.94 |
| Wisconsin average: | 2.36 |
Full-time law enforcement employees in 2004, including police officers: 177 (166 officers - 153 male; 13 female).
| Officers per 1,000 residents here: | 1.78 |
| Wisconsin average: | 2.33 |
Full-time law enforcement employees in 2003, including police officers: 263 (186 officers - 171 male; 15 female).
| Officers per 1,000 residents here: | 2.00 |
| Wisconsin average: | 2.37 |


