Athol: Fire Incidents, Massachusetts (MA)
Where are fire incidents reported in Athol, MA
Something went wrong! Please refresh the page.
| Fire incidents reported | |
|---|---|
| Sreet name | Count |
| MAIN ST | 218 |
| CRESCENT ST | 54 |
| PLEASANT ST | 50 |
| CHESTNUT HILL AVE | 46 |
| PETERSHAM RD | 42 |
| COTTAGE ST | 40 |
| SOUTH ATHOL RD | 38 |
| SOUTH ST | 38 |
| BEARSDEN RD | 36 |
| SCHOOL ST | 34 |
| SOUTH MAIN ST | 34 |
| CONANT RD | 32 |
| SILVER LAKE ST | 32 |
| PEQUOIG AVE | 30 |
| SANDERS ST | 30 |
| EXCHANGE ST | 28 |
| HAPGOOD ST | 28 |
| PARTRIDGEVILLE RD | 28 |
| TEMPLETON RD | 28 |
| WHITE POND RD | 28 |
| DANIEL SHAYS HWY | 26 |
| S MAIN ST | 24 |
| BROOKSIDE RD | 22 |
| MAIN ST. | 22 |
| PARK ST | 22 |
| CHESTNUT HILL AVE | 20 |
| GREEN ST | 20 |
| MAIN ST | 20 |
| MARBLE ST | 18 |
| CANAL ST | 16 |
| Other | 183 |
2002 - 2018 National Fire Incident Reporting System (NFIRS) incidents
- Incident types reported to NFIRS in Athol, MA
- 6,21450.0%Rescue & EMS
- 1,76814.2%Hazardous Condition
- 1,30910.5%Service Call
- 1,28710.4%Fire
- 9477.6%Good Intent Call
- 8196.6%False Alarm
- 510.4%Special Incident
- 180.1%Overpressure Rupture
- Fire incident types reported to NFIRS in Athol, MA
- 57744.8%Structure Fires
- 44334.4%Outside Fires
- 13610.6%Mobile Property/Vehicle Fires
- 13110.2%Other
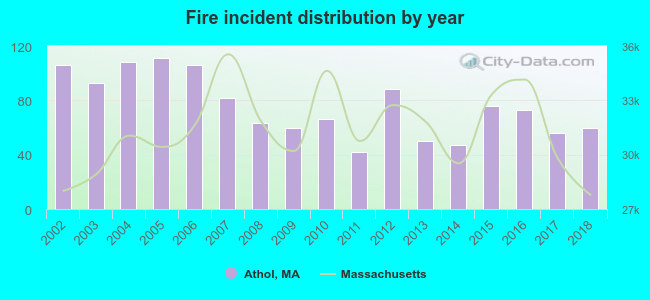 According to the data from the years 2002 - 2018 the average number of fire incidents per year is 76. The highest number of reported fire incidents - 111 took place in 2005, and the least - 42 in 2011. The data has a decreasing trend.
The average number of yearly fire incidents per 10k residents in Athol, MA compared to nearest cities:
(Note: Based on data for the last 3 years, including only cities with population 5,000 and above)
| Athol: | 76.2 |
| Templeton: | 10.0 |
| Gardner: | 93.2 |
| Montague: | 5.9 |
| Ashburnham: | 32.3 |
| Westminster: | 49.9 |
| Greenfield: | 61.7 |
| Deerfield: | 20.2 |
| Amherst: | 19.9 |
 The median response time based on all reported fire incidents is 5 minutes. This is higher than the state median value.
The median response time in Athol, MA compared to nearest cities:
(Note: Based on data for all years, including only cities with at least 500 fire incidents)
| Athol: | 5 minutes |
| Orange: | 7 minutes |
| Winchendon: | 5 minutes |
| Gardner: | 4 minutes |
| Turners Falls: | 5 minutes |
| Westminster: | 6 minutes |
| Greenfield: | 5 minutes |
| Amherst: | 6 minutes |
| Fitchburg: | 4 minutes |
 According to the data from the years 2002 - 2018 the average number of fire-related yearly deaths is 0. The highest number of reported deaths - 2 took place in 2015, and the lowest - 0 in 2003. The data has a declining trend.
 Based on the reports from the years 2002 - 2018 the average number of fire-related yearly casualties is 1. The highest number of reported injuries - 4 took place in 2010, and the lowest - 0 in 2008. The data has a dropping trend.
The average number of casualties per 1,000 fires is 18. This indicator was the highest - 85 in 2014, and the lowest 0 in 2008. The trend for injuries per 1,000 incidents is decreasing. Compared to the Massachusetts value the number of injuries per 1,000 fire incidents is higher.
Based on the reports from the years 2002 - 2018 the average number of fire-related yearly casualties is 1. The highest number of reported injuries - 4 took place in 2010, and the lowest - 0 in 2008. The data has a dropping trend.
The average number of casualties per 1,000 fires is 18. This indicator was the highest - 85 in 2014, and the lowest 0 in 2008. The trend for injuries per 1,000 incidents is decreasing. Compared to the Massachusetts value the number of injuries per 1,000 fire incidents is higher.Casualties per 1,000 incidents in Athol, MA compared to nearest cities:
(Note: Based on data for all years, including only cities with at least 500 fire incidents)
| Athol: | 16.3 |
| Orange: | 12.2 |
| Winchendon: | 10.0 |
| Gardner: | 9.0 |
| Turners Falls: | 12.5 |
| Westminster: | 10.7 |
| Greenfield: | 15.7 |
| Amherst: | 27.6 |
| Fitchburg: | 15.4 |
 34.6% incidents where reported in the morning and 65.4% in the evening. The most fires (16.6%) took place on Thursday, and the least (12.4%) on Wednesday.
 According to the 1,287 fire incidents from years 2002 - 2018 most fires (13.3%) took place during April, and the least (4.7%) in September.
 Out of all 12,425 cases reported during the years 2002 - 2018, the most belonged to the categories: Rescue & EMS (50.0%), Hazardous Condition (14.2%), and Service Call (10.5%).
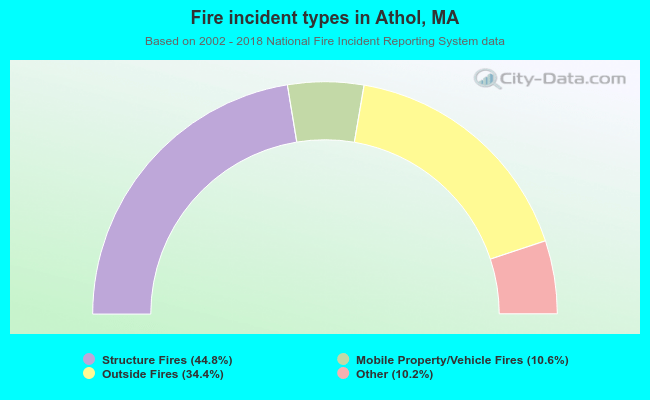 When looking into fire subcategories, the most reports belonged to: Structure Fires (44.8%), and Outside Fires (34.4%).