East Bridgewater: Fire Incidents, Massachusetts (MA)
Where are fire incidents reported in East Bridgewater, MA
Something went wrong! Please refresh the page.
| Fire incidents reported | |
|---|---|
| Sreet name | Count |
| BEDFORD ST | 262 |
| PLYMOUTH ST | 124 |
| CENTRAL (#1-1140) ST | 64 |
| UNION ST | 62 |
| POND ST | 50 |
| CENTRAL ST | 42 |
| WASHINGTON (#1-1055) ST | 38 |
| ELM ST | 36 |
| RIDDELL RD | 32 |
| HARVARD ST | 30 |
| BRIDGE ST | 28 |
| SPRING ST | 28 |
| WHITMAN ST | 28 |
| BELMONT ST | 26 |
| CENTRAL11140 ST | 26 |
| PLEASANT ST | 26 |
| SUMMER ST | 26 |
| HIGHLAND ST | 22 |
| WASHINGTON (#1094 & UP) ST | 20 |
| WINTER ST | 20 |
| CEDAR ST | 18 |
| COOK ST | 18 |
| DOUGLAS DR | 18 |
| FRANKLIN ST | 18 |
| PROSPECT ST | 18 |
| WALNUT ST | 18 |
| CENTRAL (1168 & UP) ST | 16 |
| CRESCENT (395 & UP) ST | 16 |
| LAUREL ST | 16 |
| OAK ST | 16 |
2002 - 2018 National Fire Incident Reporting System (NFIRS) incidents
- Incident types reported to NFIRS in East Bridgewater, MA
- 9,14361.5%Rescue & EMS
- 2,28115.3%Hazardous Condition
- 1,0136.8%False Alarm
- 9596.4%Fire
- 8886.0%Service Call
- 4593.1%Good Intent Call
- 760.5%Severe Weather
- 400.3%Special Incident
- Fire incident types reported to NFIRS in East Bridgewater, MA
- 46748.7%Structure Fires
- 37439.0%Outside Fires
- 10010.4%Mobile Property/Vehicle Fires
- 181.9%Other
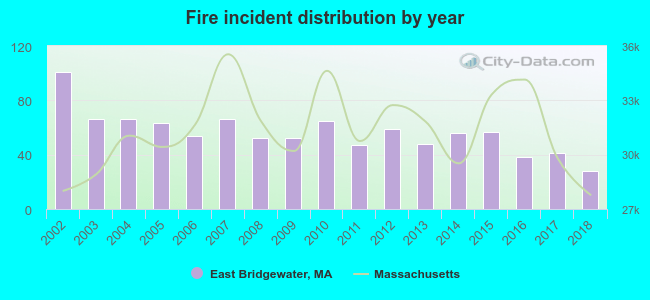 Based on the data from the years 2002 - 2018 the average number of fires per year is 56. The highest number of fire incidents - 101 took place in 2002, and the least - 28 in 2018. The data has a decreasing trend.
The average number of yearly fire incidents per 10k residents in East Bridgewater, MA compared to nearest cities:
(Note: Based on data for the last 3 years, including only cities with population 5,000 and above)
| East Bridgewater: | 25.9 |
| Bridgewater: | 125.4 |
| Whitman: | 19.8 |
| West Bridgewater: | 57.4 |
| Halifax: | 35.5 |
| Brockton: | 60.2 |
| Abington: | 34.0 |
| Rockland: | 46.9 |
| Pembroke: | 3.6 |
 The median response time based on all reported fire incidents is 5 minutes. This is higher than the Massachusetts median value.
The median response time in East Bridgewater, MA compared to nearest cities:
(Note: Based on data for all years, including only cities with at least 500 fire incidents)
| East Bridgewater: | 5 minutes |
| Bridgewater: | 5 minutes |
| Whitman: | 2 minutes |
| West Bridgewater: | 4 minutes |
| Hanson: | 5 minutes |
| Brockton: | 4 minutes |
| Abington: | 4 minutes |
| Rockland: | 3 minutes |
| Hanover: | 5 minutes |
 Based on the reports from the years 2002 - 2018 the average number of fire-related casualties per year is 1. The highest number of reported casualties - 4 took place in 2006, and the lowest - 0 in 2002. The data has a rising trend.
The average number of injuries per 1,000 fire incidents is 19. This indicator was the highest - 74 in 2006, and the lowest 0 in 2002. The trend for injuries per 1,000 incidents is rising. Compared to the state value the number of casualties per 1,000 fire incidents is higher.
Based on the reports from the years 2002 - 2018 the average number of fire-related casualties per year is 1. The highest number of reported casualties - 4 took place in 2006, and the lowest - 0 in 2002. The data has a rising trend.
The average number of injuries per 1,000 fire incidents is 19. This indicator was the highest - 74 in 2006, and the lowest 0 in 2002. The trend for injuries per 1,000 incidents is rising. Compared to the state value the number of casualties per 1,000 fire incidents is higher.Casualties per 1,000 incidents in East Bridgewater, MA compared to nearest cities:
(Note: Based on data for all years, including only cities with at least 500 fire incidents)
| East Bridgewater: | 17.7 |
| Bridgewater: | 7.5 |
| Whitman: | 24.0 |
| West Bridgewater: | 10.4 |
| Hanson: | 4.0 |
| Brockton: | 35.0 |
| Abington: | 15.5 |
| Rockland: | 37.3 |
| Hanover: | 12.0 |
 31.2% incidents where reported in the morning and 68.8% in the evening. The most fires (17.2%) took place on Saturday, and the least (12.2%) on Thursday.
 According to the 959 reports from years 2002 - 2018 most fires (15.1%) took place during April, and the least (6.5%) in September.
 Out of all 14,871 cases reported during the years 2002 - 2018, the most belonged to the categories: Rescue & EMS (61.5%), Hazardous Condition (15.3%), and False Alarm (6.8%).
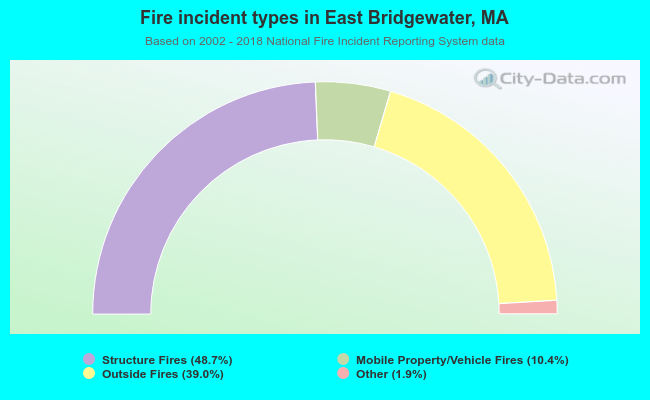 When looking into fire subcategories, the most incidents belonged to: Structure Fires (48.7%), and Outside Fires (39.0%).