Elizabethton: Fire Incidents, Tennessee (TN)
Where are fire incidents reported in Elizabethton, TN
Something went wrong! Please refresh the page.
| Fire incidents reported | |
|---|---|
| Sreet name | Count |
| HIGHWAY 91 | 176 |
| ELK AVE | 130 |
| BRISTOL HWY | 78 |
| BROAD ST | 78 |
| 91 HWY | 76 |
| SIAM RD | 62 |
| GAP CREEK RD | 60 |
| 19E HWY | 58 |
| BLUE SPRINGS RD | 58 |
| G ST | 58 |
| BLUEFIELD AVE | 54 |
| LANDFILL RD | 54 |
| JACKSON AVE | 52 |
| WILLOW SPRINGS RD | 52 |
| HWY 91 | 48 |
| GARRISON HOLLOW RD | 46 |
| DRY BRANCH RD | 42 |
| CHAMBERS DR | 38 |
| BOB LITTLE RD | 34 |
| GRACE LEWIS RD | 32 |
| LACY HOLLOW RD | 32 |
| LONG HOLLOW RD | 32 |
| LOVERS LN | 30 |
| MILLIGAN HWY | 30 |
| SYCAMORE SHOALS DR | 30 |
| COAL CHUTE RD | 28 |
| LITTLE STONEY CREEK RD | 28 |
| PRICE RD | 28 |
| ROOSEVELT AVE | 28 |
| SYCAMORE ST | 28 |
| Other | 1,154 |
2002 - 2018 National Fire Incident Reporting System (NFIRS) incidents
- Incident types reported to NFIRS in Elizabethton, TN
- 2,73435.6%Fire
- 1,93525.2%Hazardous Condition
- 1,03013.4%Good Intent Call
- 94112.2%Rescue & EMS
- 5597.3%False Alarm
- 4365.7%Service Call
- 210.3%Special Incident
- 170.2%Severe Weather
- 130.2%Overpressure Rupture
- Fire incident types reported to NFIRS in Elizabethton, TN
- 1,43052.3%Structure Fires
- 89032.6%Outside Fires
- 37413.7%Mobile Property/Vehicle Fires
- 401.5%Other
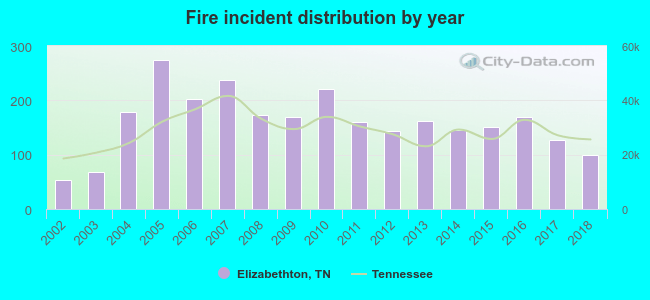 According to the data from the years 2002 - 2018 the average number of fire incidents per year is 161. The highest number of reported fires - 274 took place in 2005, and the least - 54 in 2002. The data has an increasing trend.
The average number of yearly fire incidents per 10k residents in Elizabethton, TN compared to nearest cities:
(Note: Based on data for the last 3 years, including only cities with population 5,000 and above)
| Elizabethton: | 92.5 |
| Johnson City: | 41.4 |
| Jonesborough: | 178.8 |
| Bristol: | 54.5 |
| Erwin: | 5.0 |
| Colonial Heights: | 2.2 |
| Telford: | 10.5 |
| Kingsport: | 67.3 |
| Bloomingdale: | 1.0 |
 The median response time based on all reported fire incidents is 8 minutes. This is higher compared to the state median value.
The median response time in Elizabethton, TN compared to nearest cities:
(Note: Based on data for all years, including only cities with at least 500 fire incidents)
| Elizabethton: | 8 minutes |
| Johnson City: | 4 minutes |
| Bluff City: | 8 minutes |
| Jonesborough: | 9 minutes |
| Gray: | 10 minutes |
| Blountville: | 11 minutes |
| Bristol: | 6 minutes |
| Kingsport: | 7 minutes |
| Newland: | 8 minutes |
 Based on the reports from the years 2002 - 2018 the average number of fire-related yearly deaths is 0. The highest number of deaths - 2 took place in 2010, and the lowest - 0 in 2002. The data has a constant trend.
The average number of deaths per 1,000 fires is 2. This indicator was the highest - 12 in 2016, and the lowest 0 in 2002. The trend for deaths per 1,000 fires is constant. Compared to the Tennessee value the number of deaths per 1,000 fire incidents is lower.
Based on the reports from the years 2002 - 2018 the average number of fire-related yearly deaths is 0. The highest number of deaths - 2 took place in 2010, and the lowest - 0 in 2002. The data has a constant trend.
The average number of deaths per 1,000 fires is 2. This indicator was the highest - 12 in 2016, and the lowest 0 in 2002. The trend for deaths per 1,000 fires is constant. Compared to the Tennessee value the number of deaths per 1,000 fire incidents is lower.Deaths per 1,000 incidents in Elizabethton, TN compared to nearest cities:
(Note: Based on data for all years, including only cities with at least 2,500 fire incidents)
| Elizabethton: | 2.2 |
| Johnson City: | 4.7 |
| Kingsport: | 3.4 |
| Greeneville: | 3.6 |
 According to the reports from the years 2002 - 2018 the average number of fire-related casualties per year is 2. The highest number of injuries - 6 took place in 2010, and the lowest - 0 in 2002. The data has a growing trend.
The average number of casualties per 1,000 fires is 14. This indicator was the highest - 29 in 2003, and the lowest 0 in 2002. The trend for casualties per 1,000 fires is increasing. Compared to the state value the number of casualties per 1,000 fire incidents is higher.
According to the reports from the years 2002 - 2018 the average number of fire-related casualties per year is 2. The highest number of injuries - 6 took place in 2010, and the lowest - 0 in 2002. The data has a growing trend.
The average number of casualties per 1,000 fires is 14. This indicator was the highest - 29 in 2003, and the lowest 0 in 2002. The trend for casualties per 1,000 fires is increasing. Compared to the state value the number of casualties per 1,000 fire incidents is higher.Casualties per 1,000 incidents in Elizabethton, TN compared to nearest cities:
(Note: Based on data for all years, including only cities with at least 500 fire incidents)
| Elizabethton: | 14.3 |
| Johnson City: | 19.1 |
| Bluff City: | 6.0 |
| Jonesborough: | 2.9 |
| Gray: | 1.6 |
| Blountville: | 4.1 |
| Bristol: | 6.9 |
| Kingsport: | 13.7 |
| Newland: | 0.0 |
 32.8% incidents where reported in the morning and 67.2% in the evening. The most fires (16.3%) took place on Monday, and the least (13.5%) on Thursday.
 Based on the 2,734 incident reports from years 2002 - 2018 most fires (11.9%) took place during March, and the least (6.6%) in June.
 Out of all 7,686 cases reported during the years 2002 - 2018, the most belonged to the categories: Fire (35.6%), Hazardous Condition (25.2%), and Good Intent Call (13.4%).
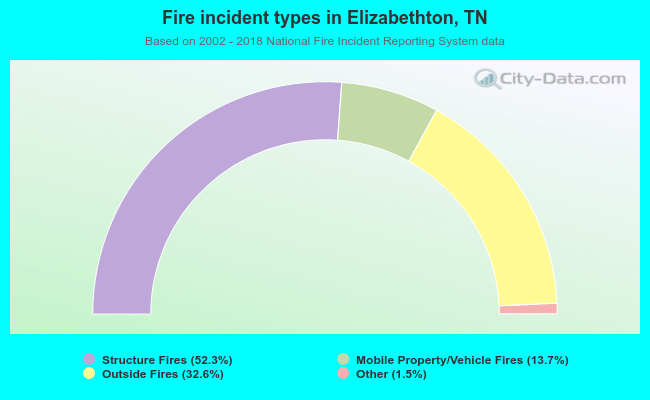 When looking into fire subcategories, the most incidents belonged to: Structure Fires (52.3%), and Outside Fires (32.6%).