Holden: Fire Incidents, Massachusetts (MA)
Where are fire incidents reported in Holden, MA
Something went wrong! Please refresh the page.
| Fire incidents reported | |
|---|---|
| Sreet name | Count |
| MAIN STREET | 118 |
| MAIN ST | 84 |
| INDUSTRIAL DRIVE | 40 |
| RESERVOIR STREET | 40 |
| WACHUSETT STREET | 34 |
| SHREWSBURY STREET | 32 |
| RESERVOIR ST | 28 |
| SHREWSBURY ST | 24 |
| SALISBURY STREET | 22 |
| WACHUSETT ST | 22 |
| CHAPEL ST | 20 |
| SALISBURY ST | 20 |
| BULLARD STREET | 18 |
| MALDEN ST | 18 |
| BAILEY RD | 16 |
| FLAGLER DRIVE | 16 |
| CHAPEL STREET | 14 |
| PRINCETON STREET | 14 |
| BAILEY ROAD | 12 |
| FISHER RD | 12 |
| HOLDEN STREET | 12 |
| SYCAMORE DR | 12 |
| BOYDEN RD | 10 |
| BULLARD ST | 10 |
| CAUSEWAY STREET | 10 |
| CHAPIN RD | 10 |
| GLENWOOD STREET | 10 |
| HIGHLAND ST | 10 |
| HIGHLAND STREET | 10 |
| MALDEN STREET | 10 |
| Other | 89 |
2002 - 2018 National Fire Incident Reporting System (NFIRS) incidents
- Incident types reported to NFIRS in Holden, MA
- 6,09059.7%Rescue & EMS
- 1,02310.0%Hazardous Condition
- 1,0029.8%False Alarm
- 7977.8%Fire
- 7447.3%Service Call
- 5024.9%Good Intent Call
- 170.2%Severe Weather
- 120.1%Special Incident
- Fire incident types reported to NFIRS in Holden, MA
- 42353.1%Structure Fires
- 24630.9%Outside Fires
- 8110.2%Mobile Property/Vehicle Fires
- 475.9%Other
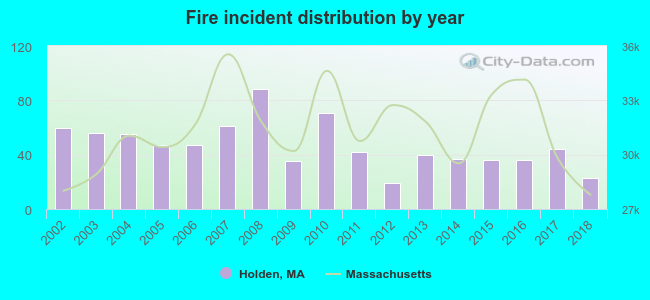 Based on the data from the years 2002 - 2018 the average number of fire incidents per year is 47. The highest number of reported fire incidents - 88 took place in 2008, and the least - 19 in 2012. The data has a declining trend.
The average number of yearly fire incidents per 10k residents in Holden, MA compared to nearest cities:
(Note: Based on data for the last 3 years, including only cities with population 5,000 and above)
| Holden: | 19.8 |
| West Boylston: | 39.6 |
| Worcester: | 74.5 |
| Sterling: | 32.0 |
| Shrewsbury: | 35.5 |
| Leicester: | 33.7 |
| Clinton: | 88.9 |
| Auburn: | 39.3 |
| Spencer: | 109.9 |
 The median response time based on all reported fire incidents is 6 minutes. This is higher than the state median value.
The median response time in Holden, MA compared to nearest cities:
(Note: Based on data for all years, including only cities with at least 500 fire incidents)
| Holden: | 6 minutes |
| Worcester: | 4 minutes |
| Sterling: | 6 minutes |
| Shrewsbury: | 4 minutes |
| Leicester: | 5 minutes |
| Clinton: | 3 minutes |
| Auburn: | 4 minutes |
| Spencer: | 7 minutes |
| Northborough: | 6 minutes |
 According to the reports from the years 2002 - 2018 the average number of fire-related yearly deaths is 0. The highest number of deaths - 2 took place in 2005, and the lowest - 0 in 2002. The data has a constant trend.
 Based on the data from the years 2002 - 2018 the average number of fire-related casualties per year is 1. The highest number of injuries - 3 took place in 2007, and the lowest - 0 in 2002. The data has a constant trend.
The average number of casualties per 1,000 fire incidents is 15. This indicator was the highest - 57 in 2009, and the lowest 0 in 2002. The trend for casualties per 1,000 incidents is constant. Compared to the state value the number of casualties per 1,000 fire incidents is higher.
Based on the data from the years 2002 - 2018 the average number of fire-related casualties per year is 1. The highest number of injuries - 3 took place in 2007, and the lowest - 0 in 2002. The data has a constant trend.
The average number of casualties per 1,000 fire incidents is 15. This indicator was the highest - 57 in 2009, and the lowest 0 in 2002. The trend for casualties per 1,000 incidents is constant. Compared to the state value the number of casualties per 1,000 fire incidents is higher.Casualties per 1,000 incidents in Holden, MA compared to nearest cities:
(Note: Based on data for all years, including only cities with at least 500 fire incidents)
| Holden: | 15.1 |
| Worcester: | 2.6 |
| Sterling: | 7.7 |
| Shrewsbury: | 3.4 |
| Leicester: | 11.9 |
| Clinton: | 5.5 |
| Auburn: | 2.5 |
| Spencer: | 18.1 |
| Northborough: | 18.2 |
 30.7% incidents where reported in the morning and 69.3% in the evening. The most fires (16.4%) took place on Tuesday, and the least (11.3%) on Thursday.
 Based on the 797 incident reports from years 2002 - 2018 most fires (12.8%) took place during April, and the least (5.3%) in September.
 Out of all 10,197 cases reported during the years 2002 - 2018, the most belonged to the categories: Rescue & EMS (59.7%), Hazardous Condition (10.0%), and False Alarm (9.8%).
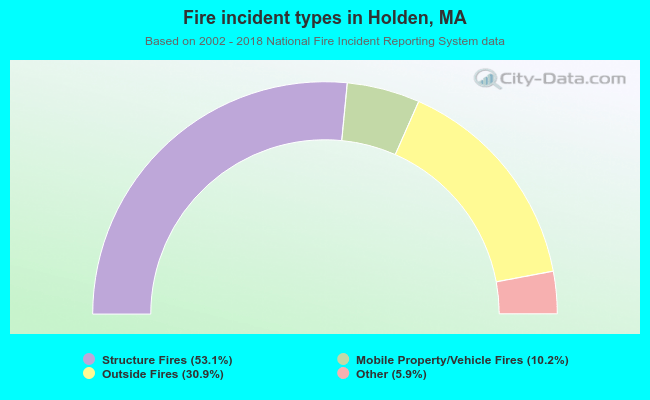 When looking into fire subcategories, the most incidents belonged to: Structure Fires (53.1%), and Outside Fires (30.9%).