Independence: Fire Incidents, Oregon (OR)
Where are fire incidents reported in Independence, OR
Something went wrong! Please refresh the page.
|
| |||||||||||||||||||||||||||||||||||||||||||||||||||||||||||||||||||||||||||||||||||||||||||||||||||||||||||||
2002 - 2018 National Fire Incident Reporting System (NFIRS) incidents
- Incident types reported to NFIRS in Independence, OR
- 2,10766.3%Rescue & EMS
- 3089.7%Fire
- 3019.5%Service Call
- 1946.1%Good Intent Call
- 1705.4%Hazardous Condition
- 892.8%False Alarm
- 60.2%Special Incident
- Fire incident types reported to NFIRS in Independence, OR
- 13343.2%Structure Fires
- 12540.6%Outside Fires
- 4414.3%Mobile Property/Vehicle Fires
- 61.9%Other
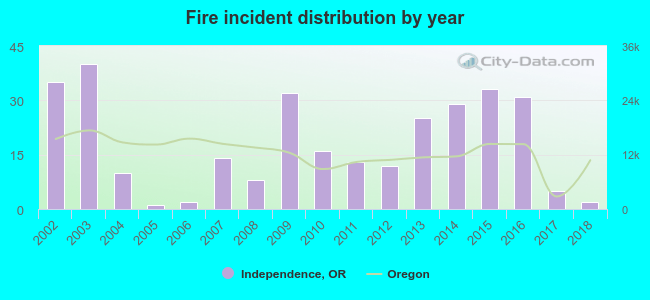 According to the data from the years 2002 - 2018 the average number of fires per year is 18. The highest number of reported fire incidents - 40 took place in 2003, and the least - 1 in 2005. The data has a dropping trend.
The average number of yearly fire incidents per 10k residents in Independence, OR compared to nearest cities:
(Note: Based on data for the last 3 years, including only cities with population 5,000 and above)
| Independence: | 14.4 |
| Monmouth: | 14.7 |
| Dallas: | 26.9 |
| Salem: | 25.0 |
| Four Corners: | 1.9 |
| Keizer: | 8.4 |
| Albany: | 12.8 |
| Sheridan: | 39.0 |
| Stayton: | 34.4 |

 32.1% incidents where reported in the morning and 67.9% in the evening. The most fires (18.8%) took place on Thursday, and the least (9.7%) on Sunday.
 Based on the 308 fires from years 2002 - 2018 most fires (19.2%) took place during July, and the least (4.5%) in November.
 Out of all 3,176 cases reported during the years 2002 - 2018, the most belonged to the categories: Rescue & EMS (66.3%), Fire (9.7%), and Service Call (9.5%).
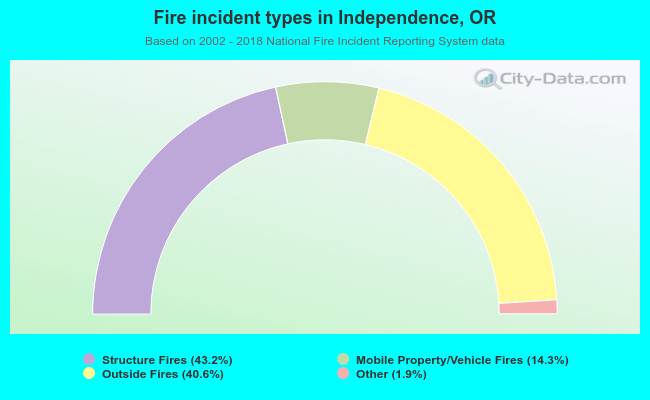 When looking into fire subcategories, the most reports belonged to: Structure Fires (43.2%), and Outside Fires (40.6%).