Lancaster: Fire Incidents, Massachusetts (MA)
Where are fire incidents reported in Lancaster, MA
Something went wrong! Please refresh the page.
|
| |||||||||||||||||||||||||||||||||||||||||||||||||||||||||||||||||||||||||||||||||||||||||||||||||||||||||||||
2002 - 2018 National Fire Incident Reporting System (NFIRS) incidents
- Incident types reported to NFIRS in Lancaster, MA
- 1,66655.2%Rescue & EMS
- 39413.1%Fire
- 2598.6%False Alarm
- 2387.9%Hazardous Condition
- 2076.9%Service Call
- 2066.8%Good Intent Call
- 451.5%Special Incident
- Fire incident types reported to NFIRS in Lancaster, MA
- 18145.9%Structure Fires
- 12331.2%Outside Fires
- 6717.0%Mobile Property/Vehicle Fires
- 235.8%Other
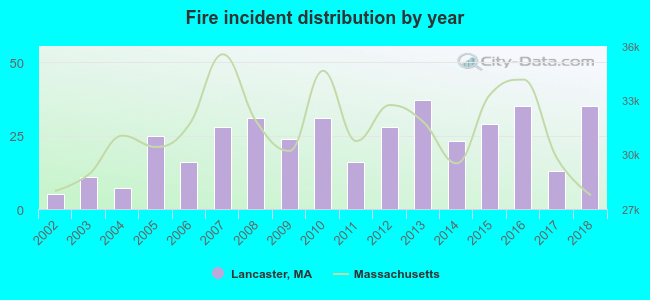 According to the data from the years 2002 - 2018 the average number of fire incidents per year is 23. The highest number of reported fires - 37 took place in 2013, and the least - 5 in 2002. The data has an increasing trend.
The average number of yearly fire incidents per 10k residents in Lancaster, MA compared to nearest cities:
(Note: Based on data for the last 3 years, including only cities with population 5,000 and above)
| Lancaster: | 34.3 |
| Clinton: | 88.9 |
| Harvard: | 36.3 |
| Leominster: | 62.0 |
| Sterling: | 32.0 |
| Hudson: | 44.1 |
| Stow: | 22.8 |
| West Boylston: | 39.6 |
| Fitchburg: | 120.3 |

 29.4% incidents where reported in the morning and 70.6% in the evening. The most fires (20.6%) took place on Saturday, and the least (10.7%) on Wednesday.
 Based on the 394 fire incidents from years 2002 - 2018 most fires (14.2%) took place during April, and the least (4.6%) in August.
 Out of all 3,016 cases reported during the years 2002 - 2018, the most belonged to the categories: Rescue & EMS (55.2%), Fire (13.1%), and False Alarm (8.6%).
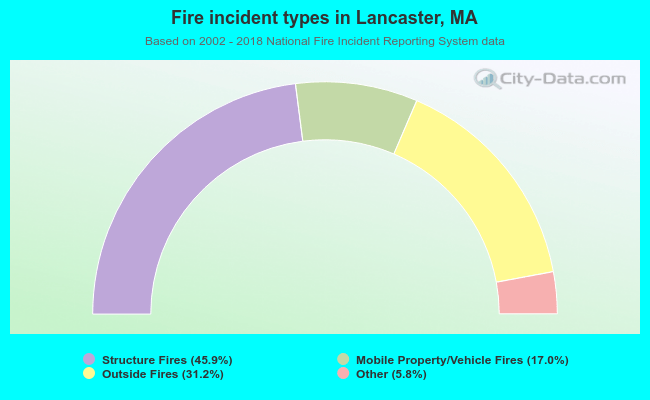 When looking into fire subcategories, the most reports belonged to: Structure Fires (45.9%), and Outside Fires (31.2%).