Nolensville: Fire Incidents, Tennessee (TN)
Where are fire incidents reported in Nolensville, TN
Something went wrong! Please refresh the page.
|
| |||||||||||||||||||||||||||||||||||||||||||||||||||||||||||||||||||||||||||||||||||||||||||||||||||||||||||||
2002 - 2018 National Fire Incident Reporting System (NFIRS) incidents
- Incident types reported to NFIRS in Nolensville, TN
- 83647.8%Rescue & EMS
- 29416.8%Fire
- 22112.6%Good Intent Call
- 18210.4%False Alarm
- 1106.3%Service Call
- 1035.9%Hazardous Condition
- 20.1%Special Incident
- Fire incident types reported to NFIRS in Nolensville, TN
- 13746.6%Outside Fires
- 11639.5%Structure Fires
- 3311.2%Mobile Property/Vehicle Fires
- 82.7%Other
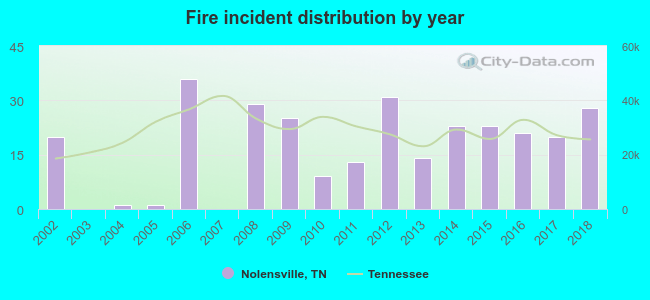 Based on the data from the years 2002 - 2018 the average number of fires per year is 17. The highest number of reported fires - 36 took place in 2006, and the least - 0 in 2003. The data has an increasing trend.
The average number of yearly fire incidents per 10k residents in Nolensville, TN compared to nearest cities:
(Note: Based on data for the last 3 years, including only cities with population 5,000 and above)
| Nolensville: | 35.8 |
| La Vergne: | 1.8 |
| Brentwood: | 22.5 |
| Smyrna: | 37.8 |
| Franklin: | 30.3 |
| Murfreesboro: | 42.6 |
| Lascassas: | 23.1 |
| Mount Juliet: | 23.0 |
| Spring Hill: | 17.9 |

 38.1% incidents where reported in the morning and 61.9% in the evening. The most fires (17.3%) took place on Thursday, and the least (10.9%) on Tuesday.
 According to the 294 fires from years 2002 - 2018 most fires (16.0%) took place during January, and the least (4.1%) in October.
 Out of all 1,749 cases reported during the years 2002 - 2018, the most belonged to the categories: Rescue & EMS (47.8%), Fire (16.8%), and Good Intent Call (12.6%).
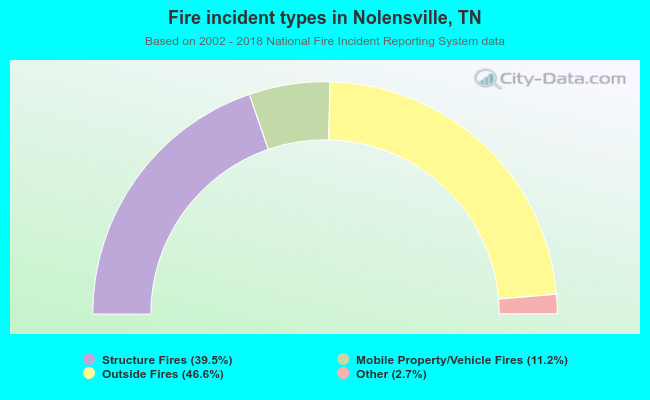 When looking into fire subcategories, the most reports belonged to: Outside Fires (46.6%), and Structure Fires (39.5%).