North Andover: Fire Incidents, Massachusetts (MA)
Where are fire incidents reported in North Andover, MA
Something went wrong! Please refresh the page.
| Fire incidents reported | |
|---|---|
| Sreet name | Count |
| ROYAL CREST DRIVE | 330 |
| TURNPIKE STREET | 236 |
| OSGOOD STREET | 222 |
| MAIN STREET | 136 |
| GREAT POND ROAD | 94 |
| WINTHROP AVENUE | 90 |
| CHICKERING ROAD | 66 |
| SUTTON STREET | 60 |
| WALKER ROAD | 58 |
| HOLT ROAD | 50 |
| SALEM STREET | 48 |
| HIGH STREET | 42 |
| ANDOVER STREET | 40 |
| WILLOW STREET | 38 |
| EDGELAWN AVENUE | 36 |
| FIRST STREET | 36 |
| MASSACHUSETTS AVENUE | 36 |
| TURNPIKE ST | 34 |
| FARRWOOD AVENUE | 32 |
| FERNVIEW AVENUE | 32 |
| OSGOOD ST | 30 |
| WAVERLEY ROAD | 30 |
| FOULDS TERRACE | 28 |
| JOHNSON STREET | 28 |
| MCCABE COURT | 28 |
| GREENE STREET | 26 |
| COMMERCE WAY | 22 |
| FOREST STREET | 22 |
| PLEASANT ST | 22 |
| BINGHAM WAY | 18 |
2002 - 2018 National Fire Incident Reporting System (NFIRS) incidents
- Incident types reported to NFIRS in North Andover, MA
- 12,77854.6%Rescue & EMS
- 2,83712.1%False Alarm
- 2,72611.6%Hazardous Condition
- 2,2509.6%Service Call
- 1,8517.9%Fire
- 7623.3%Good Intent Call
- 1680.7%Special Incident
- 240.1%Overpressure Rupture
- Fire incident types reported to NFIRS in North Andover, MA
- 1,14661.9%Structure Fires
- 42823.1%Outside Fires
- 1638.8%Mobile Property/Vehicle Fires
- 1146.2%Other
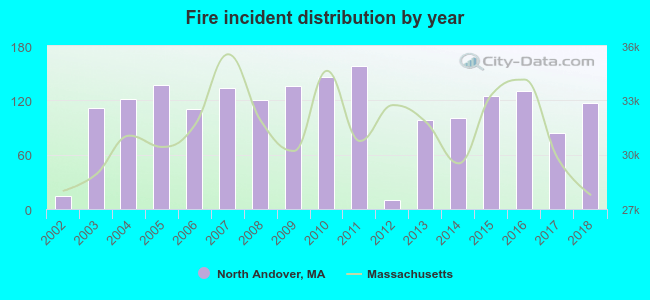 Based on the data from the years 2002 - 2018 the average number of fire incidents per year is 109. The highest number of reported fires - 158 took place in 2011, and the least - 10 in 2012. The data has a growing trend.
The average number of yearly fire incidents per 10k residents in North Andover, MA compared to nearest cities:
(Note: Based on data for the last 3 years, including only cities with population 5,000 and above)
| North Andover: | 38.9 |
| Andover: | 113.4 |
| Lawrence: | 26.0 |
| Methuen: | 26.7 |
| Groveland: | 32.5 |
| Haverhill: | 33.9 |
| North Reading: | 24.2 |
| Georgetown: | 55.4 |
| Middleton: | 34.9 |
 The median response time based on all reported fire incidents is 4 minutes. This is close to the state median value.
The median response time in North Andover, MA compared to nearest cities:
(Note: Based on data for all years, including only cities with at least 500 fire incidents)
| North Andover: | 4 minutes |
| Andover: | 6 minutes |
| Lawrence: | 3 minutes |
| Methuen: | 4 minutes |
| Boxford: | 8 minutes |
| Haverhill: | 4 minutes |
| North Reading: | 4 minutes |
| Georgetown: | 5 minutes |
| Middleton: | 4 minutes |
 Based on the data from the years 2002 - 2018 the average number of fire-related fatalities per year is 0. The highest number of deaths - 2 took place in 2005, and the lowest - 0 in 2002. The data has a constant trend.
 Based on the data from the years 2002 - 2018 the average number of fire-related yearly casualties is 1. The highest number of casualties - 4 took place in 2016, and the lowest - 0 in 2003. The data has a rising trend.
The average number of casualties per 1,000 fire incidents is 14. This indicator was the highest - 100 in 2012, and the lowest 0 in 2003. The trend for casualties per 1,000 fires is dropping. Compared to the state value the number of injuries per 1,000 fires is lower.
Based on the data from the years 2002 - 2018 the average number of fire-related yearly casualties is 1. The highest number of casualties - 4 took place in 2016, and the lowest - 0 in 2003. The data has a rising trend.
The average number of casualties per 1,000 fire incidents is 14. This indicator was the highest - 100 in 2012, and the lowest 0 in 2003. The trend for casualties per 1,000 fires is dropping. Compared to the state value the number of injuries per 1,000 fires is lower.Casualties per 1,000 incidents in North Andover, MA compared to nearest cities:
(Note: Based on data for all years, including only cities with at least 500 fire incidents)
| North Andover: | 5.9 |
| Andover: | 1.0 |
| Lawrence: | 9.8 |
| Methuen: | 5.0 |
| Boxford: | 5.3 |
| Haverhill: | 9.9 |
| North Reading: | 6.7 |
| Georgetown: | 11.3 |
| Middleton: | 8.6 |
 28.0% incidents where reported in the morning and 72.0% in the evening. The most fires (15.4%) took place on Thursday, and the least (13.2%) on Tuesday.
 According to the 1,851 reports from years 2002 - 2018 most fires (10.7%) took place during April, and the least (6.8%) in February.
 Out of all 23,417 cases reported during the years 2002 - 2018, the most belonged to the categories: Rescue & EMS (54.6%), False Alarm (12.1%), and Hazardous Condition (11.6%).
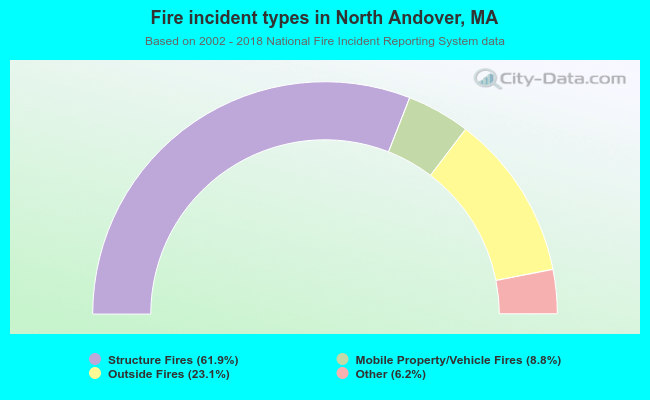 When looking into fire subcategories, the most reports belonged to: Structure Fires (61.9%), and Outside Fires (23.1%).