Ontario: Fire Incidents, Oregon (OR)
Where are fire incidents reported in Ontario, OR
Something went wrong! Please refresh the page.
| Fire incidents reported | |
|---|---|
| Sreet name | Count |
| OREGON ST | 128 |
| IDAHO AVE | 116 |
| 1ST ST | 110 |
| 4TH AVE | 110 |
| 2ND ST | 108 |
| 3RD ST | 70 |
| 6TH AVE | 58 |
| FOOTHILL DR | 54 |
| 6TH ST | 48 |
| 9TH ST | 48 |
| TH AVE | 48 |
| 4TH ST | 46 |
| 9TH AVE | 46 |
| HWY 201 | 44 |
| 5TH AVE | 36 |
| ALAMEDA DR | 36 |
| HYLINE RD | 34 |
| ISLAND RD | 34 |
| 11TH AVE | 30 |
| 1ST AVE | 30 |
| 2ND AVE | 30 |
| MORGAN AVE | 30 |
| 5TH ST | 28 |
| 7TH AVE | 28 |
| 7TH ST | 28 |
| ONION AVE | 28 |
| STANTON BLVD | 28 |
| SUNSET DR | 28 |
| 11TH ST | 26 |
| RIVER ST | 26 |
2002 - 2018 National Fire Incident Reporting System (NFIRS) incidents
- Incident types reported to NFIRS in Ontario, OR
- 1,49163.3%Fire
- 24410.4%Hazardous Condition
- 2078.8%Good Intent Call
- 1958.3%False Alarm
- 1647.0%Service Call
- 371.6%Rescue & EMS
- 130.6%Special Incident
- 40.2%Overpressure Rupture
- Fire incident types reported to NFIRS in Ontario, OR
- 78852.9%Outside Fires
- 38125.6%Structure Fires
- 22014.8%Mobile Property/Vehicle Fires
- 1026.8%Other
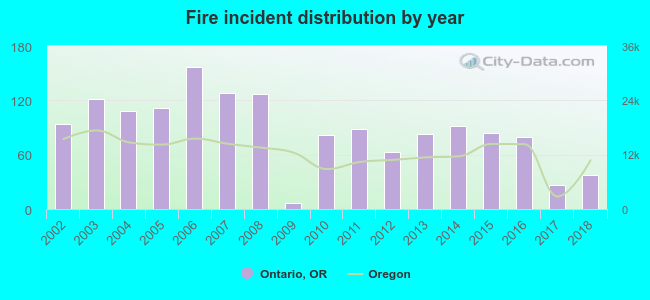 According to the data from the years 2002 - 2018 the average number of fires per year is 88. The highest number of reported fire incidents - 157 took place in 2006, and the least - 7 in 2009. The data has a dropping trend.
The average number of yearly fire incidents per 10k residents in Ontario, OR compared to nearest cities:
(Note: Based on data for the last 3 years, including only cities with population 5,000 and above)
| Ontario: | 43.7 |
| Baker City: | 54.1 |
 The median response time based on all reported fire incidents is 6 minutes. This is about the same as the Oregon median value.
The median response time in Ontario, OR compared to nearest cities:
(Note: Based on data for all years, including only cities with at least 500 fire incidents)
| Ontario: | 6 minutes |
| Payette: | 4 minutes |
| New Plymouth: | 10 minutes |
| Nyssa: | 9 minutes |
| Weiser: | 7 minutes |
| Parma: | 17 minutes |
| Wilder: | 8 minutes |
| Emmett: | 7 minutes |
| Middleton: | 10 minutes |
 According to the data from the years 2002 - 2018 the average number of fire-related casualties per year is 0. The highest number of reported injuries - 3 took place in 2014, and the lowest - 0 in 2002. The data has a constant trend.
The average number of casualties per 1,000 fire incidents is 4. This indicator was the highest - 33 in 2014, and the lowest 0 in 2002. The trend for casualties per 1,000 fires is constant. Compared to the state value the number of injuries per 1,000 fires is much lower.
According to the data from the years 2002 - 2018 the average number of fire-related casualties per year is 0. The highest number of reported injuries - 3 took place in 2014, and the lowest - 0 in 2002. The data has a constant trend.
The average number of casualties per 1,000 fire incidents is 4. This indicator was the highest - 33 in 2014, and the lowest 0 in 2002. The trend for casualties per 1,000 fires is constant. Compared to the state value the number of injuries per 1,000 fires is much lower.
 30.0% incidents where reported in the morning and 70.0% in the evening. The most fires (16.0%) took place on Thursday, and the least (12.5%) on Sunday.
 According to the 1,491 fire incidents from years 2002 - 2018 most fires (19.3%) took place during July, and the least (4.1%) in January.
 Out of all 2,356 cases reported during the years 2002 - 2018, the most belonged to the categories: Fire (63.3%), Hazardous Condition (10.4%), and Good Intent Call (8.8%).
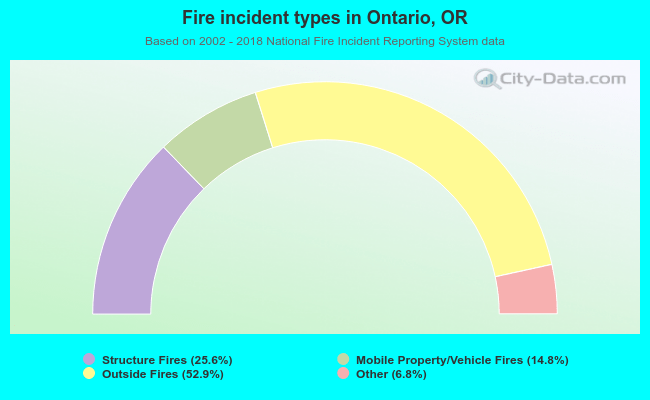 When looking into fire subcategories, the most reports belonged to: Outside Fires (52.9%), and Structure Fires (25.6%).