Somerville: Fire Incidents, Massachusetts (MA)
Where are fire incidents reported in Somerville, MA
Something went wrong! Please refresh the page.
| Fire incidents reported | |
|---|---|
| Sreet name | Count |
| BROADWAY ST | 346 |
| HIGHLAND AV ST | 198 |
| WASHINGTON ST ST | 100 |
| BROADWAY | 98 |
| MEMORIAL RD ST | 92 |
| SOMERVILLE AV ST | 90 |
| ALEWIFE BROOK PKWY ST | 88 |
| MYSTIC AV ST | 86 |
| JAQUES ST ST | 74 |
| ELM ST ST | 68 |
| MEDFORD ST ST | 68 |
| BEACON ST ST | 62 |
| COLLEGE AV ST | 62 |
| POWDER HOUSE BLVD ST | 58 |
| HIGHLAND AVE | 56 |
| MIDDLESEX AV ST | 54 |
| SOMERVILLE AVE | 50 |
| LOWER CAMPUS RD ST | 48 |
| MCGRATH HWY ST | 48 |
| SUMMER ST ST | 48 |
| WASHINGTON ST | 44 |
| HOLLAND ST ST | 42 |
| PEARL ST ST | 38 |
| TEMPLE ST ST | 36 |
| MUTUAL AID CAMBRIDGE ST | 34 |
| GRAND UNION BLVD ST | 32 |
| LOWELL ST ST | 32 |
| MYSTIC AVE | 32 |
| PROFESSORS ROW ST | 32 |
| BEACON ST | 30 |
| Other | 546 |
2002 - 2018 National Fire Incident Reporting System (NFIRS) incidents
- Incident types reported to NFIRS in Somerville, MA
- 25,70045.8%Rescue & EMS
- 9,57117.0%False Alarm
- 8,87615.8%Service Call
- 4,6268.2%Hazardous Condition
- 2,9515.3%Good Intent Call
- 2,6924.8%Fire
- 1,6893.0%Special Incident
- Fire incident types reported to NFIRS in Somerville, MA
- 1,88670.1%Structure Fires
- 40715.1%Outside Fires
- 37814.0%Mobile Property/Vehicle Fires
- 210.8%Other
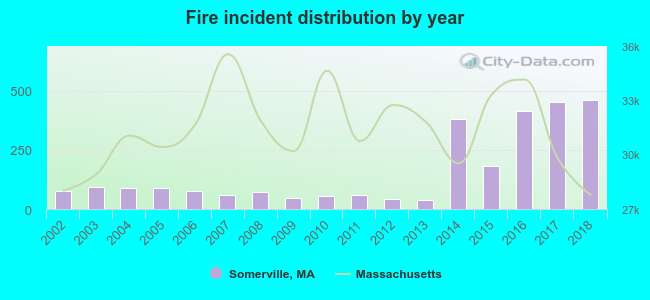 According to the data from the years 2002 - 2018 the average number of fires per year is 158. The highest number of reported fires - 460 took place in 2018, and the least - 37 in 2013. The data has a rising trend.
The average number of yearly fire incidents per 10k residents in Somerville, MA compared to nearest cities:
(Note: Based on data for the last 3 years, including only cities with population 5,000 and above)
| Somerville: | 56.2 |
| Cambridge: | 99.2 |
| Medford: | 41.3 |
| Everett: | 27.9 |
| Malden: | 22.3 |
| Chelsea: | 76.9 |
| Belmont: | 42.3 |
| Arlington: | 23.8 |
| Watertown: | 12.2 |
 The median response time based on all reported fire incidents is 3 minutes. This is lower compared to the state median value.
The median response time in Somerville, MA compared to nearest cities:
(Note: Based on data for all years, including only cities with at least 500 fire incidents)
| Somerville: | 3 minutes |
| Cambridge: | 5 minutes |
| Medford: | 3 minutes |
| Everett: | 2 minutes |
| Malden: | 3 minutes |
| Chelsea: | 3 minutes |
| Belmont: | 4 minutes |
| Arlington: | 3 minutes |
| Watertown: | 4 minutes |
 According to the data from the years 2002 - 2018 the average number of fire-related fatalities per year is 0. The highest number of deaths - 3 took place in 2011, and the lowest - 0 in 2005. The data has a declining trend.
The average number of fatalities per 1,000 fires is 7. This indicator was the highest - 51 in 2011, and the lowest 0 in 2005. The trend for fatalities per 1,000 fires is dropping. Compared to the Massachusetts value the number of deaths per 1,000 incidents is higher.
According to the data from the years 2002 - 2018 the average number of fire-related fatalities per year is 0. The highest number of deaths - 3 took place in 2011, and the lowest - 0 in 2005. The data has a declining trend.
The average number of fatalities per 1,000 fires is 7. This indicator was the highest - 51 in 2011, and the lowest 0 in 2005. The trend for fatalities per 1,000 fires is dropping. Compared to the Massachusetts value the number of deaths per 1,000 incidents is higher.
 Based on the data from the years 2002 - 2018 the average number of fire-related yearly casualties is 3. The highest number of injuries - 7 took place in 2016, and the lowest - 0 in 2012. The data has an increasing trend.
The average number of casualties per 1,000 fire incidents is 28. This indicator was the highest - 91 in 2010, and the lowest 0 in 2012. The trend for injuries per 1,000 incidents is declining. Compared to the Massachusetts value the number of injuries per 1,000 fires is higher.
Based on the data from the years 2002 - 2018 the average number of fire-related yearly casualties is 3. The highest number of injuries - 7 took place in 2016, and the lowest - 0 in 2012. The data has an increasing trend.
The average number of casualties per 1,000 fire incidents is 28. This indicator was the highest - 91 in 2010, and the lowest 0 in 2012. The trend for injuries per 1,000 incidents is declining. Compared to the Massachusetts value the number of injuries per 1,000 fires is higher.
 34.4% incidents where reported in the morning and 65.6% in the evening. The most fires (17.0%) took place on Saturday, and the least (12.1%) on Wednesday.
 According to the 2,692 incident reports from years 2002 - 2018 most fires (10.8%) took place during May, and the least (6.5%) in December.
 Out of all 56,156 cases reported during the years 2002 - 2018, the most belonged to the categories: Rescue & EMS (45.8%), False Alarm (17.0%), and Service Call (15.8%).
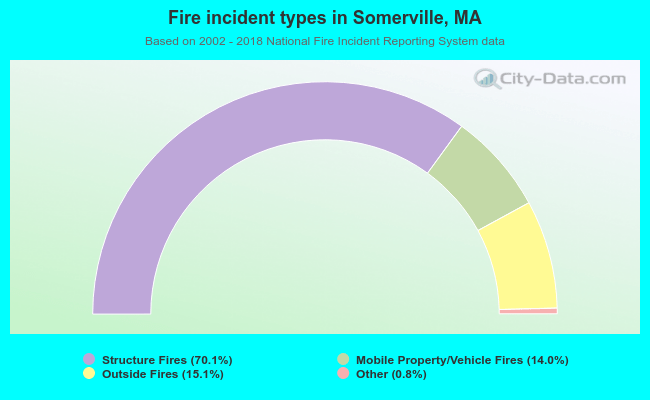 When looking into fire subcategories, the most reports belonged to: Structure Fires (70.1%), and Outside Fires (15.1%).