West Springfield: Fire Incidents, Massachusetts (MA)
Where are fire incidents reported in West Springfield, MA
Something went wrong! Please refresh the page.
| Fire incidents reported | |
|---|---|
| Sreet name | Count |
| RIVERDALE ST | 380 |
| WESTFIELD ST | 218 |
| MEMORIAL AVE | 176 |
| MAIN ST | 108 |
| UNION ST | 84 |
| ELM ST | 74 |
| PARK ST | 68 |
| RIVER ST | 66 |
| CRAIG DR | 52 |
| PIPER RD | 48 |
| MORGAN RD | 44 |
| KINGS HWY | 42 |
| HIGHLAND AVE | 40 |
| ASHLEY AVE | 36 |
| MORTON ST | 36 |
| VAN DEENE AVE | 32 |
| BORDER WAY | 30 |
| FRONT ST | 30 |
| GROVE ST | 28 |
| OXFORD PL | 28 |
| CIRCUIT AVE | 26 |
| NEW BRIDGE ST | 26 |
| AMOSTOWN RD | 24 |
| BIRNIE AVE | 22 |
| MERCURY CT | 22 |
| ROGERS AVE | 22 |
| BIRCH PARK CIR | 20 |
| PROSPECT AVE | 20 |
| DAY ST | 18 |
| HAMPDEN ST | 18 |
| Other | 89 |
2002 - 2018 National Fire Incident Reporting System (NFIRS) incidents
- Incident types reported to NFIRS in West Springfield, MA
- 29,28173.2%Rescue & EMS
- 2,5306.3%False Alarm
- 2,5016.3%Hazardous Condition
- 2,2565.6%Service Call
- 1,9274.8%Fire
- 1,3663.4%Good Intent Call
- 800.2%Special Incident
- Fire incident types reported to NFIRS in West Springfield, MA
- 90246.8%Structure Fires
- 57229.7%Outside Fires
- 33217.2%Mobile Property/Vehicle Fires
- 1216.3%Other
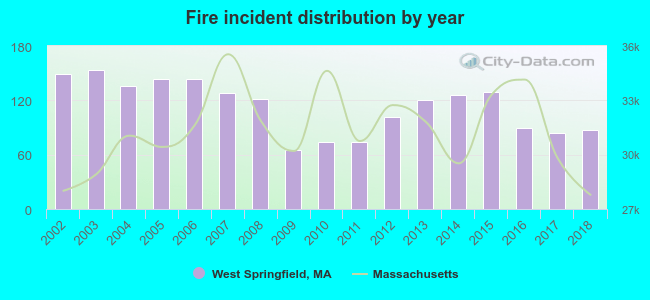 According to the data from the years 2002 - 2018 the average number of fire incidents per year is 113. The highest number of reported fire incidents - 153 took place in 2003, and the least - 65 in 2009. The data has a declining trend.
The average number of yearly fire incidents per 10k residents in West Springfield, MA compared to nearest cities:
(Note: Based on data for the last 3 years, including only cities with population 5,000 and above)
| West Springfield: | 30.4 |
| Agawam: | 26.7 |
| Chicopee: | 33.0 |
| Springfield: | 37.6 |
| Westfield: | 26.4 |
| Longmeadow: | 20.9 |
| Holyoke: | 90.1 |
| East Longmeadow: | 30.1 |
| Southwick: | 43.9 |
 The median response time based on all reported fire incidents is 3 minutes. This is lower compared to the Massachusetts median value.
The median response time in West Springfield, MA compared to nearest cities:
(Note: Based on data for all years, including only cities with at least 500 fire incidents)
| West Springfield: | 3 minutes |
| Agawam: | 4 minutes |
| Chicopee: | 4 minutes |
| Springfield: | 3 minutes |
| Westfield: | 5 minutes |
| Longmeadow: | 6 minutes |
| Holyoke: | 4 minutes |
| East Longmeadow: | 5 minutes |
| Southwick: | 9 minutes |
 Based on the reports from the years 2002 - 2018 the average number of fire-related fatalities per year is 0. The highest number of deaths - 2 took place in 2002, and the lowest - 0 in 2004. The data has a declining trend.
 Based on the reports from the years 2002 - 2018 the average number of fire-related casualties per year is 3. The highest number of casualties - 9 took place in 2002, and the lowest - 0 in 2004. The data has a decreasing trend.
The average number of casualties per 1,000 fires is 23. This indicator was the highest - 60 in 2002, and the lowest 0 in 2004. The trend for casualties per 1,000 fire incidents is decreasing. Compared to the state value the number of injuries per 1,000 fires is much higher.
Based on the reports from the years 2002 - 2018 the average number of fire-related casualties per year is 3. The highest number of casualties - 9 took place in 2002, and the lowest - 0 in 2004. The data has a decreasing trend.
The average number of casualties per 1,000 fires is 23. This indicator was the highest - 60 in 2002, and the lowest 0 in 2004. The trend for casualties per 1,000 fire incidents is decreasing. Compared to the state value the number of injuries per 1,000 fires is much higher.Casualties per 1,000 incidents in West Springfield, MA compared to nearest cities:
(Note: Based on data for all years, including only cities with at least 500 fire incidents)
| West Springfield: | 23.9 |
| Agawam: | 29.0 |
| Chicopee: | 30.2 |
| Springfield: | 12.5 |
| Westfield: | 16.9 |
| Longmeadow: | 12.1 |
| Holyoke: | 8.8 |
| East Longmeadow: | 23.8 |
| Southwick: | 9.3 |
 28.3% incidents where reported in the morning and 71.7% in the evening. The most fires (15.9%) took place on Saturday, and the least (13.5%) on Friday.
 According to the 1,927 incident reports from years 2002 - 2018 most fires (11.7%) took place during May, and the least (6.1%) in February.
 Out of all 39,976 cases reported during the years 2002 - 2018, the most belonged to the categories: Rescue & EMS (73.2%), False Alarm (6.3%), and Hazardous Condition (6.3%).
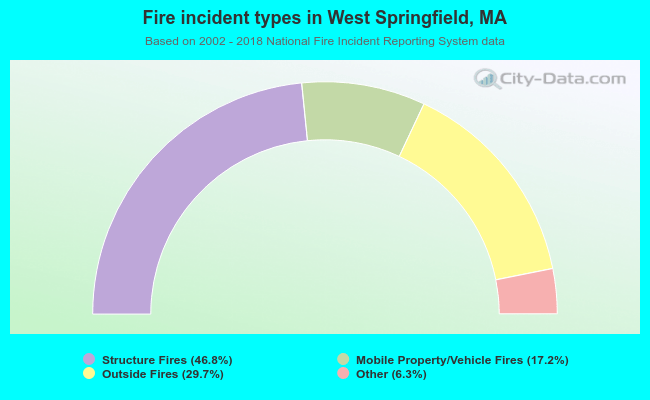 When looking into fire subcategories, the most reports belonged to: Structure Fires (46.8%), and Outside Fires (29.7%).