Jump to a detailed profile or search site with Google Custom Search

Blackstone, MA (Massachusetts) Houses and Residents

Estimated median house or condo value in 2022: $400,152 (it was $144,900 in 2000)
Blackstone:

$400,152
Massachusetts:

$534,700
Lower value quartile - upper value quartile: $328,930 - $509,129

Total population: 9,026 (Urban population: 8,119, Rural population: 685 (all nonfarm))

Houses: 3,331 (3,235 occupied: 2,261 owner occupied, 974 renter occupied)

% of renters here:

30%
State:

38%

Housing density: 305 houses/condos per square mile

Median price asked for vacant for-sale houses and condos in 2022 in this county: $182,682.

Median contract rent in 2022: $1,080 (lower quartile is $829, upper quartile is $1,458)


Median rent asked for vacant for-rent units in 2022: $1,159


Median gross rent in Blackstone, MA in 2022: $1,238

Housing units in Blackstone with a mortgage: 1,350 (143 second mortgage, 237 home equity loan, 7 both second mortgage and home equity loan)
Houses without a mortgage: 395

Compare current foreclosures near Blackstone, MA:

Check out more offers near Blackstone, MA.
Powered by Foreclosure.com


Latest news about housing in Blackstone, MA collected exclusively by city-data.com from local newspapers, TV, and radio stations

Blackstone, Massachusetts Age and Sex of Residents

Household type by relationship:

Households: 771,507
  • In family households: 644,137 (138,415 male householders, 64,187 female householders)
    151,406 spouses, 234,038 children (220,335 natural, 5,096 adopted, 8,607 stepchildren), 11,080 grandchildren, 6,742 brothers or sisters, 7,870 parents, foster children, 7,297 other relatives, 18,119 non-relatives
  • In nonfamily households: 127,370 (47,312 male householders (35,337 living alone)), 53,166 female householders (44,100 living alone)), 26,892 nonrelatives
  • In group quarters: 27,045 (11,315 institutionalized population)

135,695 married couples with children.
42,745 single-parent households (8,218 men, 34,527 women).

90.7% of residents of Blackstone speak English at home.
1.2% of residents speak Spanish at home (71% speak English very well, 29% speak English not well).
7.0% of residents speak other Indo-European language at home (71% speak English very well, 26% speak English well, 3% speak English not well).
1.2% of residents speak Asian or Pacific Island language at home (59% speak English very well, 34% speak English well, 7% speak English not well).

Foreign born population: 488 (4.8%)
(75.6% of them are naturalized citizens)

Median number of rooms in houses and condos:
Here:

6.4
State:

6.5

Median number of rooms in apartments
Here:

3.2
State:

4.0

Owner-occupied Renter-occupied
Bedrooms in owner-occupied houses and condos in Blackstone, Massachusetts
  • Bedrooms in owner-occupied houses and condos in Blackstone, Massachusetts
  • 0no bedroom
  • 401 bedroom
  • 4402 bedrooms
  • 1,1703 bedrooms
  • 5014 bedrooms
  • 1105+ bedrooms
Bedrooms in renter-occupied apartments in Blackstone, Massachusetts
  • Bedrooms in renter-occupied apartments in Blackstone, Massachusetts
  • 37no bedroom
  • 3571 bedroom
  • 3472 bedrooms
  • 2133 bedrooms
  • 204 bedrooms
  • 05+ bedrooms
Owner-occupied Renter-occupied
Cars and other vehicles available in Blackstone in owner-occupied houses/condos
  • Cars and other vehicles available in Blackstone in owner-occupied houses/condos
  • 108no vehicle
  • 4891 vehicle
  • 1,0312 vehicles
  • 3813 vehicles
  • 2004 vehicles
  • 525+ vehicles
Cars and other vehicles available in Blackstone in renter-occupied apartments
  • Cars and other vehicles available in Blackstone in renter-occupied apartments
  • 157no vehicle
  • 4661 vehicle
  • 2792 vehicles
  • 613 vehicles
  • 114 vehicles
  • 05+ vehicles
Owner-occupied Renter-occupied
Rooms in owner-occupied houses in Blackstone, Massachusetts
  • Rooms in owner-occupied houses in Blackstone, Massachusetts
  • 01 room
  • 02 rooms
  • 173 rooms
  • 1494 rooms
  • 3905 rooms
  • 6626 rooms
  • 4167 rooms
  • 3448 rooms
  • 2839+ rooms
Rooms in renter-occupied apartments in Blackstone, Massachusetts
  • Rooms in renter-occupied apartments in Blackstone, Massachusetts
  • 371 room
  • 472 rooms
  • 2853 rooms
  • 2884 rooms
  • 1605 rooms
  • 906 rooms
  • 197 rooms
  • 188 rooms
  • 309+ rooms
Year house built
Breakdown of mean house values by ages of householders
Owners and renters by unit type in Blackstone, MA
  • Blackstone, MA household income distribution

  • Distribution of median household income in Blackstone, MA in 2022
  • 19,119Less than $10,000
  • 27,279$10,000 to $19,999
  • 24,843$20,000 to $29,999
  • 23,123$30,000 to $39,999
  • 23,679$40,000 to $49,999
  • 22,672$50,000 to $59,999
  • 32,900$60,000 to $74,999
  • 47,852$75,000 to $99,999
  • 37,143$100,000 to $124,999
  • 31,739$125,000 to $149,999
  • 46,226$150,000 to $199,999
  • 52,986$200,000 or more

Percentage of workers working in this county: 34.7%
Number of people working at home: 904 (16.0% of all workers)

Travel time to work (commute)

  • Less than 5 minutes: 75
  • 5 to 9 minutes: 391
  • 10 to 14 minutes: 509
  • 15 to 19 minutes: 529
  • 20 to 24 minutes: 857
  • 25 to 29 minutes: 289
  • 30 to 34 minutes: 596
  • 35 to 39 minutes: 140
  • 40 to 44 minutes: 197
  • 45 to 59 minutes: 555
  • 60 to 89 minutes: 354
  • 90 or more minutes: 82

Means of transportation to work:

  • Drove a car alone: 3,996 (85.8%)
  • Carpooled: 433 (9.3%)
  • Railroad: 28 (0.6%)
  • Bicycle: 7 (0.2%)
  • Walked: 63 (1.4%)
  • Other means: 47 (1.0%)
  • Worked at home: 84 (1.8%)
Class of Workers in 2000
Year of entry for the foreign-born population in Blackstone, Massachusetts
  • Year of entry for the foreign-born population in Blackstone, Massachusetts
  • 61995 to March 2000
  • 171990 to 1994
  • 211985 to 1989
  • 571980 to 1984
  • 111975 to 1979
  • 241970 to 1974
  • 281965 to 1969
  • 76Before 1965
Ancestries in Blackstone, MA

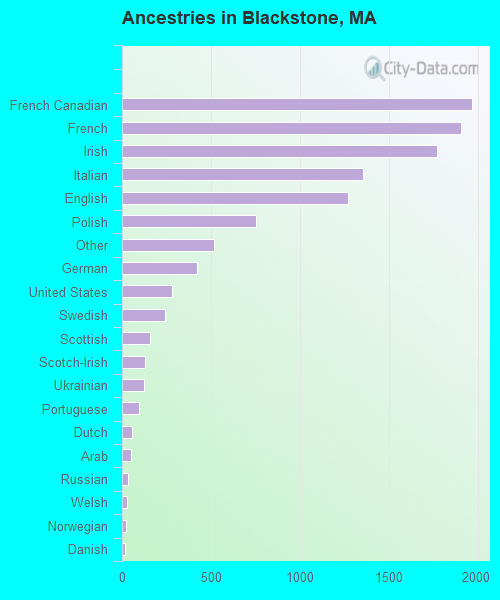
First ancestries reported:

  • French Canadian: 1,964 (17.5%)
  • French: 1,906 (17.0%)
  • Irish: 1,768 (15.8%)
  • Italian: 1,353 (12.1%)
  • English: 1,269 (11.3%)
  • Polish: 751 (6.7%)
  • Other: 516 (4.6%)
  • German: 420 (3.7%)
  • United States: 282 (2.5%)
  • Swedish: 243 (2.2%)
  • Scottish: 155 (1.4%)
  • Scotch-Irish: 128 (1.1%)
  • Ukrainian: 124 (1.1%)
  • Portuguese: 97 (0.9%)
  • Dutch: 59 (0.5%)
  • Arab: 48 (0.4%)
  • Russian: 34 (0.3%)
  • Welsh: 29 (0.3%)
  • Norwegian: 20 (0.2%)
  • Danish: 18 (0.2%)
  • Greek: 16 (0.1%)
  • Lithuanian: 13 (0.1%)
  • Slovak: 6 (0.05%)

Most common places of birth for foreign-born residents (%):

Canada
Blackstone:

27.1% (65)
Massachusetts:

5.2% (40,247)

Laos
Blackstone:

20.4% (49)
Massachusetts:

0.4% (3,048)

United Kingdom
Blackstone:

17.1% (41)
Massachusetts:

3.3% (25,403)

Vietnam
Blackstone:

11.2% (27)
Massachusetts:

3.9% (30,457)

Korea
Blackstone:

4.6% (11)
Massachusetts:

1.7% (13,456)

Cuba
Blackstone:

4.6% (11)
Massachusetts:

0.5% (3,868)

Czechoslovakia (includes Czech Republic and Slovakia)
Blackstone:

2.9% (7)
Massachusetts:

0.3% (1,943)

Ukraine
Blackstone:

2.9% (7)
Massachusetts:

1.1% (8,754)

Germany
Blackstone:

2.5% (6)
Massachusetts:

1.9% (14,883)

India
Blackstone:

2.5% (6)
Massachusetts:

3.6% (28,086)

Brazil
Blackstone:

2.5% (6)
Massachusetts:

4.7% (36,669)

Colombia
Blackstone:

1.7% (4)
Massachusetts:

2.0% (15,286)

Place of birth for U.S.-born residents:

  • This state: 3,596
  • Other state: 4,896
  • Northeast: 4,439
  • Midwest: 199
  • South: 145
  • West: 113

70% of Blackstone residents lived in the same house 5 years ago.
   Out of people who lived in different houses, 45% lived in this county.
   Out of people who lived in different counties, 49% lived in Massachusetts.

Education attainment for males 25 years and older:

  • No schooling: 25
  • Nursery to 4th grade: 0
  • 5th and 6th grade: 25
  • 7th and 8th grade: 128
  • 9th grade: 132
  • 10th grade: 74
  • 11th grade: 46
  • 12th grade, no diploma: 85
  • High school graduate (or equivalency): 1,079
  • Less than 1 year of college: 132
  • Some college more than 1 year, no degree: 313
  • Associate degree: 253
  • Bachelor's degree: 290
  • Master's degree: 133
  • Professional school degree: 13
  • Doctorate degree: 0
Educational Attainment for Males

Education attainment for females 25 years and older:

  • No schooling: 17
  • Nursery to 4th grade: 36
  • 5th and 6th grade: 35
  • 7th and 8th grade: 103
  • 9th grade: 114
  • 10th grade: 109
  • 11th grade: 67
  • 12th grade, no diploma: 98
  • High school graduate (or equivalency): 1,019
  • Less than 1 year of college: 223
  • Some college more than 1 year, no degree: 394
  • Associate degree: 231
  • Bachelor's degree: 388
  • Master's degree: 67
  • Professional school degree: 34
  • Doctorate degree: 0
Educational Attainment for Females
Blackstone marital status for males
Blackstone marital status for females

Housing units in structures:

  • One, detached: 1,930
  • One, attached: 139
  • Two: 575
  • 3 or 4: 412
  • 5 to 9: 192
  • 10 to 19: 48
  • 20 to 49: 18
  • Mobile homes: 17

Median worth of mobile homes: $101,319

Housing units lacking complete plumbing facilities: 0.3%

Housing units lacking complete kitchen facilities: 0.8%
Year householders moved into residence in Blackstone
Houses and condos Apartments
Most commonly used house heating fuel in houses and condos in Blackstone, MA
  • 73.5%Fuel oil, kerosene, etc.
  • 19.6%Utility gas
  • 3.8%Electricity
  • 1.7%Wood
  • 1.4%Bottled, tank, or LP gas
Most commonly used house heating fuel in apartments in Blackstone, MA
  • 52.9%Fuel oil, kerosene, etc.
  • 26.5%Utility gas
  • 14.9%Electricity
  • 2.9%Bottled, tank, or LP gas
  • 2.9%No fuel used

Private vs. public school enrollment:

Students in private schools in grades 1 to 8 (elementary and middle school): 50
Here:

4.3%
Massachusetts:

10.8%

Students in private schools in grades 9 to 12 (high school): 64
Here:

11.1%
Massachusetts:

12.2%

Students in private undergraduate colleges: 142
Here:

40.2%
Massachusetts:

48.2%
School Enrollment by Level of School for Male Students
School Enrollment by Level of School for Female Students
Age and Sex of Sensory-Disabled Noninstitutionalized Residents
Age and Sex of Physically-Disabled Noninstitutionalized Residents
Age and Sex of Mentally-Disabled Noninstitutionalized Residents
Age and Sex of Self-Care Disabled Noninstitutionalized Residents
Age and Sex of Go-Outside-Home Disabled Noninstitutionalized Residents
Age and Sex of Noninstitutionalized Residents with Employment Disability