Dibrell, TN (Tennessee) Houses and Residents
| Dibrell: | $185,452 |
| Tennessee: | $284,800 |
Total population: 6,640 (Urban population: 38 (all inside urban clusters), Rural population: 6,352 (483 farm, 5,869 nonfarm))
Houses: 2,646 (2,417 occupied: 2,028 owner occupied, 389 renter occupied)
| % of renters here: | 16% |
| State: | 33% |
Housing density: 27 houses/condos per square mile
Median price asked for vacant for-sale houses and condos in 2022 in this county: $186,737.
Median contract rent in 2022: $581 (lower quartile is $471, upper quartile is $708)
Median rent asked for vacant for-rent units in 2022: $432
Median gross rent in Dibrell, TN in 2022: $764
Housing units in Dibrell with a mortgage: 647 (24 second mortgage, 16 home equity loan, 0 both second mortgage and home equity loan)
Houses without a mortgage: 540


Household type by relationship:
Households: 39,259- In family households: 33,361 (7,733 male householders, 3,158 female householders)
8,050 spouses, 11,109 children (10,097 natural, 280 adopted, 732 stepchildren), 1,042 grandchildren, 328 brothers or sisters, 253 parents, foster children, 489 other relatives, 988 non-relatives
- In nonfamily households: 5,898 (2,343 male householders (1,903 living alone)), 2,616 female householders (2,375 living alone)), 939 nonrelatives
- In group quarters: 580 (479 institutionalized population)
6,276 married couples with children.
2,064 single-parent households (471 men, 1,593 women).
92.9% of residents of Dibrell speak English at home.
6.6% of residents speak Spanish at home (33% speak English very well, 14% speak English well, 35% speak English not well, 18% don't speak English at all).
0.4% of residents speak other Indo-European language at home (100% speak English very well).
0.1% of residents speak other language at home (100% speak English well).
Foreign born population: 644 (8.7%)
(19.4% of them are naturalized citizens)
| Here: | 6.3 |
| State: | 6.5 |
| Here: | 4.9 |
| State: | 4.4 |

- Bedrooms in owner-occupied houses and condos in Dibrell, Tennessee
- 7no bedroom
- 401 bedroom
- 5232 bedrooms
- 1,2323 bedrooms
- 1864 bedrooms
- 405+ bedrooms

- Bedrooms in renter-occupied apartments in Dibrell, Tennessee
- 0no bedroom
- 231 bedroom
- 1992 bedrooms
- 1413 bedrooms
- 264 bedrooms
- 05+ bedrooms

- Cars and other vehicles available in Dibrell in owner-occupied houses/condos
- 58no vehicle
- 4991 vehicle
- 9892 vehicles
- 3343 vehicles
- 884 vehicles
- 605+ vehicles

- Cars and other vehicles available in Dibrell in renter-occupied apartments
- 46no vehicle
- 1411 vehicle
- 1622 vehicles
- 233 vehicles
- 174 vehicles
- 05+ vehicles

- Rooms in owner-occupied houses in Dibrell, Tennessee
- 01 room
- 72 rooms
- 503 rooms
- 2204 rooms
- 5305 rooms
- 5806 rooms
- 3687 rooms
- 1948 rooms
- 799+ rooms

- Rooms in renter-occupied apartments in Dibrell, Tennessee
- 01 room
- 162 rooms
- 343 rooms
- 1234 rooms
- 885 rooms
- 646 rooms
- 327 rooms
- 238 rooms
- 99+ rooms


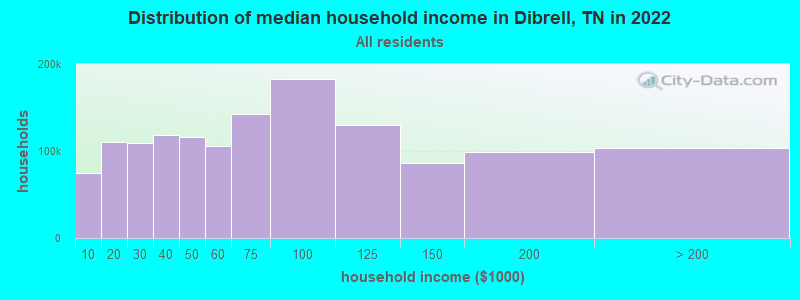
Dibrell, TN household income distribution

- 49,927Less than $10,000
- 83,529$10,000 to $19,999
- 79,272$20,000 to $29,999
- 81,151$30,000 to $39,999
- 78,481$40,000 to $49,999
- 72,622$50,000 to $59,999
- 98,987$60,000 to $74,999
- 126,187$75,000 to $99,999
- 94,284$100,000 to $124,999
- 56,284$125,000 to $149,999
- 61,834$150,000 to $199,999
- 52,555$200,000 or more
Percentage of workers working in this county: 72.5%
Number of people working at home: 336 (9.8% of all workers)
Travel time to work (commute)
- Less than 5 minutes: 102
- 5 to 9 minutes: 260
- 10 to 14 minutes: 365
- 15 to 19 minutes: 597
- 20 to 24 minutes: 431
- 25 to 29 minutes: 238
- 30 to 34 minutes: 387
- 35 to 39 minutes: 49
- 40 to 44 minutes: 47
- 45 to 59 minutes: 135
- 60 to 89 minutes: 100
- 90 or more minutes: 172
Means of transportation to work:
- Drove a car alone: 2,326 (76.4%)
- Carpooled: 472 (15.5%)
- Bus or trolley bus: 4 (0.1%)
- Walked: 81 (2.7%)
- Worked at home: 161 (5.3%)


- Year of entry for the foreign-born population in Dibrell, Tennessee
- 1691995 to March 2000
- 791990 to 1994
- 291985 to 1989
- 151980 to 1984
- 91975 to 1979
- 31970 to 1974
- 01965 to 1969
- 10Before 1965
Most common places of birth for foreign-born residents (%):
| Dibrell: | 97.5% (306) |
| Tennessee: | 28.1% (44,682) |
| Dibrell: | 2.5% (8) |
| Tennessee: | 0.3% (476) |
Place of birth for U.S.-born residents:
- This state: 4,962
- Other state: 1,105
- Northeast: 74
- Midwest: 500
- South: 424
- West: 107
61% of Dibrell residents lived in the same house 5 years ago.
Out of people who lived in different houses, 60% lived in this county.
Out of people who lived in different counties, 75% lived in Tennessee.
Education attainment for males 25 years and older:
- No schooling: 21
- Nursery to 4th grade: 48
- 5th and 6th grade: 55
- 7th and 8th grade: 168
- 9th grade: 140
- 10th grade: 227
- 11th grade: 76
- 12th grade, no diploma: 103
- High school graduate (or equivalency): 864
- Less than 1 year of college: 175
- Some college more than 1 year, no degree: 168
- Associate degree: 12
- Bachelor's degree: 120
- Master's degree: 0
- Professional school degree: 11
- Doctorate degree: 0

Education attainment for females 25 years and older:
- No schooling: 19
- Nursery to 4th grade: 15
- 5th and 6th grade: 19
- 7th and 8th grade: 199
- 9th grade: 66
- 10th grade: 109
- 11th grade: 91
- 12th grade, no diploma: 109
- High school graduate (or equivalency): 875
- Less than 1 year of college: 209
- Some college more than 1 year, no degree: 197
- Associate degree: 39
- Bachelor's degree: 64
- Master's degree: 53
- Professional school degree: 50
- Doctorate degree: 0


Housing units in structures:
- One, detached: 1,961
- One, attached: 39
- 5 to 9: 12
- Mobile homes: 634
Median worth of mobile homes: $70,508
Housing units lacking complete kitchen facilities: 2.5%

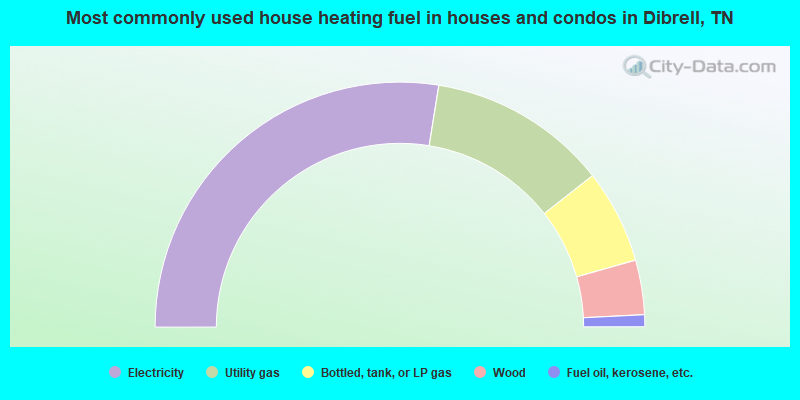
- 55.1%Electricity
- 23.7%Utility gas
- 12.4%Bottled, tank, or LP gas
- 7.2%Wood
- 1.6%Fuel oil, kerosene, etc.
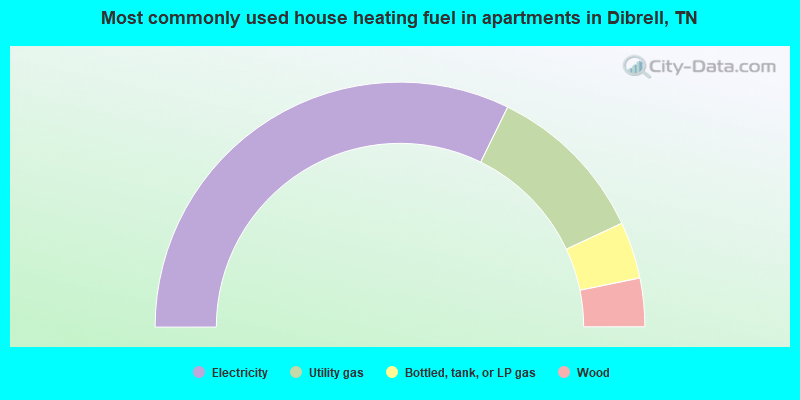
- 64.5%Electricity
- 21.6%Utility gas
- 7.5%Bottled, tank, or LP gas
- 6.4%Wood
Private vs. public school enrollment:
| Here: | 0.7% |
| Tennessee: | 9.5% |
| Here: | 0.0% |
| Tennessee: | 10.4% |
| Here: | 0.0% |
| Tennessee: | 22.8% |


