Framingham, MA (Massachusetts) Houses and Residents
| Framingham: | $602,500 |
| Massachusetts: | $534,700 |
Mean price in 2022:
Detached houses: $638,490
Here: $638,490 State: $651,570 Townhouses or other attached units: $384,612
Here: $384,612 State: $617,749 In 2-unit structures: $509,966
Here: $509,966 State: $594,808 In 5-or-more-unit structures: $284,823
Here: $284,823 State: $555,768
Total population: 68,318 (Urban population: 65,875, Rural population: 1,035 (all nonfarm))
Houses: 29,348 (28,434 occupied: 15,437 owner occupied, 12,997 renter occupied)
| % of renters here: | 46% |
| State: | 38% |
Housing density: 1,168 houses/condos per square mile
Median price asked for vacant for-sale houses and condos in 2022: $911,715.
Median contract rent in 2022: $1,645 (lower quartile is $933, upper quartile is over $2,000)
Median rent asked for vacant for-rent units in 2022: $1,879
Median gross rent in Framingham, MA in 2022: $1,707
Housing units in Framingham with a mortgage: 11,029 (1,677 second mortgage, 0 home equity loan, 1,643 both second mortgage and home equity loan)
Houses without a mortgage: 604
Median household income for houses/condos with a mortgage: $151,191
Median household income for apartments without a mortgage: $87,473
Median monthly housing costs: $1,965
Compare current foreclosures in Framingham, MA:
| Photo | Address | Area | Beds / Baths | Price | Details |
|---|---|---|---|---|---|

|
#1
Stillman St
Framingham, MA 01702
|
1,122 sq. feet
|
1 baths 2 beds |
$418,000
|
show details |

|
#2
Willis St Apt 37
Framingham, MA 01702
|
875 sq. feet
|
2 baths 2 beds |
show details | |

|
#3
Emily Rd
Framingham, MA 01701
|
2,421 sq. feet
|
3 baths 4 beds |
show details | |

|
#4
Linda Ave
Framingham, MA 01701
|
1,670 sq. feet
|
3 baths 4 beds |
show details | |

|
#5
Cherry St
Framingham, MA 01701
|
1,380 sq. feet
|
1 baths 4 beds |
show details | |

|
#6
Lowther Rd
Framingham, MA 01701
|
1,808 sq. feet
|
2 baths 4 beds |
show details | |

|
#7
Surro Dr
Framingham, MA 01701
|
2,912 sq. feet
|
4 baths 4 beds |
show details | |

|
#8
Goodnow Ln
Framingham, MA 01702
|
2,342 sq. feet
|
2 baths 4 beds |
show details | |

|
#9
Spring Ln
Framingham, MA 01701
|
1,224 sq. feet
|
2 baths 3 beds |
show details | |

|
#10
Merriam Rd
Framingham, MA 01701
|
1,400 sq. feet
|
2 baths 4 beds |
show details |
| Photo | Address | Area | Beds / Baths | Price | Details |
|---|---|---|---|---|---|

|
#11
Westgate Rd
Framingham, MA 01701
|
1,056 sq. feet
|
2 baths 3 beds |
show details | |

|
#12
Danforth St
Framingham, MA 01701
|
1,080 sq. feet
|
1 baths 3 beds |
show details | |

|
#13
Ashmont Dr
Framingham, MA 01701
|
1,703 sq. feet
|
1 baths 3 beds |
show details | |

|
#14
Torrey St # 1
Framingham, MA 01702
|
3,736 sq. feet
|
4 baths 8 beds |
show details | |

|
#15
Maple St
Framingham, MA 01702
|
1,824 sq. feet
|
1 baths 3 beds |
show details | |

|
#16
Cherry St
Framingham, MA 01701
|
1,190 sq. feet
|
1 baths 3 beds |
show details | |

|
#17
Old Central Tpke
Framingham, MA 01702
|
2,976 sq. feet
|
4 baths 6 beds |
show details | |

|
#18
Winch St
Framingham, MA 01701
|
1,271 sq. feet
|
2 baths 4 beds |
show details | |

|
#19
Pleasant St
Framingham, MA 01701
|
1,531 sq. feet
|
2 baths 3 beds |
show details | |

|
#20
Linda Ave
Framingham, MA 01701
|
1,670 sq. feet
|
2 baths 4 beds |
show details |
| Photo | Address | Area | Beds / Baths | Price | Details |
|---|---|---|---|---|---|

|
#21
Spring Ln
Framingham, MA 01701
|
1,224 sq. feet
|
2 baths 3 beds |
show details | |

|
#22
Lyman Rd
Framingham, MA 01701
|
1,542 sq. feet
|
1 baths 3 beds |
show details | |

|
#23
Pleasant St
Framingham, MA 01701
|
4,544 sq. feet
|
3 baths 4 beds |
show details | |

|
#24
Capri Dr
Framingham, MA 01701
|
1,152 sq. feet
|
1 baths 3 beds |
show details | |

|
#25
Wood Ter
Framingham, MA 01702
|
1,452 sq. feet
|
1 baths 3 beds |
show details | |

|
#26
Pleasant St
Framingham, MA 01701
|
1,200 sq. feet
|
2 baths 3 beds |
show details | |

|
#27
Clinton St
Framingham, MA 01702
|
1,666 sq. feet
|
1 baths 5 beds |
show details | |

|
#28
Morse Rd
Framingham, MA 01701
|
4,107 sq. feet
|
2 baths 6 beds |
show details | |

|
#29
Joseph Rd
Framingham, MA 01701
|
1,918 sq. feet
|
3 baths 4 beds |
show details | |

|
#30
Sloane Dr
Framingham, MA 01701
|
2,444 sq. feet
|
3 baths 6 beds |
show details |
| Photo | Address | Area | Beds / Baths | Price | Details |
|---|---|---|---|---|---|

|
#31
Audrea Rd
Framingham, MA 01701
|
1,427 sq. feet
|
1 baths 3 beds |
show details | |

|
#32
Guadalcanal Rd
Framingham, MA 01702
|
2,392 sq. feet
|
2 baths 6 beds |
show details | |

|
#33
Cunningham Dr
Framingham, MA 01701
|
1,128 sq. feet
|
1 baths 3 beds |
show details | |

|
#34
Gina Cir
Framingham, MA 01701
|
1,225 sq. feet
|
1 baths 3 beds |
show details | |

|
#35
Picard Ter
Framingham, MA 01702
|
2,484 sq. feet
|
3 baths 6 beds |
show details | |

|
#36
Highgate Rd
Framingham, MA 01701
|
1,176 sq. feet
|
2 baths 3 beds |
show details | |

|
#37
Beaver Park Rd
Framingham, MA 01702
|
- sq. feet
|
- baths - beds |
show details | |

|
#38
Cochituate Rd Unit 5088
Framingham, MA 01701
|
- sq. feet
|
- baths - beds |
show details | |

|
#39
Auburn St # 3
Framingham, MA 01701
|
- sq. feet
|
- baths - beds |
show details | |

|
#40
Hamilton St
Framingham, MA 01701
|
- sq. feet
|
- baths - beds |
show details |
| Photo | Address | Area | Beds / Baths | Price | Details |
|---|---|---|---|---|---|

|
#41
Queens Way # 8
Framingham, MA 01701
|
- sq. feet
|
- baths - beds |
show details | |

|
#42
Thomas Dr
Framingham, MA 01701
|
- sq. feet
|
- baths - beds |
show details | |

|
#43
John J Brady Dr Apt E
Framingham, MA 01702
|
- sq. feet
|
- baths - beds |
show details | |

|
#44
Larrabee Ave
Framingham, MA 01702
|
- sq. feet
|
- baths - beds |
show details | |

|
#45
Worcester Rd Apt 8105
Framingham, MA 01702
|
- sq. feet
|
- baths - beds |
show details | |

|
#46
Jean St
Framingham, MA 01701
|
- sq. feet
|
- baths - beds |
show details | |

|
Check over 1 million property listings on Foreclosure.com!
|
browse all offers | |||

Latest news about housing in Framingham, MA collected exclusively by city-data.com from local newspapers, TV, and radio stations


Median year apartment built: 1973
Household type by relationship:
Households: 70,947- Male householders: 13,119 (2,584 living alone), Female householders: 15,315 (4,984 living alone)
14,196 spouses (13,729 opposite-sex spouses), 1,960 unmarried partners, (1,737 opposite-sex unmarried partners), 17,540 children (16,763 natural, 341 adopted, 436 stepchildren), 1,148 grandchildren, 303 brothers or sisters, 280 parents, 261 foster children, 1,822 other relatives, 1,566 non-relatives
- In group quarters: 3,437
Size of family households: 9,690 2-persons, 3,848 3-persons, 4,242 4-persons, 982 5-persons, 473 6-persons, 325 7-or-more-persons.
Size of nonfamily households: 7,568 1-person, 1,086 2-persons, 122 3-persons, 98 5-persons.
9,742 married couples with children.
3,684 single-parent households (819 men, 2,865 women).
57.4% of residents of Framingham speak English at home.
15.4% of residents speak Spanish at home (52% speak English very well, 20% speak English well, 14% speak English not well, 13% don't speak English at all).
22.2% of residents speak other Indo-European language at home (49% speak English very well, 18% speak English well, 18% speak English not well, 15% don't speak English at all).
5.0% of residents speak Asian or Pacific Island language at home (64% speak English very well, 21% speak English well, 12% speak English not well, 4% don't speak English at all).
1.6% of residents speak other language at home (92% speak English very well, 5% speak English well, 3% speak English not well).
Foreign born population: 22,734 (32.0%)
(48.2% of them are naturalized citizens)
| Here: | 7.0 |
| State: | 6.5 |
| Here: | 4.0 |
| State: | 4.0 |

- Bedrooms in owner-occupied houses and condos in Framingham, Massachusetts
- 0no bedroom
- 2051 bedroom
- 2,1942 bedrooms
- 7,4883 bedrooms
- 4,8434 bedrooms
- 7075+ bedrooms

- Bedrooms in renter-occupied apartments in Framingham, Massachusetts
- 521no bedroom
- 4,2041 bedroom
- 4,6852 bedrooms
- 2,8343 bedrooms
- 6634 bedrooms
- 905+ bedrooms

- Cars and other vehicles available in Framingham in owner-occupied houses/condos
- 137no vehicle
- 3,9651 vehicle
- 8,5092 vehicles
- 2,1313 vehicles
- 5464 vehicles
- 1495+ vehicles

- Cars and other vehicles available in Framingham in renter-occupied apartments
- 1,693no vehicle
- 7,9801 vehicle
- 2,7002 vehicles
- 4703 vehicles
- 1544 vehicles
- 05+ vehicles

- Rooms in owner-occupied houses in Framingham, Massachusetts
- 01 room
- 362 rooms
- 2823 rooms
- 7964 rooms
- 2,2675 rooms
- 2,6426 rooms
- 3,3967 rooms
- 3,4348 rooms
- 2,5849+ rooms

- Rooms in renter-occupied apartments in Framingham, Massachusetts
- 4441 room
- 1,5402 rooms
- 2,5983 rooms
- 4,2474 rooms
- 1,7465 rooms
- 9816 rooms
- 9897 rooms
- 2798 rooms
- 1739+ rooms


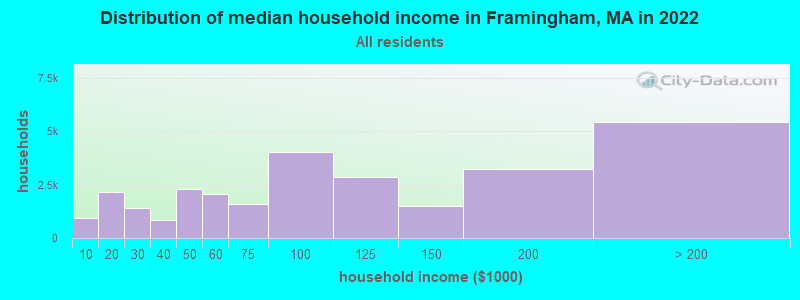
Framingham, MA household income distribution

- 954Less than $10,000
- 2,169$10,000 to $19,999
- 1,396$20,000 to $29,999
- 850$30,000 to $39,999
- 2,321$40,000 to $49,999
- 2,083$50,000 to $59,999
- 1,615$60,000 to $74,999
- 4,029$75,000 to $99,999
- 2,844$100,000 to $124,999
- 1,496$125,000 to $149,999
- 3,235$150,000 to $199,999
- 5,442$200,000 or more
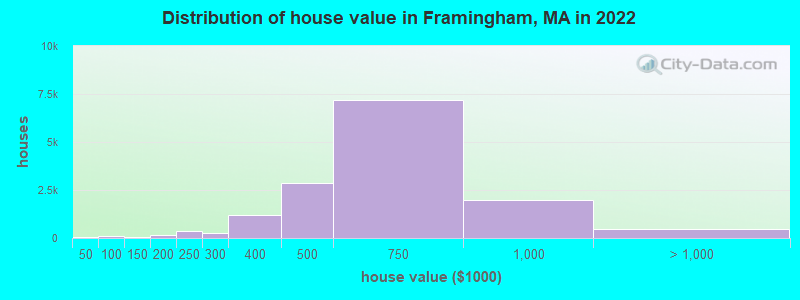
Home value of owner - occupied houses in 2022 in Framingham, MA
-
- 40Less than $10,000
- 17$25,000 to $29,999
- 8$30,000 to $34,999
- 28$50,000 to $59,999
- 24$60,000 to $69,999
- 22$70,000 to $79,999
- 37$80,000 to $89,999
- 21$100,000 to $124,999
- 10$125,000 to $149,999
- 54$150,000 to $174,999
- 120$175,000 to $199,999
- 366$200,000 to $249,999
- 278$250,000 to $299,999
- 1,209$300,000 to $399,999
- 2,855$400,000 to $499,999
- 7,186$500,000 to $749,999
- 1,975$750,000 to $999,999
- 315$1,000,000 to $1,499,999
- 62$1,500,000 to $1,999,999
- 106$2,000,000 or more
Rent paid by renters in 2022 in Framingham, MA
-
- 26Less than $100
- 192$100 to $149
- 223$150 to $199
- 145$200 to $249
- 352$250 to $299
- 77$300 to $349
- 273$350 to $399
- 353$400 to $449
- 96$450 to $499
- 166$500 to $549
- 64$550 to $599
- 138$600 to $649
- 122$650 to $699
- 3$700 to $749
- 83$750 to $799
- 151$800 to $899
- 362$900 to $999
- 1,130$1,000 to $1,249
- 1,698$1,250 to $1,499
- 3,927$1,500 to $1,999
- 2,060$2,000 to $2,499
- 381$2,500 to $2,999
- 218$3,000 to $3,499
- 139$3,500 or more
- 360No cash rent


Percentage of workers working in this county: 73.9%
Number of people working at home: 5,451 (15.5% of all workers)
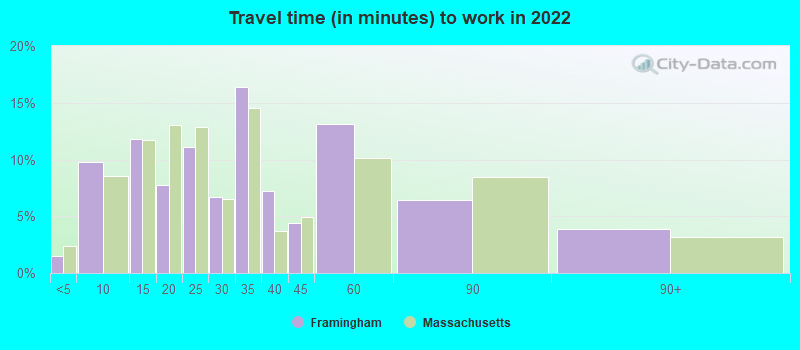
Travel time to work (commute)
- Less than 5 minutes: 421
- 5 to 9 minutes: 3,267
- 10 to 14 minutes: 3,663
- 15 to 19 minutes: 4,678
- 20 to 24 minutes: 2,815
- 25 to 29 minutes: 843
- 30 to 34 minutes: 5,784
- 35 to 39 minutes: 1,263
- 40 to 44 minutes: 1,826
- 45 to 59 minutes: 2,191
- 60 to 89 minutes: 2,324
- 90 or more minutes: 682
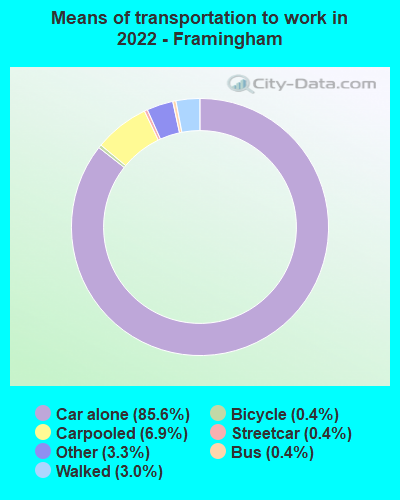
Means of transportation to work:
- Drove a car alone: 30,914 (69.3%)
- Carpooled: 2,600 (5.8%)
- Bus: 119 (0.3%)
- Subway or elevated rail: 146 (0.3%)
- Long-distance train or commuter rail: 12 (0.0%)
- Taxi: 1,545 (3.5%)
- Bicycle: 172 (0.4%)
- Walked: 1,114 (2.5%)
- Worked at home: 7,440 (16.7%)

- Unemployment by race in 2022
- Unemployment rate for White non-Hispanic residents
- 1.1%Males
- 2.8%Females
- Unemployment rate for Black residents
- 9.3%Males
- 5.0%Females
- Unemployment rate for Asian residents
- 1.4%Males
- 2.4%Females
- Unemployment rate for other race residents
- 1.4%Males
- 3.2%Females
- Unemployment rate for two or more race residents
- 2.2%Males
- 5.7%Females
- Unemployment rate for Hispanic or Latino residents
- 3.0%Males
- 2.1%Females

- Year of entry for the foreign-born population in Framingham, Massachusetts
- 9,9702010 or later
- 5,1772000 to 2009
- 3,9791990 to 1999
- 3,1941980 to 1989
- 1,2651970 to 1979
- 1,503Before 1970

First ancestries reported:
- Brazilian: 8,755 (21.6%)
- Irish: 3,033 (7.5%)
- Italian: 2,214 (5.5%)
- American: 1,368 (3.4%)
- English: 1,215 (3.0%)
- Russian: 868 (2.1%)
- European: 548 (1.4%)
- Portuguese: 485 (1.2%)
- Scottish: 376 (0.9%)
- Eastern European: 374 (0.9%)
- French Canadian: 373 (0.9%)
- Jamaican: 361 (0.9%)
- Canadian: 360 (0.9%)
- German: 351 (0.9%)
- Polish: 345 (0.9%)
- Iranian: 284 (0.7%)
- Egyptian: 252 (0.6%)
- African: 248 (0.6%)
- Haitian: 242 (0.6%)
- Norwegian: 199 (0.5%)
- Greek: 188 (0.5%)
- Ugandan: 150 (0.4%)
- Cape Verdean: 126 (0.3%)
- French: 123 (0.3%)
- Swedish: 120 (0.3%)
- British: 115 (0.3%)
- Northern European: 108 (0.3%)
- Finnish: 104 (0.3%)
- Trinidadian and Tobagonian: 103 (0.3%)
- Ukrainian: 80 (0.2%)
- Armenian: 79 (0.2%)
- Israeli: 78 (0.2%)
- Ghanaian: 77 (0.2%)
- Scotch-Irish: 67 (0.2%)
- Turkish: 67 (0.2%)
- Kenyan: 66 (0.2%)
- Lithuanian: 65 (0.2%)
- West Indian: 63 (0.2%)
- Albanian: 58 (0.1%)
- Nigerian: 49 (0.1%)
- Dutch: 45 (0.1%)
- Ethiopian: 37 (0.09%)
- Syrian: 37 (0.09%)
- South African: 35 (0.09%)
- Hungarian: 32 (0.08%)
- Croatian: 31 (0.08%)
- Austrian: 29 (0.07%)
- Czech: 29 (0.07%)
- Bahamian: 29 (0.07%)
- Moroccan: 27 (0.07%)
- Romanian: 23 (0.06%)
- Swiss: 23 (0.06%)
- Slovak: 20 (0.05%)
- Celtic: 18 (0.04%)
- Jordanian: 10 (0.02%)
- Welsh: 8 (0.02%)
- U.S. Virgin Islander: 4 (0.01%)
Most common places of birth for foreign-born residents (%):
| Framingham: | 38.6% (8,821) |
| Massachusetts: | 7.6% (92,959) |
| Framingham: | 5.9% (1,357) |
| Massachusetts: | 6.8% (82,934) |
| Framingham: | 5.5% (1,265) |
| Massachusetts: | 8.3% (101,767) |
| Framingham: | 5.0% (1,135) |
| Massachusetts: | 1.0% (11,727) |
| Framingham: | 5.0% (1,134) |
| Massachusetts: | 8.4% (103,233) |
| Framingham: | 4.6% (1,051) |
| Massachusetts: | 3.7% (45,667) |
| Framingham: | 4.2% (957) |
| Massachusetts: | 2.7% (32,733) |
| Framingham: | 1.8% (422) |
| Massachusetts: | 1.1% (13,065) |
| Framingham: | 1.5% (351) |
| Massachusetts: | 1.5% (18,278) |
Place of birth for U.S.-born residents:
- This state: 32,850
- Other state: 12,670
- Northeast: 6,025
- Midwest: 1,786
- South: 1,982
- West: 2,877
87.5% of Framingham residents lived in the same house 1 years ago.
Out of people who lived in different houses, 36.5% lived in this county.
Out of people who lived in different counties, 65.9% lived in Massachusetts.
| Framingham: | 87.5% |
| State average: | 87.7% |
Education attainment for males 25 years and older:
- No schooling: 547
- Nursery to 4th grade: 0
- 5th and 6th grade: 627
- 7th and 8th grade: 299
- 9th grade: 1,047
- 10th grade: 309
- 11th grade: 208
- 12th grade, no diploma: 1,321
- High school graduate (or equivalency): 4,506
- Less than 1 year of college: 963
- Some college more than 1 year, no degree: 2,047
- Associate degree: 1,276
- Bachelor's degree: 4,842
- Master's degree: 3,858
- Professional school degree: 604
- Doctorate degree: 507

Education attainment for females 25 years and older:
- No schooling: 507
- Nursery to 4th grade: 512
- 5th and 6th grade: 122
- 7th and 8th grade: 378
- 9th grade: 436
- 10th grade: 261
- 11th grade: 104
- 12th grade, no diploma: 256
- High school graduate (or equivalency): 5,863
- Less than 1 year of college: 1,257
- Some college more than 1 year, no degree: 2,590
- Associate degree: 2,292
- Bachelor's degree: 6,566
- Master's degree: 4,260
- Professional school degree: 489
- Doctorate degree: 988


Housing units in structures:
- One, detached: 14,532
- One, attached: 1,779
- Two: 2,252
- 3 or 4: 2,425
- 5 to 9: 1,434
- 10 to 19: 1,498
- 20 to 49: 2,481
- 50 or more: 2,947
House/condo owner moved in on average 14 years ago
Renter moved in on average 3 years ago

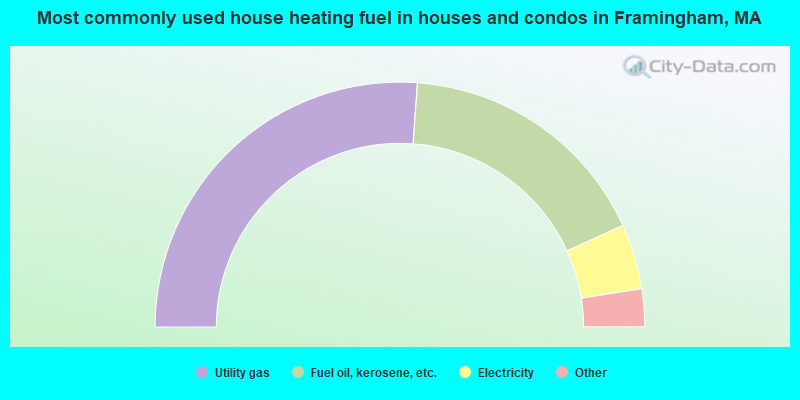
- 52.3%Utility gas
- 34.1%Fuel oil, kerosene, etc.
- 8.6%Electricity
- 1.7%Bottled, tank, or LP gas
- 1.6%Other fuel
- 1.2%Wood
- 0.3%Coal or coke
- 0.1%Solar energy
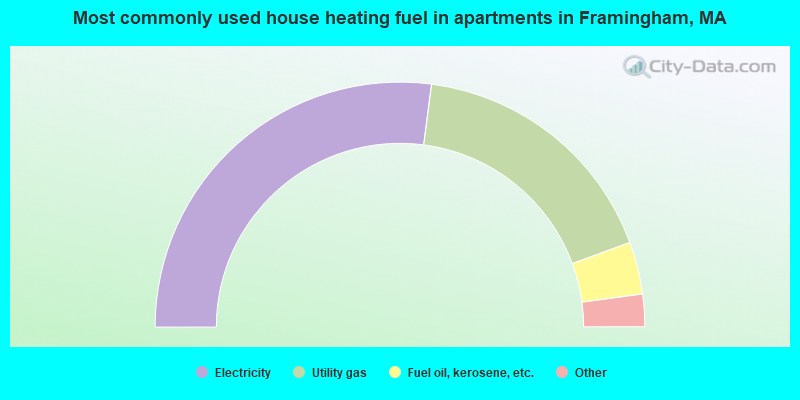
- 54.2%Electricity
- 34.7%Utility gas
- 6.9%Fuel oil, kerosene, etc.
- 3.4%Bottled, tank, or LP gas
- 0.7%Other fuel
- 0.2%No fuel used
Private vs. public school enrollment:
| Here: | 13.2% |
| Massachusetts: | 10.3% |
| Here: | 14.7% |
| Massachusetts: | 12.3% |
| Here: | 23.2% |
| Massachusetts: | 51.2% |