Mount Juliet, TN (Tennessee) Houses and Residents
| Mount Juliet: | $464,184 |
| Tennessee: | $284,800 |
Mean price in 2022:
Detached houses: $436,418
Here: $436,418 State: $374,382 Townhouses or other attached units: $311,964
Here: $311,964 State: $354,101 In 3-to-4-unit structures: $222,338
Here: $222,338 State: $239,060 In 5-or-more-unit structures: $324,442
Here: $324,442 State: $317,434 Mobile homes: $39,877
Here: $39,877 State: $101,421
Total population: 29,387 (Urban population: 10,847, Rural population: 1,438 (all nonfarm))
Houses: 16,791 (15,481 occupied: 12,094 owner occupied, 3,861 renter occupied)
| % of renters here: | 24% |
| State: | 33% |
Housing density: 1,034 houses/condos per square mile
Median price asked for vacant for-sale houses and condos in 2022: $452,995.
Median contract rent in 2022: $1,779 (lower quartile is $1,173, upper quartile is over $2,000)
Median rent asked for vacant for-rent units in 2022: $1,759
Median gross rent in Mount Juliet, TN in 2022: $1,894
Housing units in Mount Juliet with a mortgage: 9,158 (685 second mortgage, 24 home equity loan, 553 both second mortgage and home equity loan)
Houses without a mortgage: 261
Median household income for houses/condos with a mortgage: $122,892
Median household income for apartments without a mortgage: $102,110
Median monthly housing costs: $1,756
Compare current foreclosures in Mount Juliet, TN:
| Photo | Address | Area | Beds / Baths | Price | Details |
|---|---|---|---|---|---|

|
#1
Belinda Pkwy
Mount Juliet, TN 37122
|
1,336 sq. feet
|
2 baths - beds |
show details | |

|
#2
Saundersville Rd
Mount Juliet, TN 37122
|
1,096 sq. feet
|
1 baths - beds |
show details | |

|
#3
Old Lebanon Dirt Rd
Mount Juliet, TN 37122
|
1,536 sq. feet
|
2 baths - beds |
show details | |

|
#4
Burgess Rd
Mount Juliet, TN 37122
|
2,112 sq. feet
|
2 baths - beds |
show details | |

|
#5
Hillwood Dr
Mount Juliet, TN 37122
|
1,534 sq. feet
|
2 baths - beds |
show details | |

|
#6
Mires Rd
Mount Juliet, TN 37122
|
1,824 sq. feet
|
2 baths - beds |
show details | |

|
#7
Central Pike
Mount Juliet, TN 37122
|
3,280 sq. feet
|
2 baths - beds |
show details | |

|
#8
Creekfront Dr
Mount Juliet, TN 37122
|
1,805 sq. feet
|
2 baths - beds |
show details | |

|
#9
Andrew Ct
Mount Juliet, TN 37122
|
1,036 sq. feet
|
1 baths - beds |
show details | |

|
#10
Hunters Pl
Mount Juliet, TN 37122
|
1,512 sq. feet
|
2 baths - beds |
show details |
| Photo | Address | Area | Beds / Baths | Price | Details |
|---|---|---|---|---|---|

|
#11
Alex Way
Mount Juliet, TN 37122
|
2,455 sq. feet
|
3 baths - beds |
show details | |

|
#12
Meadow Gln
Mount Juliet, TN 37122
|
3,191 sq. feet
|
3 baths - beds |
show details | |

|
#13
Sunset Dr
Mount Juliet, TN 37122
|
1,053 sq. feet
|
1 baths - beds |
show details | |

|
#14
Logue Rd
Mount Juliet, TN 37122
|
1,300 sq. feet
|
1 baths - beds |
show details | |

|
#15
Brookvalley Pl
Mount Juliet, TN 37122
|
4,252 sq. feet
|
3 baths - beds |
show details | |

|
#16
Acorn Way
Mount Juliet, TN 37122
|
2,460 sq. feet
|
2 baths - beds |
show details | |

|
#17
Quarry Rd
Mount Juliet, TN 37122
|
1,200 sq. feet
|
1 baths - beds |
show details | |

|
#18
Brookstone Dr
Mount Juliet, TN 37122
|
2,110 sq. feet
|
2 baths - beds |
show details | |

|
#19
Secretariat Dr
Mount Juliet, TN 37122
|
1,863 sq. feet
|
2 baths - beds |
show details | |

|
#20
Hilltop Dr
Mount Juliet, TN 37122
|
2,078 sq. feet
|
2 baths - beds |
show details |
| Photo | Address | Area | Beds / Baths | Price | Details |
|---|---|---|---|---|---|

|
#21
Kalye Ct
Mount Juliet, TN 37122
|
2,198 sq. feet
|
2 baths - beds |
show details | |

|
#22
Weston Dr
Mount Juliet, TN 37122
|
1,894 sq. feet
|
2 baths - beds |
show details | |

|
#23
Central Pike
Mount Juliet, TN 37122
|
2,321 sq. feet
|
3 baths - beds |
show details | |

|
#24
Summit Way
Mount Juliet, TN 37122
|
1,204 sq. feet
|
2 baths - beds |
show details | |

|
#25
Windtree Trce
Mount Juliet, TN 37122
|
1,232 sq. feet
|
2 baths - beds |
show details | |

|
#26
Rockytop Trl
Mount Juliet, TN 37122
|
2,999 sq. feet
|
2 baths - beds |
show details | |

|
#27
Willow Creek Dr
Mount Juliet, TN 37122
|
- sq. feet
|
- baths - beds |
show details | |

|
#28
Old Pleasant Grove Rd # 327
Mount Juliet, TN 37122
|
- sq. feet
|
- baths - beds |
show details | |

|
#29
Old Pleasant Grove Rd # 237
Mount Juliet, TN 37122
|
- sq. feet
|
- baths - beds |
show details | |

|
#30
Kennear Ln
Mount Juliet, TN 37122
|
- sq. feet
|
- baths - beds |
show details |
| Photo | Address | Area | Beds / Baths | Price | Details |
|---|---|---|---|---|---|

|
#31
Aventura Dr
Mount Juliet, TN 37122
|
- sq. feet
|
- baths - beds |
show details | |

|
#32
Nonaville Rd # 432
Mount Juliet, TN 37122
|
- sq. feet
|
- baths - beds |
show details | |

|
#33
Napoli Dr
Mount Juliet, TN 37122
|
- sq. feet
|
- baths - beds |
show details | |

|
#34
Addison Dr
Mount Juliet, TN 37122
|
- sq. feet
|
- baths - beds |
show details | |

|
#35
Timber Trail Dr
Mount Juliet, TN 37122
|
- sq. feet
|
- baths - beds |
show details | |

|
#36
Old Lebanon Dirt Rd Apt E60
Mount Juliet, TN 37122
|
- sq. feet
|
- baths - beds |
show details | |

|
#37
Boxcroft Cir
Mount Juliet, TN 37122
|
- sq. feet
|
- baths - beds |
show details | |

|
#38
Landon Dr, Apt 1034
Mount Juliet, TN 37122
|
- sq. feet
|
- baths - beds |
show details | |

|
#39
Sunny Acre Dr
Mount Juliet, TN 37122
|
- sq. feet
|
- baths - beds |
show details | |

|
#40
Logue Rd
Mount Juliet, TN 37122
|
1,440 sq. feet
|
- baths - beds |
show details |
| Photo | Address | Area | Beds / Baths | Price | Details |
|---|---|---|---|---|---|

|
#41
Lebanon Rd
Mount Juliet, TN 37122
|
960 sq. feet
|
- baths - beds |
show details | |

|
#42
Buckhead Trl # 1529
Mount Juliet, TN 37122
|
- sq. feet
|
- baths - beds |
show details | |

|
#43
Aventura Dr
Mount Juliet, TN 37122
|
- sq. feet
|
- baths - beds |
show details | |

|
#44
Terrace Hill Rd
Mount Juliet, TN 37122
|
756 sq. feet
|
- baths - beds |
show details | |

|
#45
Garrett Way
Mount Juliet, TN 37122
|
- sq. feet
|
- baths - beds |
show details | |

|
#46
S Mount Juliet Rd Ste 535
Mount Juliet, TN 37122
|
- sq. feet
|
- baths - beds |
show details | |

|
#47
Willow Creek Dr
Mount Juliet, TN 37122
|
- sq. feet
|
- baths - beds |
show details | |

|
#48
Rolling Creek Dr
Mount Juliet, TN 37122
|
- sq. feet
|
- baths - beds |
show details | |

|
#49
Nonaville Rd # 1130
Mount Juliet, TN 37122
|
- sq. feet
|
- baths - beds |
show details | |

|
Check over 1 million property listings on Foreclosure.com!
|
browse all offers | |||


Median year apartment built: 2011
Household type by relationship:
Households: 42,032- Male householders: 8,522 (1,355 living alone), Female householders: 6,840 (1,440 living alone)
9,695 spouses (9,623 opposite-sex spouses), 614 unmarried partners, (599 opposite-sex unmarried partners), 13,401 children (12,498 natural, 417 adopted, 484 stepchildren), 561 grandchildren, 362 brothers or sisters, 576 parents, 44 foster children, 367 other relatives, 901 non-relatives
- In group quarters: 143
Size of family households: 5,136 2-persons, 3,059 3-persons, 2,334 4-persons, 1,363 5-persons, 275 6-persons, 157 7-or-more-persons.
Size of nonfamily households: 2,938 1-person, 358 2-persons, 254 3-persons, 9 5-persons.
9,402 married couples with children.
1,676 single-parent households (310 men, 1,366 women).
86.2% of residents of Mount Juliet speak English at home.
4.9% of residents speak Spanish at home (59% speak English very well, 22% speak English well, 18% speak English not well, 1% don't speak English at all).
4.8% of residents speak other Indo-European language at home (85% speak English very well, 12% speak English well, 4% speak English not well).
1.5% of residents speak Asian or Pacific Island language at home (80% speak English very well, 6% speak English well, 14% speak English not well).
2.6% of residents speak other language at home (67% speak English very well, 13% speak English well, 16% speak English not well, 3% don't speak English at all).
Foreign born population: 4,379 (10.4%)
(51.6% of them are naturalized citizens)
| Here: | 7.1 |
| State: | 6.5 |
| Here: | 5.2 |
| State: | 4.4 |

- Bedrooms in owner-occupied houses and condos in Mount Juliet, Tennessee
- 0no bedroom
- 341 bedroom
- 1,3442 bedrooms
- 6,0023 bedrooms
- 3,7594 bedrooms
- 9555+ bedrooms

- Bedrooms in renter-occupied apartments in Mount Juliet, Tennessee
- 136no bedroom
- 3131 bedroom
- 1,1222 bedrooms
- 1,9583 bedrooms
- 2544 bedrooms
- 785+ bedrooms

- Cars and other vehicles available in Mount Juliet in owner-occupied houses/condos
- 97no vehicle
- 3,1081 vehicle
- 5,5792 vehicles
- 2,2803 vehicles
- 8534 vehicles
- 1785+ vehicles

- Cars and other vehicles available in Mount Juliet in renter-occupied apartments
- 112no vehicle
- 1,6731 vehicle
- 1,5182 vehicles
- 5143 vehicles
- 354 vehicles
- 105+ vehicles

- Rooms in owner-occupied houses in Mount Juliet, Tennessee
- 01 room
- 02 rooms
- 453 rooms
- 5934 rooms
- 1,6635 rooms
- 2,1986 rooms
- 2,6337 rooms
- 1,7428 rooms
- 3,2209+ rooms
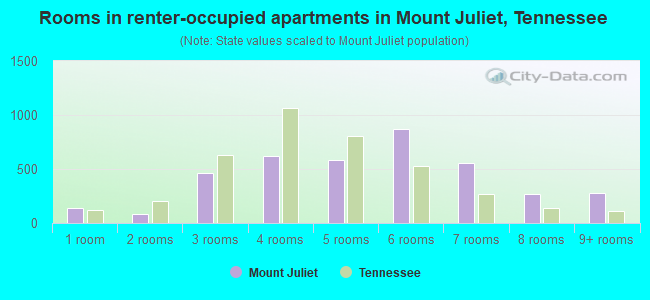
- Rooms in renter-occupied apartments in Mount Juliet, Tennessee
- 1361 room
- 802 rooms
- 4633 rooms
- 6224 rooms
- 5825 rooms
- 8756 rooms
- 5607 rooms
- 2698 rooms
- 2759+ rooms


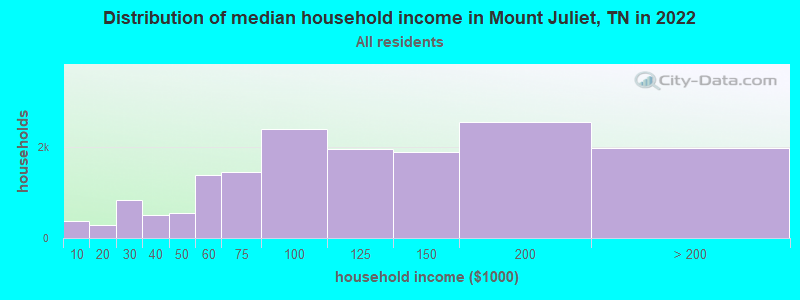
Mount Juliet, TN household income distribution

- 378Less than $10,000
- 277$10,000 to $19,999
- 823$20,000 to $29,999
- 509$30,000 to $39,999
- 540$40,000 to $49,999
- 1,373$50,000 to $59,999
- 1,444$60,000 to $74,999
- 2,383$75,000 to $99,999
- 1,954$100,000 to $124,999
- 1,890$125,000 to $149,999
- 2,536$150,000 to $199,999
- 1,961$200,000 or more
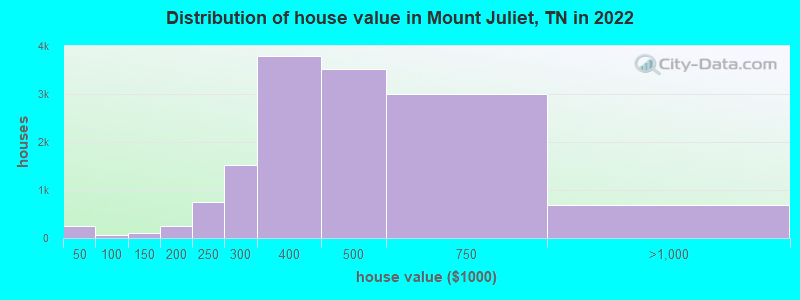
Home value of owner - occupied houses in 2022 in Mount Juliet, TN
-
- 119Less than $10,000
- 38$10,000 to $14,999
- 17$15,000 to $19,999
- 9$20,000 to $24,999
- 72$30,000 to $34,999
- 12$50,000 to $59,999
- 7$70,000 to $79,999
- 23$80,000 to $89,999
- 10$90,000 to $99,999
- 15$100,000 to $124,999
- 91$125,000 to $149,999
- 226$150,000 to $174,999
- 25$175,000 to $199,999
- 748$200,000 to $249,999
- 1,513$250,000 to $299,999
- 3,798$300,000 to $399,999
- 3,527$400,000 to $499,999
- 3,007$500,000 to $749,999
- 623$750,000 to $999,999
- 66$1,000,000 to $1,499,999
Rent paid by renters in 2022 in Mount Juliet, TN
-
- 7Less than $100
- 24$150 to $199
- 24$200 to $249
- 76$450 to $499
- 104$500 to $549
- 12$550 to $599
- 23$600 to $649
- 21$750 to $799
- 24$800 to $899
- 41$900 to $999
- 624$1,000 to $1,249
- 270$1,250 to $1,499
- 1,979$1,500 to $1,999
- 657$2,000 to $2,499
- 325$2,500 to $2,999
- 24$3,000 to $3,499
- 76No cash rent


Percentage of workers working in this county: 52.1%
Number of people working at home: 4,973 (23.7% of all workers)
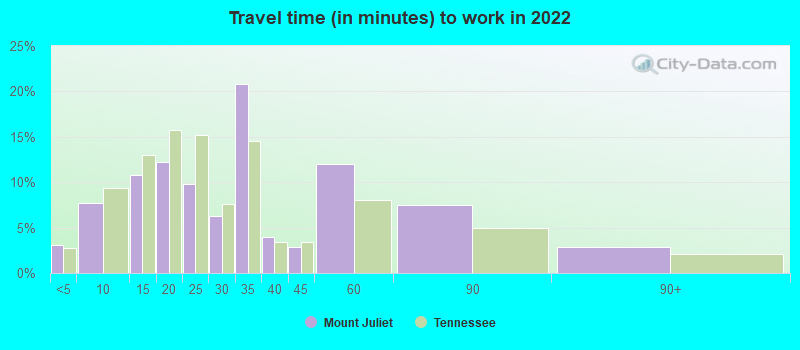
Travel time to work (commute)
- Less than 5 minutes: 257
- 5 to 9 minutes: 1,028
- 10 to 14 minutes: 1,229
- 15 to 19 minutes: 1,283
- 20 to 24 minutes: 1,931
- 25 to 29 minutes: 935
- 30 to 34 minutes: 4,468
- 35 to 39 minutes: 621
- 40 to 44 minutes: 976
- 45 to 59 minutes: 2,159
- 60 to 89 minutes: 1,407
- 90 or more minutes: 139
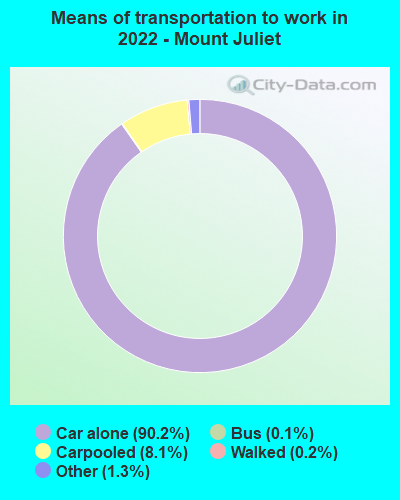
Means of transportation to work:
- Drove a car alone: 14,284 (70.6%)
- Carpooled: 1,365 (6.7%)
- Bus: 16 (0.1%)
- Taxi: 259 (1.3%)
- Walked: 28 (0.1%)
- Worked at home: 4,973 (24.6%)

- Unemployment by race in 2022
- Unemployment rate for White non-Hispanic residents
- 1.0%Males
- 3.3%Females
- Unemployment rate for Black residents
- 6.9%Females
- Unemployment rate for Asian residents
- 20.3%Males
- Unemployment rate for other race residents
- 18.8%Males
- 11.4%Females
- Unemployment rate for two or more race residents
- 5.7%Males
- Unemployment rate for Hispanic or Latino residents
- 5.1%Males
- 4.3%Females

- Year of entry for the foreign-born population in Mount Juliet, Tennessee
- 2,2112010 or later
- 1,5302000 to 2009
- 3291990 to 1999
- 991980 to 1989
- 221970 to 1979
- 58Before 1970

First ancestries reported:
- American: 3,161 (15.3%)
- English: 2,668 (12.9%)
- Irish: 1,675 (8.1%)
- German: 1,526 (7.4%)
- French: 738 (3.6%)
- European: 667 (3.2%)
- Egyptian: 639 (3.1%)
- Italian: 557 (2.7%)
- Scottish: 255 (1.2%)
- Russian: 219 (1.1%)
- Dutch: 201 (1.0%)
- Scotch-Irish: 193 (0.9%)
- Haitian: 190 (0.9%)
- Polish: 165 (0.8%)
- Greek: 160 (0.8%)
- Turkish: 94 (0.5%)
- Czech: 84 (0.4%)
- Jamaican: 82 (0.4%)
- Norwegian: 79 (0.4%)
- Ukrainian: 65 (0.3%)
- Northern European: 54 (0.3%)
- Swedish: 51 (0.2%)
- Danish: 48 (0.2%)
- French Canadian: 48 (0.2%)
- Portuguese: 43 (0.2%)
- Hungarian: 34 (0.2%)
- African: 34 (0.2%)
- Arab: 33 (0.2%)
- British: 32 (0.2%)
- Eastern European: 31 (0.2%)
- Canadian: 29 (0.1%)
- Scandinavian: 25 (0.1%)
- Swiss: 21 (0.1%)
- Nigerian: 18 (0.09%)
- Brazilian: 17 (0.08%)
- Slovak: 14 (0.07%)
- Icelander: 11 (0.05%)
- Lithuanian: 11 (0.05%)
- Welsh: 8 (0.04%)
Most common places of birth for foreign-born residents (%):
| Mount Juliet: | 14.9% (641) |
| Tennessee: | 3.1% (11,761) |
| Mount Juliet: | 14.8% (639) |
| Tennessee: | 6.1% (23,079) |
| Mount Juliet: | 11.2% (482) |
| Tennessee: | 23.0% (86,435) |
| Mount Juliet: | 7.0% (302) |
| Tennessee: | 0.4% (1,671) |
| Mount Juliet: | 5.2% (225) |
| Tennessee: | 1.0% (3,879) |
| Mount Juliet: | 4.9% (213) |
| Tennessee: | 2.7% (10,295) |
| Mount Juliet: | 3.4% (146) |
| Tennessee: | 3.1% (11,640) |
| Mount Juliet: | 3.2% (136) |
| Tennessee: | 5.7% (21,286) |
| Mount Juliet: | 2.7% (118) |
| Tennessee: | 0.4% (1,598) |
| Mount Juliet: | 2.3% (99) |
| Tennessee: | 0.2% (793) |
| Mount Juliet: | 1.8% (78) |
| Tennessee: | 2.3% (8,490) |
| Mount Juliet: | 1.8% (76) |
| Tennessee: | 0.6% (2,405) |
| Mount Juliet: | 1.7% (72) |
| Tennessee: | 1.2% (4,587) |
| Mount Juliet: | 1.6% (69) |
| Tennessee: | 0.0% (139) |
| Mount Juliet: | 1.6% (68) |
| Tennessee: | 0.3% (1,027) |
| Mount Juliet: | 1.6% (67) |
| Tennessee: | 2.4% (8,894) |
| Mount Juliet: | 1.5% (65) |
| Tennessee: | 1.2% (4,662) |
Place of birth for U.S.-born residents:
- This state: 17,015
- Other state: 20,767
- Northeast: 1,586
- Midwest: 6,291
- South: 8,161
- West: 4,838
87.9% of Mount Juliet residents lived in the same house 1 years ago.
Out of people who lived in different houses, 19.5% lived in this county.
Out of people who lived in different counties, 42.7% lived in Tennessee.
| Mount Juliet: | 87.9% |
| State average: | 87.0% |
Education attainment for males 25 years and older:
- No schooling: 201
- Nursery to 4th grade: 0
- 5th and 6th grade: 11
- 7th and 8th grade: 45
- 9th grade: 28
- 10th grade: 12
- 11th grade: 71
- 12th grade, no diploma: 213
- High school graduate (or equivalency): 2,910
- Less than 1 year of college: 469
- Some college more than 1 year, no degree: 1,524
- Associate degree: 1,362
- Bachelor's degree: 4,624
- Master's degree: 1,725
- Professional school degree: 177
- Doctorate degree: 323

Education attainment for females 25 years and older:
- No schooling: 57
- Nursery to 4th grade: 0
- 5th and 6th grade: 137
- 7th and 8th grade: 67
- 9th grade: 11
- 10th grade: 73
- 11th grade: 27
- 12th grade, no diploma: 83
- High school graduate (or equivalency): 2,755
- Less than 1 year of college: 1,200
- Some college more than 1 year, no degree: 2,186
- Associate degree: 1,628
- Bachelor's degree: 4,294
- Master's degree: 1,484
- Professional school degree: 136
- Doctorate degree: 375


Housing units in structures:
- One, detached: 12,711
- One, attached: 1,035
- Two: 212
- 3 or 4: 54
- 5 to 9: 354
- 10 to 19: 696
- 20 to 49: 816
- 50 or more: 536
- Mobile homes: 372
Housing units lacking complete kitchen facilities in 2022: 0.7%
House/condo owner moved in on average 7 years ago
Renter moved in on average 3 years ago

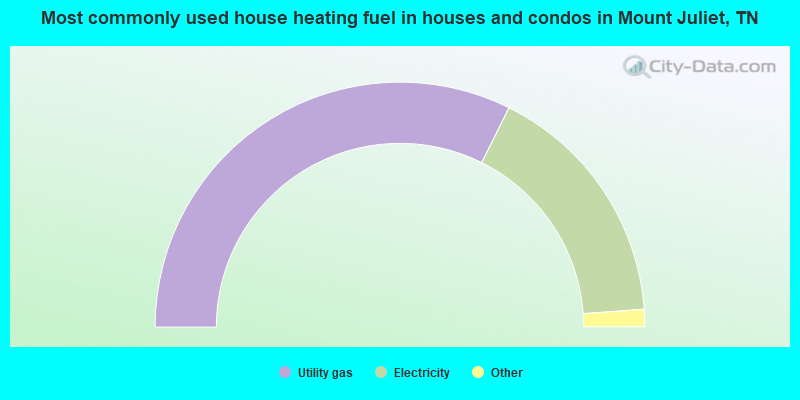
- 64.7%Utility gas
- 33.0%Electricity
- 1.9%Bottled, tank, or LP gas
- 0.3%No fuel used
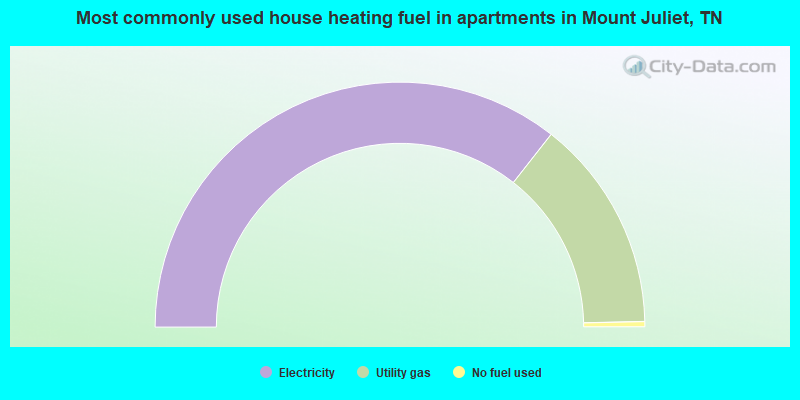
- 71.2%Electricity
- 28.1%Utility gas
- 0.7%No fuel used
Private vs. public school enrollment:
| Here: | 8.6% |
| Tennessee: | 15.0% |
| Here: | 9.9% |
| Tennessee: | 16.2% |
| Here: | 28.2% |
| Tennessee: | 23.5% |


