North Bend, OR (Oregon) Houses and Residents
| North Bend: | $316,992 |
| Oregon: | $475,600 |
Total population: 9,543 (All urban)
Houses: 4,915 (4,400 occupied: 2,613 owner occupied, 1,806 renter occupied)
| % of renters here: | 41% |
| State: | 37% |
Housing density: 1,259 houses/condos per square mile
Median price asked for vacant for-sale houses and condos in 2022: $314,304.
Median contract rent in 2022: $862 (lower quartile is $652, upper quartile is $995)
Median rent asked for vacant for-rent units in 2022: $2,198
Median gross rent in North Bend, OR in 2022: $943
Housing units in North Bend with a mortgage: 1,830 (119 second mortgage, 0 home equity loan, 88 both second mortgage and home equity loan)
Houses without a mortgage: 63
Median household income for houses/condos with a mortgage: $108,528
Median household income for apartments without a mortgage: $87,018
Median monthly housing costs: $1,084
Compare current foreclosures near North Bend, OR:
| Photo | Address | Area | Beds / Baths | Price | Details |
|---|---|---|---|---|---|

|
#1
Wildwood Rd
North Bend, OR 97459
|
- sq. feet
|
1 baths 2 beds |
show details | |

|
#2
Maple St
North Bend, OR 97459
|
1,152 sq. feet
|
1 baths 4 beds |
show details | |

|
#3
Mcpherson St
North Bend, OR 97459
|
704 sq. feet
|
1 baths 2 beds |
show details | |

|
#4
Clark St
North Bend, OR 97459
|
1,680 sq. feet
|
2 baths 4 beds |
show details | |

|
#5
Sheridan Ave
North Bend, OR 97459
|
1,810 sq. feet
|
1 baths 3 beds |
show details | |

|
#6
Carlson Heights Ln
North Bend, OR 97459
|
2,330 sq. feet
|
3 baths 2 beds |
show details | |

|
#7
Pacific St
North Bend, OR 97459
|
2,480 sq. feet
|
2 baths 3 beds |
show details | |

|
#8
Hayes St
North Bend, OR 97459
|
864 sq. feet
|
1 baths 2 beds |
show details | |

|
#9
Brussells St
North Bend, OR 97459
|
2,548 sq. feet
|
2 baths 3 beds |
show details | |

|
#10
Alder Ridge Dr
North Bend, OR 97459
|
5,027 sq. feet
|
3 baths 3 beds |
show details |
| Photo | Address | Area | Beds / Baths | Price | Details |
|---|---|---|---|---|---|

|
#11
Pine St
North Bend, OR 97459
|
1,296 sq. feet
|
2 baths 3 beds |
show details | |

|
#12
Hamilton St Rm 317
North Bend, OR 97459
|
- sq. feet
|
- baths - beds |
show details | |

|
#13
17th St
North Bend, OR 97459
|
- sq. feet
|
- baths - beds |
show details | |

|
#14
Maine St
North Bend, OR 97459
|
- sq. feet
|
- baths - beds |
show details | |

|
#15
Tower St
North Bend, OR 97459
|
- sq. feet
|
- baths - beds |
show details | |

|
#16
Sheridan Ave # 27
North Bend, OR 97459
|
- sq. feet
|
- baths - beds |
show details | |

|
#17
14th St
North Bend, OR 97459
|
- sq. feet
|
- baths - beds |
show details | |

|
#18
Newmark St
North Bend, OR 97459
|
- sq. feet
|
- baths - beds |
show details | |

|
#19
Broadway Ave
North Bend, OR 97459
|
- sq. feet
|
- baths - beds |
show details | |

|
#20
Highway St
North Bend, OR 97459
|
- sq. feet
|
- baths - beds |
show details |
| Photo | Address | Area | Beds / Baths | Price | Details |
|---|---|---|---|---|---|

|
#21
Monroe St
North Bend, OR 97459
|
- sq. feet
|
- baths - beds |
show details | |

|
#22
E Bay Rd Apt 2a
North Bend, OR 97459
|
- sq. feet
|
- baths - beds |
show details | |

|
#23
N Bay Rd
North Bend, OR 97459
|
- sq. feet
|
- baths - beds |
show details | |

|
#24
N Fir St
Coquille, OR 97423
|
- sq. feet
|
1 baths 2 beds |
$124,800
|
show details |

|
#25
Stillwater Dr
Coos Bay, OR 97420
|
1,586 sq. feet
|
2 baths 3 beds |
show details | |

|
#26
11th Ave
Coos Bay, OR 97420
|
1,830 sq. feet
|
2 baths 3 beds |
show details | |

|
#27
Libby Ln
Coos Bay, OR 97420
|
1,244 sq. feet
|
1 baths 2 beds |
show details | |

|
#28
N 8th St
Coos Bay, OR 97420
|
2,432 sq. feet
|
2 baths 4 beds |
show details | |

|
#29
Cape Arago Hwy
Coos Bay, OR 97420
|
1,000 sq. feet
|
1 baths 4 beds |
show details | |

|
#30
Oregon Ave
Coos Bay, OR 97420
|
960 sq. feet
|
1 baths 3 beds |
show details |
| Photo | Address | Area | Beds / Baths | Price | Details |
|---|---|---|---|---|---|

|
#31
S Barview Rd
Coos Bay, OR 97420
|
1,208 sq. feet
|
1 baths 3 beds |
show details | |

|
#32
9th Ave
Coos Bay, OR 97420
|
1,509 sq. feet
|
2 baths 3 beds |
show details | |

|
#33
Washington Ave
Coos Bay, OR 97420
|
1,143 sq. feet
|
1 baths 2 beds |
show details | |

|
#34
Minnesota Ave
Coos Bay, OR 97420
|
2,032 sq. feet
|
1 baths 4 beds |
show details | |

|
#35
Minnesota Ave
Coos Bay, OR 97420
|
1,272 sq. feet
|
1 baths 3 beds |
show details | |

|
#36
Sanddollar Ln
Coos Bay, OR 97420
|
1,473 sq. feet
|
2 baths 4 beds |
show details | |

|
#37
N 8th St
Lakeside, OR 97449
|
1,638 sq. feet
|
2 baths 3 beds |
show details | |

|
#38
Robinhood Ave
Lakeside, OR 97449
|
1,152 sq. feet
|
1 baths 3 beds |
show details | |

|
#39
N Wasson St
Coos Bay, OR 97420
|
1,040 sq. feet
|
1 baths 3 beds |
show details | |

|
#40
N 8th St
Lakeside, OR 97449
|
1,200 sq. feet
|
1 baths 3 beds |
show details |
| Photo | Address | Area | Beds / Baths | Price | Details |
|---|---|---|---|---|---|

|
#41
E 11th St
Coquille, OR 97423
|
720 sq. feet
|
1 baths 3 beds |
show details | |

|
#42
Pacific Ave
Coos Bay, OR 97420
|
720 sq. feet
|
1 baths 2 beds |
show details | |

|
#43
N 10th Ct
Coos Bay, OR 97420
|
2,466 sq. feet
|
1 baths 3 beds |
show details | |

|
#44
W 8th St
Coquille, OR 97423
|
1,395 sq. feet
|
1 baths 3 beds |
show details | |

|
#45
Lakeshore Dr
Coos Bay, OR 97420
|
1,724 sq. feet
|
2 baths 3 beds |
show details | |

|
#46
N Marple St
Coos Bay, OR 97420
|
1,651 sq. feet
|
2 baths 4 beds |
show details | |

|
#47
Noble Ave
Coos Bay, OR 97420
|
650 sq. feet
|
1 baths 2 beds |
show details | |

|
#48
N Wasson St
Coos Bay, OR 97420
|
1,072 sq. feet
|
1 baths 2 beds |
show details | |

|
#49
Dunn St
Coos Bay, OR 97420
|
1,388 sq. feet
|
2 baths 3 beds |
show details | |

|
Check over 1 million property listings on Foreclosure.com!
|
browse all offers | |||


 | Coos Bay/ North Bend, Oregon living. (90 replies) |
| Apartments in the Coos Bay/North Bend area (24 replies) |
| "For Sale" homes unsold...for a while. Why? (24 replies) |
| Relocating and looking to HOMESTEAD (15 replies) |
| North Bend/Coos Bay, need a realtor (5 replies) |
| Best route into North Bend (7 replies) |

Median year apartment built: 1965
Household type by relationship:
Households: 10,276- Male householders: 2,152 (453 living alone), Female householders: 2,162 (665 living alone)
2,163 spouses (2,163 opposite-sex spouses), 490 unmarried partners, (477 opposite-sex unmarried partners), 2,273 children (2,041 natural, 47 adopted, 185 stepchildren), 274 grandchildren, 33 brothers or sisters, 140 parents, 8 foster children, 97 other relatives, 315 non-relatives
- In group quarters: 164
Size of family households: 1,574 2-persons, 564 3-persons, 417 4-persons, 223 5-persons, 16 6-persons, 24 7-or-more-persons.
Size of nonfamily households: 1,198 1-person, 315 2-persons, 16 3-persons, 16 4-persons, 12 5-persons, 54 6-persons, 6 7-or-more-persons.
1,109 married couples with children.
537 single-parent households (45 men, 492 women).
92.3% of residents of North Bend speak English at home.
1.2% of residents speak Spanish at home (67% speak English very well, 25% speak English well, 8% speak English not well, 1% don't speak English at all).
2.7% of residents speak other Indo-European language at home (64% speak English very well, 17% speak English well, 19% speak English not well).
3.4% of residents speak Asian or Pacific Island language at home (12% speak English very well, 35% speak English well, 37% speak English not well, 16% don't speak English at all).
Foreign born population: 720 (7.0%)
(49.7% of them are naturalized citizens)
| Here: | 5.9 |
| State: | 6.2 |
| Here: | 4.0 |
| State: | 4.0 |

- Bedrooms in owner-occupied houses and condos in North Bend, Oregon
- 0no bedroom
- 1231 bedroom
- 4632 bedrooms
- 1,4713 bedrooms
- 4574 bedrooms
- 1005+ bedrooms
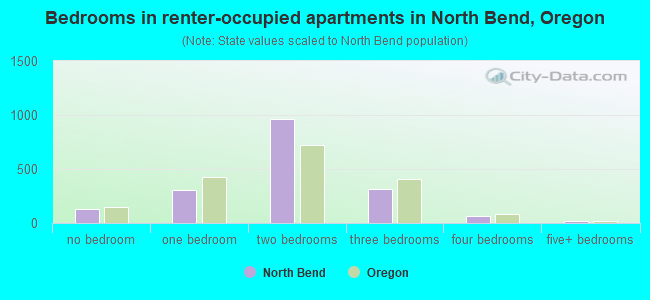
- Bedrooms in renter-occupied apartments in North Bend, Oregon
- 134no bedroom
- 3101 bedroom
- 9622 bedrooms
- 3183 bedrooms
- 614 bedrooms
- 225+ bedrooms

- Cars and other vehicles available in North Bend in owner-occupied houses/condos
- 63no vehicle
- 3801 vehicle
- 1,3822 vehicles
- 4223 vehicles
- 2954 vehicles
- 725+ vehicles

- Cars and other vehicles available in North Bend in renter-occupied apartments
- 308no vehicle
- 9471 vehicle
- 4122 vehicles
- 963 vehicles
- 444 vehicles
- 05+ vehicles

- Rooms in owner-occupied houses in North Bend, Oregon
- 01 room
- 02 rooms
- 1133 rooms
- 5244 rooms
- 4345 rooms
- 5846 rooms
- 4647 rooms
- 1328 rooms
- 3629+ rooms

- Rooms in renter-occupied apartments in North Bend, Oregon
- 441 room
- 2412 rooms
- 2373 rooms
- 6394 rooms
- 3575 rooms
- 1486 rooms
- 977 rooms
- 128 rooms
- 319+ rooms


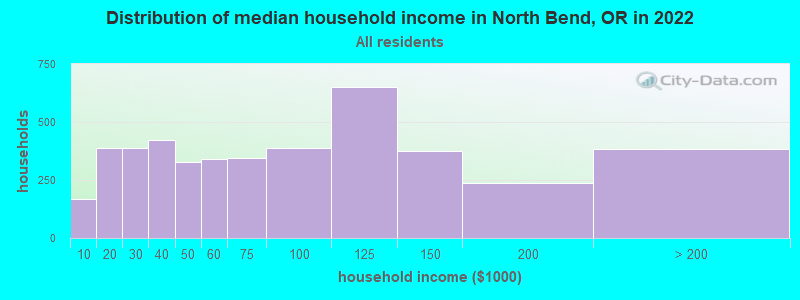
North Bend, OR household income distribution

- 170Less than $10,000
- 386$10,000 to $19,999
- 390$20,000 to $29,999
- 423$30,000 to $39,999
- 329$40,000 to $49,999
- 341$50,000 to $59,999
- 343$60,000 to $74,999
- 387$75,000 to $99,999
- 652$100,000 to $124,999
- 376$125,000 to $149,999
- 238$150,000 to $199,999
- 382$200,000 or more
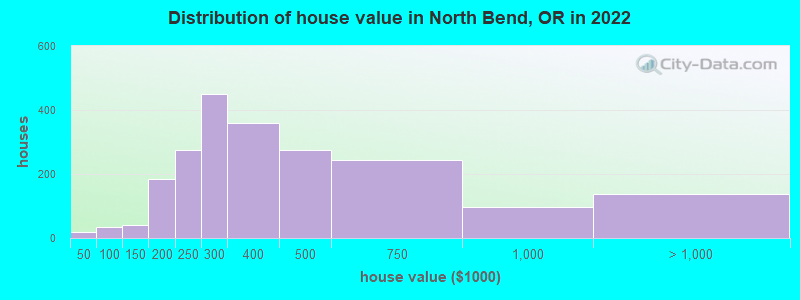
Home value of owner - occupied houses in 2022 in North Bend, OR
-
- 10Less than $10,000
- 7$25,000 to $29,999
- 34$90,000 to $99,999
- 15$100,000 to $124,999
- 25$125,000 to $149,999
- 123$150,000 to $174,999
- 60$175,000 to $199,999
- 274$200,000 to $249,999
- 451$250,000 to $299,999
- 359$300,000 to $399,999
- 275$400,000 to $499,999
- 244$500,000 to $749,999
- 97$750,000 to $999,999
- 13$1,000,000 to $1,499,999
- 116$1,500,000 to $1,999,999
- 6$2,000,000 or more
Rent paid by renters in 2022 in North Bend, OR
-
- 1$100 to $149
- 52$150 to $199
- 0$200 to $249
- 49$250 to $299
- 43$300 to $349
- 31$350 to $399
- 0$400 to $449
- 3$450 to $499
- 134$500 to $549
- 2$550 to $599
- 150$600 to $649
- 51$700 to $749
- 124$750 to $799
- 406$800 to $899
- 264$900 to $999
- 285$1,000 to $1,249
- 18$1,250 to $1,499
- 75$1,500 to $1,999
- 22$2,000 to $2,499
- 12$3,000 to $3,499
- 75No cash rent

Percentage of workers working in this county: 88.5%
Number of people working at home: 218 (4.5% of all workers)
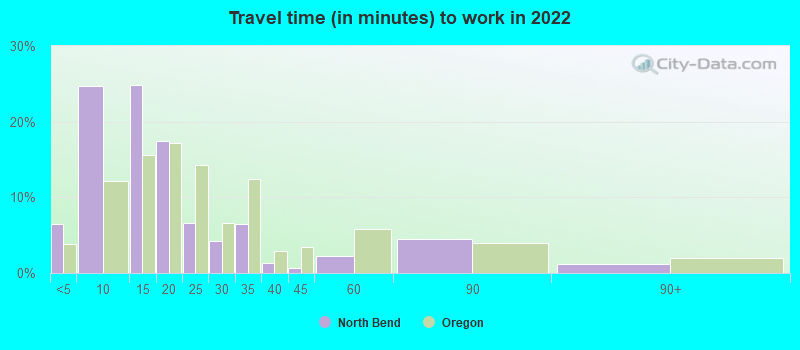
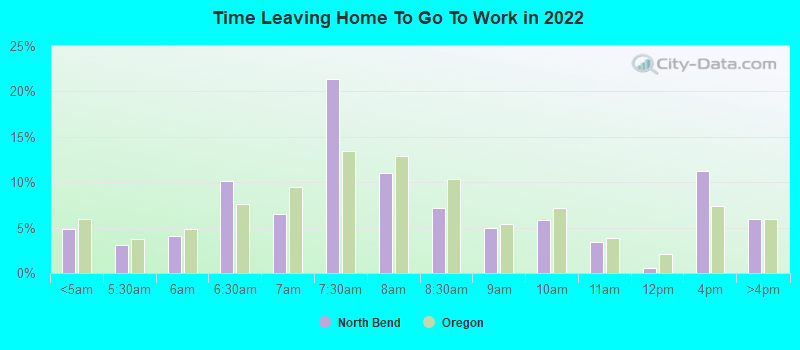
Travel time to work (commute)
- Less than 5 minutes: 488
- 5 to 9 minutes: 1,037
- 10 to 14 minutes: 903
- 15 to 19 minutes: 1,002
- 20 to 24 minutes: 321
- 25 to 29 minutes: 48
- 30 to 34 minutes: 249
- 35 to 39 minutes: 27
- 40 to 44 minutes: 143
- 45 to 59 minutes: 73
- 60 to 89 minutes: 145
- 90 or more minutes: 47
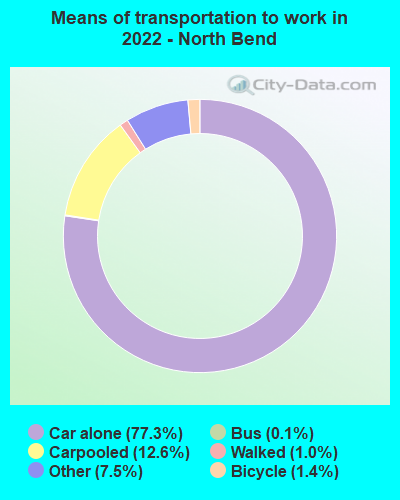
Means of transportation to work:
- Drove a car alone: 3,546 (71.5%)
- Carpooled: 588 (11.9%)
- Bus: 3 (0.1%)
- Taxi: 387 (7.8%)
- Bicycle: 52 (1.0%)
- Walked: 53 (1.1%)
- Worked at home: 218 (4.4%)
- Unemployment by race in 2022
- Unemployment rate for White non-Hispanic residents
- 7.7%Males
- 7.0%Females
- Unemployment rate for American Indian and Alaska Native residents
- 2.7%Males
- Unemployment rate for Hispanic or Latino residents
- 6.8%Males

- Year of entry for the foreign-born population in North Bend, Oregon
- 2732010 or later
- 1222000 to 2009
- 261990 to 1999
- 241980 to 1989
- 471970 to 1979
- 124Before 1970

First ancestries reported:
- European: 623 (15.6%)
- American: 509 (12.8%)
- German: 495 (12.4%)
- English: 292 (7.3%)
- Irish: 262 (6.6%)
- Norwegian: 99 (2.5%)
- Polish: 82 (2.1%)
- Scottish: 75 (1.9%)
- French: 55 (1.4%)
- Dutch: 43 (1.1%)
- Russian: 30 (0.8%)
- Armenian: 27 (0.7%)
- Northern European: 25 (0.6%)
- Swedish: 23 (0.6%)
- British: 22 (0.6%)
- Lithuanian: 18 (0.5%)
- Portuguese: 17 (0.4%)
- Scotch-Irish: 14 (0.4%)
- Finnish: 9 (0.2%)
- Bulgarian: 8 (0.2%)
- Danish: 8 (0.2%)
- Canadian: 7 (0.2%)
- Czech: 7 (0.2%)
- Ukrainian: 7 (0.2%)
- Italian: 4 (0.1%)
Most common places of birth for foreign-born residents (%):
| North Bend: | 21.2% (153) |
| Oregon: | 5.2% (21,429) |
| North Bend: | 18.3% (132) |
| Oregon: | 3.7% (15,229) |
| North Bend: | 10.8% (78) |
| Oregon: | 3.5% (14,530) |
| North Bend: | 9.0% (65) |
| Oregon: | 0.4% (1,762) |
| North Bend: | 8.3% (60) |
| Oregon: | 0.1% (599) |
| North Bend: | 6.0% (43) |
| Oregon: | 0.2% (972) |
| North Bend: | 5.6% (40) |
| Oregon: | 0.4% (1,614) |
| North Bend: | 3.6% (26) |
| Oregon: | 33.9% (140,109) |
| North Bend: | 3.2% (23) |
| Oregon: | 0.1% (498) |
| North Bend: | 2.5% (18) |
| Oregon: | 1.7% (7,103) |
| North Bend: | 1.9% (14) |
| Oregon: | 0.5% (2,247) |
Place of birth for U.S.-born residents:
- This state: 4,182
- Other state: 5,317
- Northeast: 351
- Midwest: 1,333
- South: 726
- West: 2,893
80.1% of North Bend residents lived in the same house 1 years ago.
Out of people who lived in different houses, 27.9% lived in this county.
Out of people who lived in different counties, 50.6% lived in Oregon.
| North Bend: | 80.1% |
| State average: | 85.5% |
Education attainment for males 25 years and older:
- No schooling: 51
- Nursery to 4th grade: 0
- 5th and 6th grade: 0
- 7th and 8th grade: 10
- 9th grade: 70
- 10th grade: 21
- 11th grade: 72
- 12th grade, no diploma: 118
- High school graduate (or equivalency): 1,130
- Less than 1 year of college: 304
- Some college more than 1 year, no degree: 557
- Associate degree: 363
- Bachelor's degree: 617
- Master's degree: 219
- Professional school degree: 59
- Doctorate degree: 95

Education attainment for females 25 years and older:
- No schooling: 113
- Nursery to 4th grade: 0
- 5th and 6th grade: 3
- 7th and 8th grade: 53
- 9th grade: 35
- 10th grade: 14
- 11th grade: 28
- 12th grade, no diploma: 94
- High school graduate (or equivalency): 975
- Less than 1 year of college: 415
- Some college more than 1 year, no degree: 714
- Associate degree: 356
- Bachelor's degree: 847
- Master's degree: 225
- Professional school degree: 94
- Doctorate degree: 32


Housing units in structures:
- One, detached: 3,445
- One, attached: 111
- Two: 277
- 3 or 4: 210
- 5 to 9: 325
- 10 to 19: 99
- 20 to 49: 145
- 50 or more: 281
- Mobile homes: 20
Housing units lacking complete kitchen facilities in 2022: 2.2%
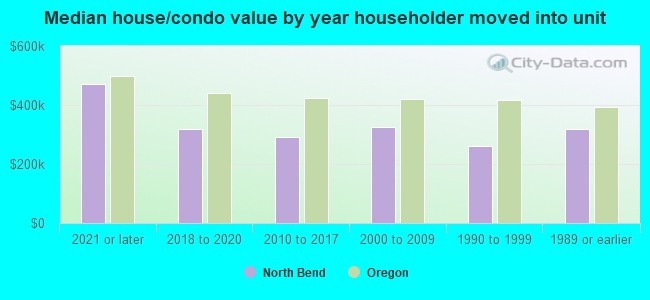
House/condo owner moved in on average 10 years ago
Renter moved in on average 4 years ago

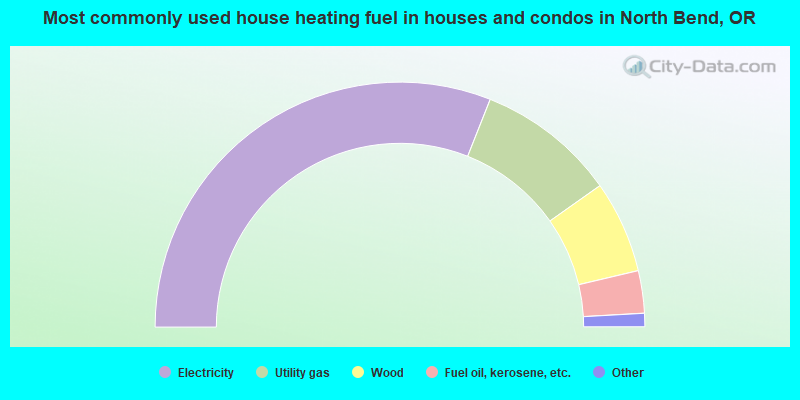
- 62.1%Electricity
- 18.4%Utility gas
- 12.2%Wood
- 5.6%Fuel oil, kerosene, etc.
- 1.4%Bottled, tank, or LP gas
- 0.3%Other fuel
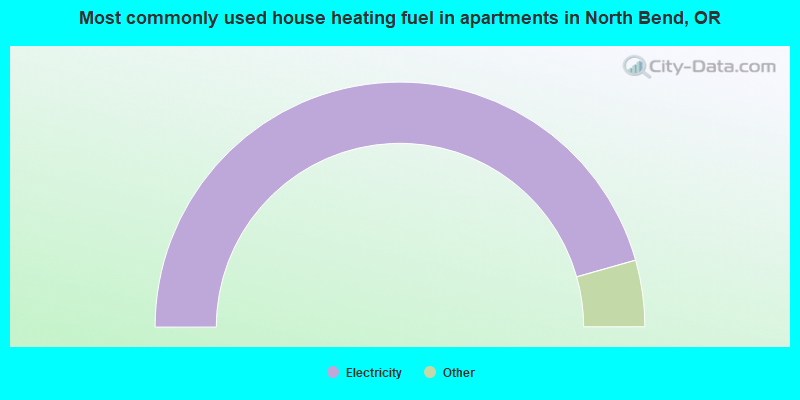
- 91.2%Electricity
- 3.7%Utility gas
- 2.5%Wood
- 1.4%No fuel used
- 0.6%Bottled, tank, or LP gas
- 0.6%Fuel oil, kerosene, etc.
Private vs. public school enrollment:
| Here: | 9.0% |
| Oregon: | 13.7% |
| Here: | 14.0% |
| Oregon: | 8.8% |
| Here: | 3.6% |
| Oregon: | 17.7% |


