West Concord, MA (Massachusetts) Houses and Residents
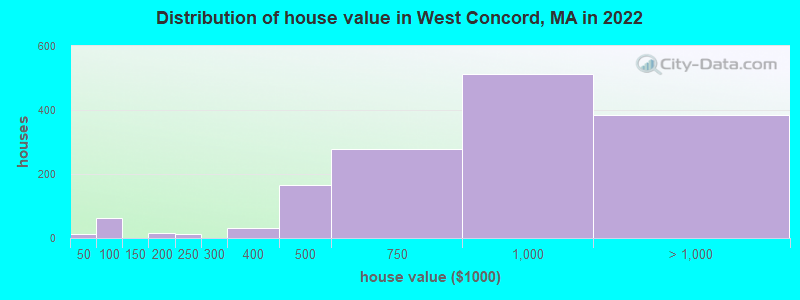
Estimated median house or condo value in 2022: $856,030 (it was $351,600 in 2000 )
West Concord:
$856,030Massachusetts:
$534,700
Lower value quartile - upper value quartile: $572,261 - $1,043,763Mean price in 2022: Detached houses: $1,020,397 Here:
$1,020,397State:
$651,570
Townhouses or other attached units: $935,940 Here:
$935,940State:
$617,749
In 2-unit structures: $882,843 Here:
$882,843State:
$594,808
In 3-to-4-unit structures: $593,032 Here:
$593,032State:
$601,912
In 5-or-more-unit structures: $493,566 Here:
$493,566State:
$555,768
Total population: 6,028 (Urban population: 5,642, Rural population: 0)
Houses: 2,732 (2,454 occupied: 1,405 owner occupied, 1,046 renter occupied )
% of renters here:
43%State:
38%
Housing density: 801 houses/condos per square mile
Median price asked for vacant for-sale houses and condos in 2022 in this county: $1,068,910.
Median contract rent in 2022: over $2,000 (lower quartile is over $2,000, upper quartile is over $2,000)
Median gross rent in West Concord, MA in 2022: over $2,000
Housing units in West Concord with a mortgage: 784 (172 second mortgage, 0 home equity loan, 152 both second mortgage and home equity loan )Houses without a mortgage: 64
Median household income for houses/condos with a mortgage: $232,286
Median household income for apartments without a mortgage: $143,084
Median monthly housing costs: $2,374
Data:
Median house or condo value ($)
Median house or condo value ($ change since 2000)
Median house or condo value ($) - White
Median house or condo value ($) - Black or African American
Median house or condo value ($) - Asian
Median house or condo value ($) - Hispanic or Latino
Median house or condo value ($) - American Indian and Alaska Native
Median house or condo value ($) - Multirace
Median house or condo value ($) - Other Race
Median price asked for mobile homes ($)
Household density (households per square mile)
Mean house or condo value by units in structure - 1, detached ($)
Mean house or condo value by units in structure - 1, attached ($)
Mean house or condo value by units in structure - 2 ($)
Mean house or condo value by units in structure by units in structure - 3 or 4 ($)
Mean house or condo value by units in structure - 5 or more ($)
Mean house or condo value by units in structure - Boat, RV, van, etc. ($)
Mean house or condo value by units in structure - Mobile home ($)
Median contract rent ($)
Median contract rent - Lower quartile ($)
Median contract rent - Upper quartile ($)
Median gross rent ($)
Urban houses (%)
Rural houses (%)
Houses occupied (%)
Houses occupied (% change since 2000)
Houses owner occupied (%)
Houses owner occupied (% change since 2000)
Houses renter occupied (%)
Houses renter occupied (% change since 2000)
Vacant housing units - For rent (%)
Vacant housing units - For rent (% change since 2000)
Vacant housing units - For sale only (%)
Vacant housing units - For sale only (% change since 2000)
Vacant housing units - Rented or sold, not occupied (%)
Vacant housing units - Rented or sold, not occupied (% change since 2000)
Vacant housing units - For seasonal, recreational, or occasional use (%)
Vacant housing units - For seasonal, recreational, or occasional use (% change since 2000)
Vacant housing units - For migrant workers (%)
Vacant housing units - For migrant workers (% change since 2000)
Vacant housing units - Other vacant (%)
Vacant housing units - Other vacant (% change since 2000)
Median monthly housing costs ($)
Median household income for houses/condos with a mortgage ($)
Median household income for houses/condos without a mortgage ($)
Median household income ($)
Median household income ($) - White
Median household income ($) - Black or African American
Median household income ($) - Asian
Median household income ($) - Hispanic or Latino
Median household income ($) - American Indian and Alaska Native
Median household income ($) - Multirace
Median household income ($) - Other Race
Mortgage status - with mortgage (%)
Mortgage status - with second mortgage (%)
Mortgage status - with home equity loan (%)
Mortgage status - with both second mortgage and home equity loan (%)
Mortgage status - without a mortgage (%)
Median year house/condo built
Median year apartment built
Household type by relationship - Male householder living alone (%)
Household type by relationship - Male householder not living alone (%)
Household type by relationship - Female householder living alone (%)
Household type by relationship - Female householder not living alone (%)
Household type by relationship - Opposite-Sex spouse (%)
Household type by relationship - Same-Sex spouse (%)
Household type by relationship - Opposite-Sex unmarried partner (%)
Household type by relationship - Same-Sex unmarried partner (%)
Household type by relationship - In group quarters (%)
Size of family households - 2-person household (%)
Size of family households - 3-person household (%)
Size of family households - 4-person household (%)
Size of family households - 5-person household (%)
Size of family households - 6-person household (%)
Size of family households - 7-or-more-person household (%)
Size of nonfamily households - 1-person household (%)
Size of nonfamily households - 2-person household (%)
Size of nonfamily households - 3-person household (%)
Size of nonfamily households - 4-person household (%)
Size of nonfamily households - 5-person household (%)
Size of nonfamily households - 6-person household (%)
Size of nonfamily households - 7-or-moreperson household (%)
Year house built - Built 2010 or later (%)
Year house built - Built 2000 to 2009 (%)
Year house built - Built 1990 to 1999 (%)
Year house built - Built 1980 to 1989 (%)
Year house built - Built 1970 to 1979 (%)
Year house built - Built 1960 to 1969 (%)
Year house built - Built 1950 to 1959 (%)
Year house built - Built 1940 to 1949 (%)
Year house built - Built 1939 or earlier (%)
Median number of rooms in houses and condos
Median number of rooms in apartments
Median number of bedrooms in owner occupied houses
Mean number of bedrooms in owner occupied houses
Median number of bedrooms in renter occupied houses
Mean number of bedrooms in renter occupied houses
Median number of vehichles in owner occupied houses
Mean number of vehichles in owner occupied houses
Median number of vehichles in renter occupied houses
Mean number of vehichles in renter occupied houses
Rooms in owner-occupied houses - 1 room (%)
Rooms in owner-occupied houses - 2 rooms (%)
Rooms in owner-occupied houses - 3 rooms (%)
Rooms in owner-occupied houses - 4 rooms (%)
Rooms in owner-occupied houses - 5 rooms (%)
Rooms in owner-occupied houses - 6 rooms (%)
Rooms in owner-occupied houses - 7 rooms (%)
Rooms in owner-occupied houses - 8 rooms (%)
Rooms in owner-occupied houses - 9+ rooms (%)
Rooms in renter-occupied houses - 1 room (%)
Rooms in renter-occupied houses - 2 rooms (%)
Rooms in renter-occupied houses - 3 rooms (%)
Rooms in renter-occupied houses - 4 rooms (%)
Rooms in renter-occupied houses - 5 rooms (%)
Rooms in renter-occupied houses - 6 rooms (%)
Rooms in renter-occupied houses - 7 rooms (%)
Rooms in renter-occupied houses - 8 rooms (%)
Rooms in renter-occupied houses - 9+ rooms (%)
Bedrooms in owner-occupied houses - no bedrooms (%)
Bedrooms in owner-occupied houses - 1 bedroom (%)
Bedrooms in owner-occupied houses - 2 bedrooms (%)
Bedrooms in owner-occupied houses - 3 bedrooms (%)
Bedrooms in owner-occupied houses - 4 bedrooms (%)
Bedrooms in owner-occupied houses - 5+ bedrooms (%)
Bedrooms in renter-occupied houses - no bedrooms (%)
Bedrooms in renter-occupied houses - 1 bedroom (%)
Bedrooms in renter-occupied houses - 2 bedrooms (%)
Bedrooms in renter-occupied houses - 3 bedrooms (%)
Bedrooms in renter-occupied houses - 4 bedrooms (%)
Bedrooms in renter-occupied houses - 5+ bedrooms (%)
Vehicles available in owner-occupied houses - no vehicle available (%)
Vehicles available in owner-occupied houses - 1 vehicle available(%)
Vehicles available in owner-occupied houses - 2 Vehicles available (%)
Vehicles available in owner-occupied houses - 3 Vehicles available (%)
Vehicles available in owner-occupied houses - 4 Vehicles available (%)
Vehicles available in owner-occupied houses - 5+ Vehicles available (%)
Vehicles available in renter-occupied houses - no vehicle available (%)
Vehicles available in renter-occupied houses - 1 vehicle available (%)
Vehicles available in renter-occupied houses - 2 Vehicles available (%)
Vehicles available in renter-occupied houses - 3 Vehicles available (%)
Vehicles available in renter-occupied houses - 4 Vehicles available (%)
Vehicles available in renter-occupied houses - 5+ Vehicles available (%)
Housing units in structures - 1, detached (%)
Housing units in structures - 1, attached (%)
Housing units in structures - 2 (%)
Housing units in structures - 3 or 4 (%)
Housing units in structures - 5 to 9 (%)
Housing units in structures - 10 to 19 (%)
Housing units in structures - 20 to 49 (%)
Housing units in structures - 50 or more (%)
Housing units in structures - Mobile home (%)
Housing units in structures - Boat, RV, van, etc. (%)
Housing units in structures - Owners - 1, detached (%)
Housing units in structures - Owners - 1, attached (%)
Housing units in structures - Owners - 2 (%)
Housing units in structures - Owners - 3 or 4 (%)
Housing units in structures - Owners - 5 to 9 (%)
Housing units in structures - Owners - 10 to 19 (%)
Housing units in structures - Owners - 20 to 49 (%)
Housing units in structures - Owners - 50 or more (%)
Housing units in structures - Owners - Mobile home (%)
Housing units in structures - Owners - Boat, RV, van, etc. (%)
Housing units in structures - Renters - 1, detached (%)
Housing units in structures - Renters - 1, attached (%)
Housing units in structures - Renters - 2 (%)
Housing units in structures - Renters - 3 or 4 (%)
Housing units in structures - Renters - 5 to 9 (%)
Housing units in structures - Renters - 10 to 19 (%)
Housing units in structures - Renters - 20 to 49 (%)
Housing units in structures - Renters - 50 or more (%)
Housing units in structures - Renters - Mobile home (%)
Housing units in structures - Renters - Boat, RV, van, etc. (%)
House/condo owner moved in on average (years ago)
Renter moved in on average (years ago)
Year householder moved into unit - Moved in 1999 to March 2000 (%)
Year householder moved into unit - Moved in 1999 to March 2000 (%) - White
Year householder moved into unit - Moved in 1999 to March 2000 (%) - Black or African American
Year householder moved into unit - Moved in 1999 to March 2000 (%) - Asian
Year householder moved into unit - Moved in 1999 to March 2000 (%) - Hispanic or Latino
Year householder moved into unit - Moved in 1999 to March 2000 (%) - American Indian and Alaska Native
Year householder moved into unit - Moved in 1999 to March 2000 (%) - Multirace
Year householder moved into unit - Moved in 1999 to March 2000 (%) - Other Race
Year householder moved into unit - Moved in 1995 to 1998 (%)
Year householder moved into unit - Moved in 1995 to 1998 (%) - White
Year householder moved into unit - Moved in 1995 to 1998 (%) - Black or African American
Year householder moved into unit - Moved in 1995 to 1998 (%) - Asian
Year householder moved into unit - Moved in 1995 to 1998 (%) - Hispanic or Latino
Year householder moved into unit - Moved in 1995 to 1998 (%) - American Indian and Alaska Native
Year householder moved into unit - Moved in 1995 to 1998 (%) - Multirace
Year householder moved into unit - Moved in 1995 to 1998 (%) - Other Race
Year householder moved into unit - Moved in 1990 to 1994 (%)
Year householder moved into unit - Moved in 1990 to 1994 (%) - White
Year householder moved into unit - Moved in 1990 to 1994 (%) - Black or African American
Year householder moved into unit - Moved in 1990 to 1994 (%) - Asian
Year householder moved into unit - Moved in 1990 to 1994 (%) - Hispanic or Latino
Year householder moved into unit - Moved in 1990 to 1994 (%) - American Indian and Alaska Native
Year householder moved into unit - Moved in 1990 to 1994 (%) - Multirace
Year householder moved into unit - Moved in 1990 to 1994 (%) - Other Race
Year householder moved into unit - Moved in 1980 to 1989 (%)
Year householder moved into unit - Moved in 1980 to 1989 (%) - White
Year householder moved into unit - Moved in 1980 to 1989 (%) - Black or African American
Year householder moved into unit - Moved in 1980 to 1989 (%) - Asian
Year householder moved into unit - Moved in 1980 to 1989 (%) - Hispanic or Latino
Year householder moved into unit - Moved in 1980 to 1989 (%) - American Indian and Alaska Native
Year householder moved into unit - Moved in 1980 to 1989 (%) - Multirace
Year householder moved into unit - Moved in 1980 to 1989 (%) - Other Race
Year householder moved into unit - Moved in 1970 to 1979 (%)
Year householder moved into unit - Moved in 1970 to 1979 (%) - White
Year householder moved into unit - Moved in 1970 to 1979 (%) - Black or African American
Year householder moved into unit - Moved in 1970 to 1979 (%) - Asian
Year householder moved into unit - Moved in 1970 to 1979 (%) - Hispanic or Latino
Year householder moved into unit - Moved in 1970 to 1979 (%) - American Indian and Alaska Native
Year householder moved into unit - Moved in 1970 to 1979 (%) - Multirace
Year householder moved into unit - Moved in 1970 to 1979 (%) - Other Race
Year householder moved into unit - Moved in 1969 or earlier (%)
Year householder moved into unit - Moved in 1969 or earlier (%) - White
Year householder moved into unit - Moved in 1969 or earlier (%) - Black or African American
Year householder moved into unit - Moved in 1969 or earlier (%) - Asian
Year householder moved into unit - Moved in 1969 or earlier (%) - Hispanic or Latino
Year householder moved into unit - Moved in 1969 or earlier (%) - American Indian and Alaska Native
Year householder moved into unit - Moved in 1969 or earlier (%) - Multirace
Year householder moved into unit - Moved in 1969 or earlier (%) - Other Race
Housing units lacking complete plumbing facilities (%)
Housing units lacking complete kitchen facilities (%)
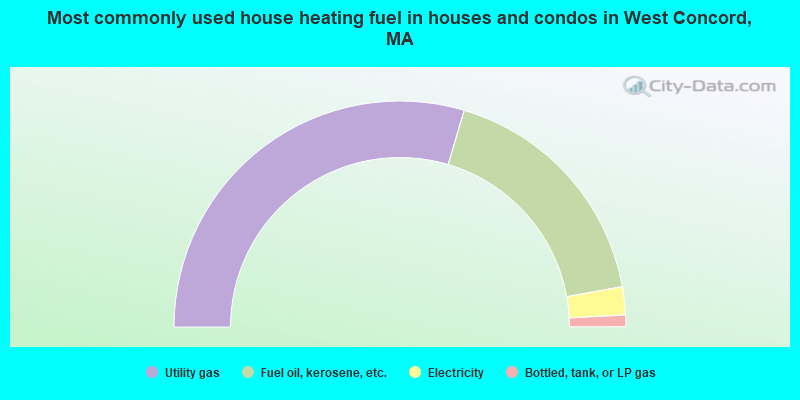
House heating fuel used in houses and condos - Utility gas (%)
House heating fuel used in houses and condos - Bottled, tank, or LP gas (%)
House heating fuel used in houses and condos - Electricity (%)
House heating fuel used in houses and condos - Fuel oil, kerosene, etc. (%)
House heating fuel used in houses and condos - Coal or coke (%)
House heating fuel used in houses and condos - Wood (%)
House heating fuel used in houses and condos - Solar energy (%)
House heating fuel used in houses and condos - Other fuel (%)
House heating fuel used in houses and condos - No fuel used (%)
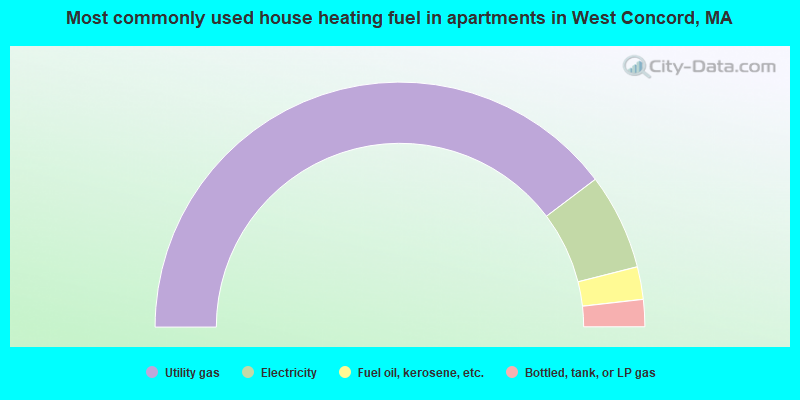
House heating fuel used in apartments - Utility gas (%)
House heating fuel used in apartments - Bottled, tank, or LP gas (%)
House heating fuel used in apartments - Electricity (%)
House heating fuel used in apartments - Fuel oil, kerosene, etc. (%)
House heating fuel used in apartments - Coal or coke (%)
House heating fuel used in apartments - Wood (%)
House heating fuel used in apartments - Solar energy (%)
House heating fuel used in apartments - Other fuel (%)
House heating fuel used in apartments - No fuel used (%)
Median year house/condo built: 1971Median year apartment built: 1981Household type by relationship:
Households: 6,426
Male householders: 1,252 (341 living alone ), Female householders: 1,158 (458 living alone )1,209 spouses (1,197 opposite-sex spouses ), 109 unmarried partners , (109 opposite-sex unmarried partners ), 1,704 children (1,616 natural , 68 adopted , 18 stepchildren ), 17 grandchildren , 0 brothers or sisters , 9 parents , 0 foster children , 52 other relatives , 138 non-relatives In group quarters: 772
Size of family households: 535 2-persons , 371 3-persons , 443 4-persons , 36 5-persons , 48 6-persons .
Size of nonfamily households: 833 1-person , 182 2-persons , 14 4-persons .
983 married couples with children. single-parent households (93 men , 142 women ).
80.9% of residents of West Concord speak English at home. of residents speak Spanish at home (83% speak English very well , 9% speak English well , 8% speak English not well ).of residents speak other Indo-European language at home (81% speak English very well , 4% speak English well , 2% speak English not well , 12% don't speak English at all ).of residents speak Asian or Pacific Island language at home (76% speak English very well , 14% speak English well , 9% speak English not well ).of residents speak other language at home (62% speak English very well , 38% speak English not well ).
Foreign born population: 999 (15.5%)of them are naturalized citizens )
Median number of rooms in houses and condos:
Median number of rooms in apartments
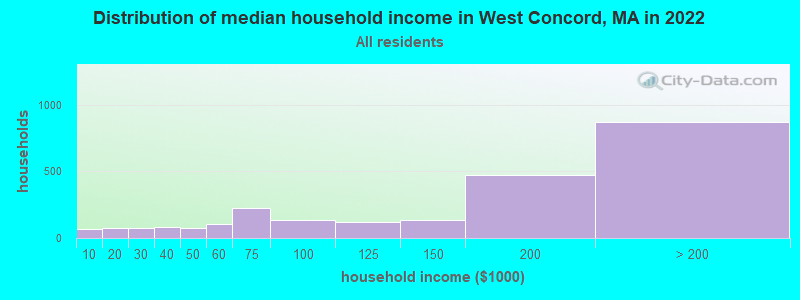
West Concord, MA household income distribution 66 Less than $10,00075 $10,000 to $19,99975 $20,000 to $29,99985 $30,000 to $39,99972 $40,000 to $49,999104 $50,000 to $59,999227 $60,000 to $74,999138 $75,000 to $99,999120 $100,000 to $124,999132 $125,000 to $149,999476 $150,000 to $199,999870 $200,000 or more
Home value of owner - occupied houses in 2022 in West Concord, MA 11 Less than $10,00063 $80,000 to $89,99916 $175,000 to $199,99910 $200,000 to $249,99931 $300,000 to $399,999167 $400,000 to $499,999278 $500,000 to $749,999514 $750,000 to $999,999287 $1,000,000 to $1,499,99996 $1,500,000 to $1,999,999Rent paid by renters in 2022 in West Concord, MA 41 $200 to $24917 $750 to $7997 $800 to $8996 $900 to $99927 $1,250 to $1,499124 $1,500 to $1,999430 $2,000 to $2,499146 $2,500 to $2,999158 $3,000 to $3,49958 $3,500 or more11 No cash rent
Percentage of workers working in this county: 83.8%Number of people working at home: 739 (29.2% of all workers )
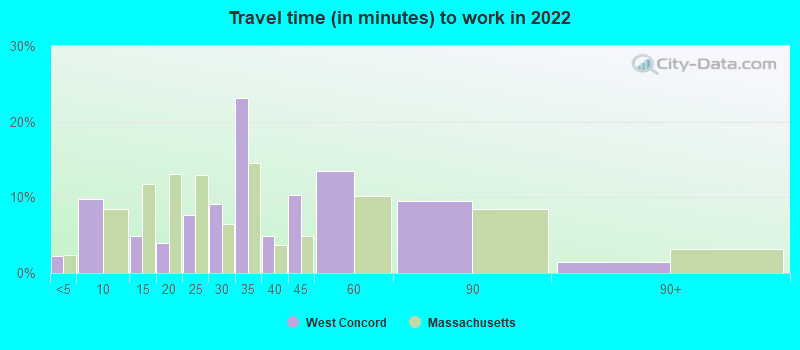
Travel time to work (commute)
Less than 5 minutes: 605 to 9 minutes: 19710 to 14 minutes: 19715 to 19 minutes: 15920 to 24 minutes: 17525 to 29 minutes: 19830 to 34 minutes: 19535 to 39 minutes: 9440 to 44 minutes: 10245 to 59 minutes: 17760 to 89 minutes: 14190 or more minutes: 85
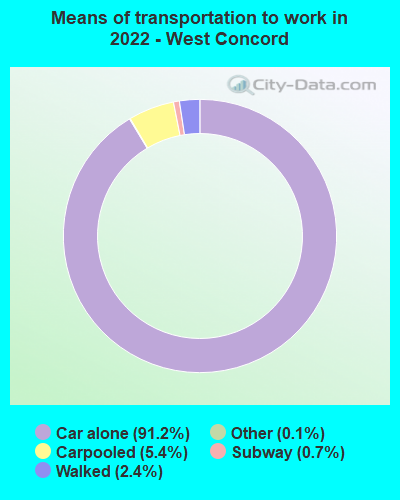
Means of transportation to work:
Drove a car alone: 2,927 (72.8%)Carpooled: 181 (4.5%)Long-distance train or commuter rail : 16 (0.4%)Taxi: 5 (0.1%)Bicycle: 3 (0.1%)Walked: 79 (2.0%)Worked at home: 739 (18.4%)
Unemployment by race in 2022
Unemployment rate for White non-Hispanic residents 0.5% Males4.0% FemalesUnemployment rate for Black residents 23.4% FemalesUnemployment rate for Asian residents 15.2% Females
Year of entry for the foreign-born population in West Concord, Massachusetts
160 2010 or later 232 2000 to 2009 215 1990 to 1999 83 1980 to 1989 79 1970 to 1979 137 Before 1970
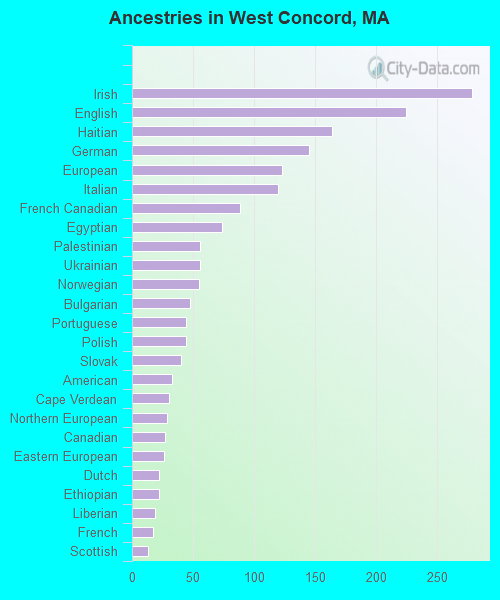
First ancestries reported:
Irish: 279 (9.6%)
English: 225 (7.8%)
Haitian: 164 (5.7%)
German: 145 (5.0%)
European: 123 (4.3%)
Italian: 120 (4.1%)
French Canadian: 89 (3.1%)
Egyptian: 74 (2.6%)
Palestinian: 56 (1.9%)
Ukrainian: 56 (1.9%)
Norwegian: 55 (1.9%)
Bulgarian: 48 (1.7%)
Portuguese: 44 (1.5%)
Polish: 44 (1.5%)
Slovak: 40 (1.4%)
American: 33 (1.1%)
Cape Verdean: 30 (1.0%)
Northern European: 29 (1.0%)
Canadian: 27 (0.9%)
Eastern European: 26 (0.9%)
Dutch: 22 (0.8%)
Ethiopian: 22 (0.8%)
Liberian: 19 (0.7%)
French: 17 (0.6%)
Scottish: 13 (0.4%)
Swedish: 11 (0.4%)
Russian: 10 (0.3%)
Lithuanian: 9 (0.3%)
British: 8 (0.3%)
Trinidadian and Tobagonian: 8 (0.3%)
African: 5 (0.2%)
Greek: 4 (0.1%)
Nigerian: 4 (0.1%)
Scandinavian: 2 (0.07%) Most common places of birth for foreign-born residents (%): Ireland West Concord:
12.7% (127)Massachusetts:
1.1% (13,446)
Haiti West Concord:
11.9% (119)Massachusetts:
4.9% (60,432)
Japan West Concord:
9.0% (90)Massachusetts:
0.6% (7,301)
India West Concord:
7.9% (79)Massachusetts:
6.8% (82,934)
Egypt West Concord:
5.4% (54)Massachusetts:
0.5% (6,109)
Canada West Concord:
4.3% (43)Massachusetts:
2.3% (28,158)
United Kingdom, excluding England and Scotland West Concord:
4.0% (40)Massachusetts:
1.0% (12,709)
Colombia West Concord:
3.8% (38)Massachusetts:
2.3% (27,810)
Lithuania West Concord:
3.5% (35)Massachusetts:
0.1% (1,180)
Ukraine West Concord:
3.0% (30)Massachusetts:
0.9% (10,808)
Bulgaria West Concord:
2.8% (28)Massachusetts:
0.3% (3,184)
Liberia West Concord:
2.8% (28)Massachusetts:
0.2% (2,812)
Korea West Concord:
2.7% (27)Massachusetts:
1.4% (17,613)
Czechoslovakia (includes Czech Republic and Slovakia) West Concord:
2.5% (25)Massachusetts:
0.2% (1,846)
Cuba West Concord:
2.0% (20)Massachusetts:
0.3% (3,711)
Taiwan West Concord:
1.9% (19)Massachusetts:
0.7% (8,270)
Netherlands West Concord:
1.8% (18)Massachusetts:
0.2% (2,231)
China, excluding Hong Kong and Taiwan West Concord:
1.7% (17)Massachusetts:
8.4% (103,233)
Ethiopia West Concord:
1.7% (17)Massachusetts:
0.4% (5,467)
Place of birth for U.S.-born residents:
This state: 3,247Other state: 2,014Northeast: 1,026Midwest: 286South: 400West: 303 87.9% of West Concord residents lived in the same house 1 years ago.
Out of people who lived in different houses, 33.2% lived in this county.
Out of people who lived in different counties, 76.4% lived in Massachusetts.
West Concord:
87.9%State average:
87.7%
Education attainment for males 25 years and older:
No schooling: 10Nursery to 4th grade: 65th and 6th grade: 47th and 8th grade: 119th grade: 3710th grade: 1811th grade: 9412th grade, no diploma: 132High school graduate (or equivalency): 532Less than 1 year of college: 67Some college more than 1 year, no degree: 104Associate degree: 54Bachelor's degree: 595Master's degree: 564Professional school degree: 115Doctorate degree: 227
Education attainment for females 25 years and older:
No schooling: 12Nursery to 4th grade: 05th and 6th grade: 07th and 8th grade: 09th grade: 010th grade: 011th grade: 012th grade, no diploma: 71High school graduate (or equivalency): 153Less than 1 year of college: 75Some college more than 1 year, no degree: 172Associate degree: 131Bachelor's degree: 616Master's degree: 695Professional school degree: 169Doctorate degree: 226
Housing units in structures:
One, detached: 1,168One, attached: 198Two: 193 or 4: 1995 to 9: 24210 to 19: 16320 to 49: 30950 or more: 431Housing units lacking complete kitchen facilities in 2022: 1.4%House/condo owner moved in on average 10 years ago
Renter moved in on average 5 years ago
Private vs. public school enrollment:
Students in private schools in grades 1 to 8 (elementary and middle school): 0 Here:
0.0%Massachusetts:
10.3%
Students in private schools in grades 9 to 12 (high school): 59 Here:
17.1%Massachusetts:
12.3%
Students in private undergraduate colleges: 111 Here:
48.5%Massachusetts:
51.2%