Ashburnham, Massachusetts (MA) income map, earnings map, and wages data
The median household income in Ashburnham, MA in 2022 was $100,120, which was 5.6% greater than the median annual income of $94,488 across the entire state of Massachusetts. Compared to the median income of $55,568 in 2000 this represents an increase of 44.5%. The per capita income in 2022 was $42,230, which means an increase of 48.7% compared to 2000 when it was $21,659.
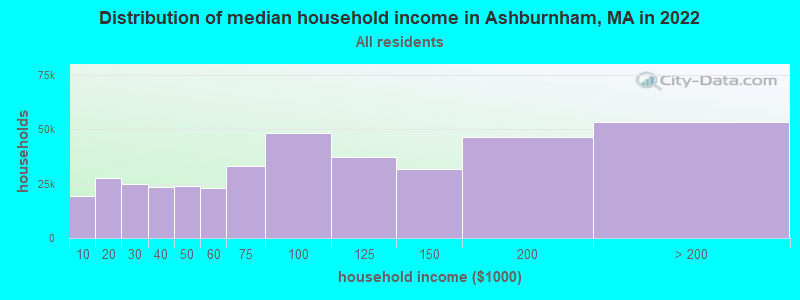
Income statistics for all residents
Median household income in Ashburnham, MA in 2022:| Ashburnham: | $100,121 |
| State: | $94,488 |
Change in median household income between 2000 and 2022:| Ashburnham, Massachusetts: | +80.2% |
| State: | +87.1% |
Number of households with income < $10k:| Ashburnham: | 4.9% (19,260) |
| State: | 5.2% (146,170) |
Number of households with income $10k - 20k:| Ashburnham: | 7.0% (27,478) |
| State: | 6.4% (180,001) |
Number of households with income $20k - 30k:| Ashburnham: | 6.4% (25,026) |
| State: | 5.6% (156,667) |
Number of households with income $30k - 40k:| Ashburnham: | 5.9% (23,294) |
| State: | 5.6% (157,168) |
Number of households with income $40k - 50k:| Ashburnham: | 6.1% (23,852) |
| Massachusetts: | 5.4% (151,455) |
Number of households with income $50k - 60k:| Ashburnham: | 5.8% (22,838) |
| Massachusetts: | 5.1% (142,726) |
Number of households with income $60k - 75k:| Ashburnham: | 8.4% (33,142) |
| State: | 7.6% (212,203) |
Number of households with income $75k - 100k:| Ashburnham: | 12.3% (48,203) |
| State: | 11.3% (317,064) |
Number of households with income $100k - 125k:| Ashburnham: | 9.5% (37,416) |
| State: | 9.7% (270,603) |
Number of households with income $125k - 150k:| Ashburnham: | 8.1% (31,972) |
| State: | 8.0% (223,140) |
Number of households with income $150k - 200k:| Ashburnham: | 11.9% (46,566) |
| State: | 11.0% (308,695) |
Number of households with income > $200k:| Ashburnham: | 13.6% (53,375) |
| Massachusetts: | 19.0% (531,884) |
Aggregate household income in Ashburnham in 2022: $2,145,969,691
Median family income in Ashburnham in 2022:| Ashburnham: | $108,548 |
| State: | $120,263 |
Median non-family income in Ashburnham in 2022:| Ashburnham: | $62,249 |
| State: | $55,979 |
Change in median non-family income between 2000 and 2022:| Ashburnham, Massachusetts: | +85.7% |
| State: | +88.0% |
Median per capita income in Ashburnham in 2022:| Ashburnham: | $42,230 |
| State: | $54,025 |
Change in median per capita income between 2000 and 2022:| Ashburnham, Massachusetts: | +95.0% |
| Massachusetts: | +108.2% |
Income statistics for White residents
Median household income in Ashburnham, MA in 2022:| Ashburnham: | $103,065 |
| Massachusetts: | $101,391 |
Change in median household income between 2000 and 2022:| Ashburnham, Massachusetts: | +85.1% |
| Massachusetts: | +93.3% |
Number of households with income < $10k:| Ashburnham: | 4.6% (13,766) |
| Massachusetts: | 4.4% (91,120) |
Number of households with income $10k - 20k:| Ashburnham: | 6.5% (19,684) |
| State: | 5.9% (122,055) |
Number of households with income $20k - 30k:| Ashburnham: | 6.1% (18,253) |
| Massachusetts: | 5.1% (105,311) |
Number of households with income $30k - 40k:| Ashburnham: | 5.5% (16,470) |
| State: | 5.3% (110,239) |
Number of households with income $40k - 50k:| Ashburnham: | 5.6% (16,863) |
| State: | 5.0% (104,636) |
Number of households with income $50k - 60k:| Ashburnham: | 5.4% (16,352) |
| Massachusetts: | 4.8% (99,486) |
Number of households with income $60k - 75k:| Ashburnham: | 8.4% (25,323) |
| State: | 7.5% (155,124) |
Number of households with income $75k - 100k:| Ashburnham: | 12.2% (36,802) |
| State: | 11.4% (236,252) |
Number of households with income $100k - 125k:| Ashburnham: | 10.1% (30,582) |
| State: | 9.9% (204,731) |
Number of households with income $125k - 150k:| Ashburnham: | 8.4% (25,221) |
| State: | 8.5% (175,324) |
Number of households with income $150k - 200k:| Ashburnham: | 12.5% (37,573) |
| Massachusetts: | 11.7% (242,980) |
Number of households with income > $200k:| Ashburnham: | 14.7% (44,442) |
| State: | 20.5% (425,966) |
Aggregate household income in Ashburnham in 2022: $1,757,857,732
Median family income in Ashburnham in 2022:| Ashburnham: | $114,324 |
| Massachusetts: | $133,153 |
Number of families with income < $10k:| Ashburnham: | 1.8% (22) |
| Massachusetts: | 2.0% (25,038) |
Number of families with income $10k - 20k:| Ashburnham: | 2.1% (25) |
| State: | 2.1% (26,403) |
Number of families with income $20k - 30k:| Ashburnham: | 4.2% (49) |
| State: | 2.6% (32,525) |
Number of families with income $30k - 40k:| Ashburnham: | 5.7% (68) |
| State: | 3.9% (48,079) |
Number of families with income $40k - 50k:| Ashburnham: | 5.2% (62) |
| State: | 3.8% (46,908) |
Number of families with income $50k - 60k:| Ashburnham: | 7.4% (88) |
| Massachusetts: | 3.8% (46,476) |
Number of families with income $60k - 75k:| Ashburnham: | 9.4% (110) |
| State: | 6.4% (79,040) |
Number of families with income $75k - 100k:| Ashburnham: | 19.9% (235) |
| Massachusetts: | 11.1% (137,395) |
Number of families with income $100k - 125k:| Ashburnham: | 12.2% (144) |
| State: | 11.1% (136,771) |
Number of families with income $125k - 150k:| Ashburnham: | 10.7% (126) |
| Massachusetts: | 10.0% (123,709) |
Number of families with income $150k - 200k:| Ashburnham: | 9.3% (110) |
| Massachusetts: | 14.7% (181,602) |
Number of families with income > $200k:| Ashburnham: | 12.0% (142) |
| State: | 28.5% (351,887) |
Median non-family income in Ashburnham in 2022:| Ashburnham: | $64,365 |
| Massachusetts: | $59,323 |
Change in median non-family income between 2000 and 2022:| Ashburnham, Massachusetts: | +92.0% |
| State: | +94.3% |
Median per capita income in Ashburnham in 2022:| Ashburnham: | $44,726 |
| State: | $60,804 |
Change in median per capita income between 2000 and 2022:| Ashburnham, Massachusetts: | +105.3% |
| State: | +118.7% |
Income statistics for Asian residents
Number of households with income < $10k:| Ashburnham: | 5.7% (356) |
| State: | 6.8% (11,982) |
Number of households with income $10k - 20k:| Ashburnham: | 5.8% (358) |
| State: | 4.8% (8,376) |
Number of households with income $20k - 30k:| Ashburnham: | 1.9% (118) |
| State: | 3.7% (6,558) |
Number of households with income $30k - 40k:| Ashburnham: | 3.6% (221) |
| Massachusetts: | 3.3% (5,748) |
Number of households with income $40k - 50k:| Ashburnham: | 4.9% (306) |
| Massachusetts: | 4.1% (7,192) |
Number of households with income $50k - 60k:| Ashburnham: | 3.5% (218) |
| State: | 5.0% (8,734) |
Number of households with income $60k - 75k:| Ashburnham: | 4.3% (270) |
| State: | 5.8% (10,203) |
Number of households with income $75k - 100k:| Ashburnham: | 6.1% (379) |
| Massachusetts: | 8.6% (15,154) |
Number of households with income $100k - 125k:| Ashburnham: | 9.7% (606) |
| State: | 10.8% (18,942) |
Number of households with income $125k - 150k:| Ashburnham: | 8.1% (502) |
| State: | 8.0% (14,037) |
Number of households with income $150k - 200k:| Ashburnham: | 21.1% (1,311) |
| State: | 12.5% (21,856) |
Number of households with income > $200k:| Ashburnham: | 25.4% (1,578) |
| State: | 26.6% (46,694) |
Median per capita income in Ashburnham in 2022:| Ashburnham: | $22,804 |
| State: | $58,900 |
Income statistics for Hispanic or Latino residents
Median household income in Ashburnham, MA in 2022:| Ashburnham: | $156,083 |
| Massachusetts: | $61,523 |
Change in median household income between 2000 and 2022:| Ashburnham, Massachusetts: | +116.0% |
| Massachusetts: | +125.4% |
Number of households with income < $10k:| Ashburnham: | 8.1% (7,988) |
| State: | 8.8% (25,307) |
Number of households with income $10k - 20k:| Ashburnham: | 10.5% (10,274) |
| State: | 10.0% (28,653) |
Number of households with income $20k - 30k:| Ashburnham: | 10.3% (10,160) |
| State: | 8.8% (25,189) |
Number of households with income $30k - 40k:| Ashburnham: | 9.5% (9,346) |
| State: | 7.2% (20,822) |
Number of households with income $40k - 50k:| Ashburnham: | 7.1% (6,990) |
| State: | 7.2% (20,817) |
Number of households with income $50k - 60k:| Ashburnham: | 8.0% (7,849) |
| State: | 6.5% (18,748) |
Number of households with income $60k - 75k:| Ashburnham: | 11.1% (10,877) |
| Massachusetts: | 8.8% (25,390) |
Number of households with income $75k - 100k:| Ashburnham: | 14.1% (13,839) |
| State: | 12.0% (34,488) |
Number of households with income $100k - 125k:| Ashburnham: | 5.7% (5,586) |
| Massachusetts: | 8.6% (24,599) |
Number of households with income $125k - 150k:| Ashburnham: | 8.8% (8,677) |
| State: | 6.2% (17,743) |
Number of households with income $150k - 200k:| Ashburnham: | 3.6% (3,489) |
| State: | 7.3% (21,017) |
Number of households with income > $200k:| Ashburnham: | 3.2% (3,128) |
| Massachusetts: | 8.6% (24,606) |
Aggregate household income in Ashburnham in 2022: $12,203,458
Median family income in Ashburnham in 2022:| Ashburnham: | $155,892 |
| Massachusetts: | $66,072 |
Number of families with income < $10k:| Ashburnham: | 6.7% (14) |
| Massachusetts: | 6.2% (12,456) |
Number of families with income $10k - 20k:| Ashburnham: | 3.3% (7) |
| State: | 6.0% (12,071) |
Number of families with income $20k - 30k:| Ashburnham: | 11.9% (24) |
| Massachusetts: | 10.1% (20,376) |
Number of families with income $30k - 40k:| Ashburnham: | 10.3% (21) |
| State: | 8.2% (16,470) |
Number of families with income $40k - 50k:| Ashburnham: | 11.1% (23) |
| Massachusetts: | 7.4% (14,829) |
Number of families with income $50k - 60k:| Ashburnham: | 14.6% (30) |
| State: | 7.3% (14,643) |
Number of families with income $60k - 75k:| Ashburnham: | 8.9% (18) |
| Massachusetts: | 10.6% (21,252) |
Number of families with income $75k - 100k:| Ashburnham: | 16.8% (34) |
| State: | 12.0% (24,088) |
Number of families with income $100k - 125k:| Ashburnham: | 4.5% (9) |
| State: | 8.9% (17,954) |
Number of families with income $125k - 150k:| Ashburnham: | 8.2% (17) |
| State: | 6.9% (13,837) |
Number of families with income $150k - 200k:| Ashburnham: | 1.7% (3) |
| State: | 7.3% (14,683) |
Number of families with income > $200k:| Ashburnham: | 2.0% (4) |
| State: | 9.3% (18,741) |
Median per capita income in Ashburnham in 2022:| Ashburnham: | $49,669 |
| Massachusetts: | $28,993 |
Change in median per capita income between 2000 and 2022:| Ashburnham, Massachusetts: | +110.9% |
| Massachusetts: | +142.4% |
Income statistics for American Indian and Alaska Native residents
Median household income in Ashburnham, MA in 2022:| Ashburnham: | $159,272 |
| State: | $87,730 |
Number of households with income < $10k:| Ashburnham: | 6.6% (597) |
| State: | 6.6% (451) |
Number of households with income $10k - 20k:| Ashburnham: | 7.0% (631) |
| State: | 7.0% (476) |
Number of households with income $20k - 30k:| Ashburnham: | 2.8% (254) |
| State: | 2.8% (192) |
Number of households with income $30k - 40k:| Ashburnham: | 3.2% (289) |
| State: | 3.2% (218) |
Number of households with income $40k - 50k:| Ashburnham: | 2.9% (263) |
| Massachusetts: | 2.9% (199) |
Number of households with income $50k - 60k:| Ashburnham: | 9.9% (897) |
| Massachusetts: | 9.9% (677) |
Number of households with income $60k - 75k:| Ashburnham: | 11.5% (1,034) |
| State: | 11.5% (781) |
Number of households with income $75k - 100k:| Ashburnham: | 9.2% (833) |
| Massachusetts: | 9.2% (629) |
Number of households with income $100k - 125k:| Ashburnham: | 6.0% (538) |
| State: | 6.0% (406) |
Number of households with income $125k - 150k:| Ashburnham: | 13.5% (1,220) |
| State: | 13.5% (921) |
Number of households with income $150k - 200k:| Ashburnham: | 12.6% (1,138) |
| Massachusetts: | 12.6% (859) |
Number of households with income > $200k:| Ashburnham: | 14.7% (1,328) |
| Massachusetts: | 14.7% (1,003) |
Aggregate household income in Ashburnham in 2022: $1,666,061
Median family income in Ashburnham in 2022:| Ashburnham: | $148,055 |
| Massachusetts: | $105,715 |
Number of families with income $40k - 50k:| Ashburnham: | 100.0% (12) |
| Massachusetts: | 4.3% (139) |
Median per capita income in Ashburnham in 2022:| Ashburnham: | $20,547 |
| State: | $39,434 |
Change in median per capita income between 2000 and 2022:| Ashburnham, Massachusetts: | +80.0% |
| State: | +148.2% |
Income statistics for Multirace residents
Median household income in Ashburnham, MA in 2022:| Ashburnham: | $113,143 |
| Massachusetts: | $71,552 |
Change in median household income between 2000 and 2022:| Ashburnham, Massachusetts: | +84.7% |
| State: | +109.0% |
Number of households with income < $10k:| Ashburnham: | 7.4% (4,213) |
| State: | 6.6% (15,127) |
Number of households with income $10k - 20k:| Ashburnham: | 10.3% (5,856) |
| State: | 9.2% (21,158) |
Number of households with income $20k - 30k:| Ashburnham: | 10.2% (5,788) |
| State: | 7.8% (18,016) |
Number of households with income $30k - 40k:| Ashburnham: | 11.3% (6,407) |
| Massachusetts: | 7.9% (18,260) |
Number of households with income $40k - 50k:| Ashburnham: | 6.2% (3,514) |
| Massachusetts: | 5.6% (13,027) |
Number of households with income $50k - 60k:| Ashburnham: | 8.7% (4,948) |
| State: | 5.6% (12,909) |
Number of households with income $60k - 75k:| Ashburnham: | 8.2% (4,628) |
| Massachusetts: | 9.0% (20,800) |
Number of households with income $75k - 100k:| Ashburnham: | 13.5% (7,649) |
| Massachusetts: | 12.1% (27,875) |
Number of households with income $100k - 125k:| Ashburnham: | 6.2% (3,499) |
| Massachusetts: | 8.1% (18,754) |
Number of households with income $125k - 150k:| Ashburnham: | 6.4% (3,641) |
| State: | 6.8% (15,621) |
Number of households with income $150k - 200k:| Ashburnham: | 5.9% (3,360) |
| Massachusetts: | 9.4% (21,618) |
Number of households with income > $200k:| Ashburnham: | 5.6% (3,159) |
| State: | 12.0% (27,592) |
Aggregate household income in Ashburnham in 2022: $3,435,915
Median family income in Ashburnham in 2022:| Ashburnham: | $110,826 |
| Massachusetts: | $78,380 |
Number of families with income $60k - 75k:| Ashburnham: | 100.0% (25) |
| State: | 10.3% (16,064) |
Median per capita income in Ashburnham in 2022:| Ashburnham: | $32,185 |
| State: | $34,029 |
Change in median per capita income between 2000 and 2022:| Ashburnham, Massachusetts: | +104.0% |
| Massachusetts: | +132.1% |