The median household income in Barnstable Town, MA in 2022 was $93,185, which was about the same as the median annual income of $94,488 across the entire state of Massachusetts. Compared to the median income of $46,811 in 2000 this represents an increase of 49.8%. The per capita income in 2022 was $60,929, which means an increase of 58.1% compared to 2000 when it was $25,554.
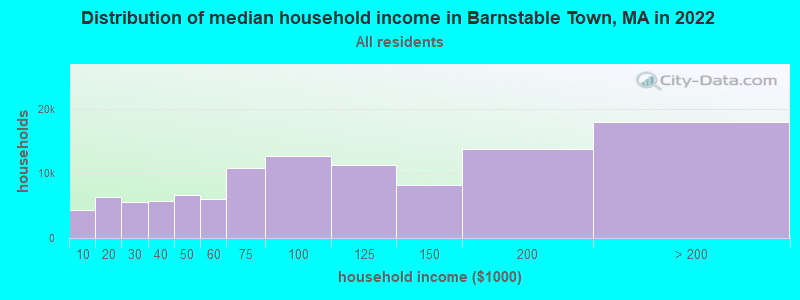
Income statistics for all residents
Median household income in Barnstable Town, MA in 2022:
Barnstable Town:
$93,186
State:
$94,488
Change in median household income between 2000 and 2022:
Barnstable Town, Massachusetts:
+99.1%
State:
+87.1%
Number of households with income < $10k:
Barnstable Town:
4.0% (4,383)
State:
5.2% (146,170)
Number of households with income $10k - 20k:
Barnstable Town:
5.8% (6,286)
State:
6.4% (180,001)
Number of households with income $20k - 30k:
Barnstable Town:
5.1% (5,532)
State:
5.6% (156,667)
Number of households with income $30k - 40k:
Barnstable Town:
5.2% (5,675)
State:
5.6% (157,168)
Number of households with income $40k - 50k:
Barnstable Town:
6.0% (6,585)
Massachusetts:
5.4% (151,455)
Number of households with income $50k - 60k:
Barnstable Town:
5.5% (5,997)
Massachusetts:
5.1% (142,726)
Number of households with income $60k - 75k:
Barnstable Town:
9.9% (10,830)
State:
7.6% (212,203)
Number of households with income $75k - 100k:
Barnstable Town:
11.6% (12,712)
State:
11.3% (317,064)
Number of households with income $100k - 125k:
Barnstable Town:
10.4% (11,347)
State:
9.7% (270,603)
Number of households with income $125k - 150k:
Barnstable Town:
7.5% (8,171)
State:
8.0% (223,140)
Number of households with income $150k - 200k:
Barnstable Town:
12.6% (13,770)
State:
11.0% (308,695)
Number of households with income > $200k:
Barnstable Town:
16.4% (17,947)
Massachusetts:
19.0% (531,884)
Aggregate household income in Barnstable Town in 2022: $7,775,465,255
Median family income in Barnstable Town in 2022:
Barnstable Town:
$114,102
State:
$120,263
Median non-family income in Barnstable Town in 2022:
Barnstable Town:
$58,443
State:
$55,979
Change in median non-family income between 2000 and 2022:
Barnstable Town, Massachusetts:
+103.0%
State:
+88.0%
Median per capita income in Barnstable Town in 2022:
Barnstable Town:
$60,930
State:
$54,025
Change in median per capita income between 2000 and 2022:
Barnstable Town, Massachusetts:
+138.4%
Massachusetts:
+108.2%
Income statistics for White residents
Median household income in Barnstable Town, MA in 2022:
Barnstable Town:
$98,787
Massachusetts:
$101,391
Change in median household income between 2000 and 2022:
Barnstable Town, Massachusetts:
+105.6%
Massachusetts:
+93.3%
Number of households with income < $10k:
Barnstable Town:
3.5% (3,534)
Massachusetts:
4.4% (91,120)
Number of households with income $10k - 20k:
Barnstable Town:
6.0% (5,970)
State:
5.9% (122,055)
Number of households with income $20k - 30k:
Barnstable Town:
4.4% (4,385)
Massachusetts:
5.1% (105,311)
Number of households with income $30k - 40k:
Barnstable Town:
5.1% (5,116)
State:
5.3% (110,239)
Number of households with income $40k - 50k:
Barnstable Town:
5.8% (5,807)
State:
5.0% (104,636)
Number of households with income $50k - 60k:
Barnstable Town:
5.7% (5,677)
Massachusetts:
4.8% (99,486)
Number of households with income $60k - 75k:
Barnstable Town:
10.1% (10,068)
State:
7.5% (155,124)
Number of households with income $75k - 100k:
Barnstable Town:
11.2% (11,243)
State:
11.4% (236,252)
Number of households with income $100k - 125k:
Barnstable Town:
10.8% (10,795)
State:
9.9% (204,731)
Number of households with income $125k - 150k:
Barnstable Town:
7.8% (7,768)
State:
8.5% (175,324)
Number of households with income $150k - 200k:
Barnstable Town:
12.4% (12,462)
Massachusetts:
11.7% (242,980)
Number of households with income > $200k:
Barnstable Town:
17.3% (17,347)
State:
20.5% (425,966)
Aggregate household income in Barnstable Town in 2022: $6,923,967,880
Median family income in Barnstable Town in 2022:
Barnstable Town:
$123,083
Massachusetts:
$133,153
Number of families with income < $10k:
Barnstable Town:
1.3% (179)
Massachusetts:
2.0% (25,038)
Number of families with income $10k - 20k:
Barnstable Town:
2.0% (275)
State:
2.1% (26,403)
Number of families with income $20k - 30k:
Barnstable Town:
1.0% (130)
State:
2.6% (32,525)
Number of families with income $30k - 40k:
Barnstable Town:
3.3% (447)
State:
3.9% (48,079)
Number of families with income $40k - 50k:
Barnstable Town:
3.7% (496)
State:
3.8% (46,908)
Number of families with income $50k - 60k:
Barnstable Town:
3.7% (496)
Massachusetts:
3.8% (46,476)
Number of families with income $60k - 75k:
Barnstable Town:
7.6% (1,025)
State:
6.4% (79,040)
Number of families with income $75k - 100k:
Barnstable Town:
10.5% (1,415)
Massachusetts:
11.1% (137,395)
Number of families with income $100k - 125k:
Barnstable Town:
12.5% (1,685)
State:
11.1% (136,771)
Number of families with income $125k - 150k:
Barnstable Town:
9.2% (1,248)
Massachusetts:
10.0% (123,709)
Number of families with income $150k - 200k:
Barnstable Town:
16.8% (2,267)
Massachusetts:
14.7% (181,602)
Number of families with income > $200k:
Barnstable Town:
28.4% (3,834)
State:
28.5% (351,887)
Median non-family income in Barnstable Town in 2022:
Barnstable Town:
$56,976
Massachusetts:
$59,323
Change in median non-family income between 2000 and 2022:
Barnstable Town, Massachusetts:
+96.7%
State:
+94.3%
Median per capita income in Barnstable Town in 2022:
Barnstable Town:
$66,313
State:
$60,804
Income statistics for Black or African American residents
Median household income in Barnstable Town, MA in 2022:
Barnstable Town:
$39,037
State:
$63,189
Change in median household income between 2000 and 2022:
Barnstable Town, Massachusetts:
+36.2%
State:
+87.4%
Number of households with income < $10k:
Barnstable Town:
9.1% (13,427)
State:
9.1% (15,797)
Number of households with income $10k - 20k:
Barnstable Town:
9.4% (13,826)
State:
9.4% (16,267)
Number of households with income $20k - 30k:
Barnstable Town:
7.8% (11,492)
Massachusetts:
7.8% (13,520)
Number of households with income $30k - 40k:
Barnstable Town:
8.3% (12,250)
Massachusetts:
8.3% (14,412)
Number of households with income $40k - 50k:
Barnstable Town:
7.9% (11,721)
State:
7.9% (13,790)
Number of households with income $50k - 60k:
Barnstable Town:
5.8% (8,535)
State:
5.8% (10,041)
Number of households with income $60k - 75k:
Barnstable Town:
8.5% (12,598)
Massachusetts:
8.5% (14,822)
Number of households with income $75k - 100k:
Barnstable Town:
11.0% (16,253)
State:
11.0% (19,122)
Number of households with income $100k - 125k:
Barnstable Town:
8.4% (12,388)
State:
8.4% (14,575)
Number of households with income $125k - 150k:
Barnstable Town:
6.0% (8,864)
State:
6.0% (10,429)
Number of households with income $150k - 200k:
Barnstable Town:
7.2% (10,658)
State:
7.2% (12,539)
Number of households with income > $200k:
Barnstable Town:
10.5% (15,457)
State:
10.5% (18,185)
Aggregate household income in Barnstable Town in 2022: $44,421,757
Median family income in Barnstable Town in 2022:
Barnstable Town:
$82,276
Massachusetts:
$79,815
Number of families with income < $10k:
Barnstable Town:
5.6% (14)
Massachusetts:
6.3% (6,915)
Number of families with income $10k - 20k:
Barnstable Town:
12.5% (31)
State:
6.8% (7,412)
Number of families with income $20k - 30k:
Barnstable Town:
5.4% (13)
State:
6.6% (7,274)
Number of families with income $30k - 40k:
Barnstable Town:
5.4% (13)
State:
6.4% (7,002)
Number of families with income $40k - 50k:
Barnstable Town:
12.0% (30)
State:
7.9% (8,656)
Number of families with income $50k - 60k:
Barnstable Town:
4.0% (10)
State:
6.4% (6,986)
Number of families with income $60k - 75k:
Barnstable Town:
13.8% (34)
State:
7.9% (8,699)
Number of families with income $75k - 100k:
Barnstable Town:
17.1% (42)
Massachusetts:
11.5% (12,654)
Number of families with income $100k - 125k:
Barnstable Town:
24.1% (59)
State:
10.4% (11,452)
Median non-family income in Barnstable Town in 2022:
Barnstable Town:
$214,604
Massachusetts:
$38,934
Median per capita income in Barnstable Town in 2022:
Barnstable Town:
$24,331
State:
$33,524
Change in median per capita income between 2000 and 2022:
Barnstable Town, Massachusetts:
+50.9%
State:
+109.4%
Income statistics for Asian residents
Median household income in Barnstable Town, MA in 2022:
Barnstable Town:
$149,642
Massachusetts:
$117,855
Number of households with income < $10k:
Barnstable Town:
6.8% (7,011)
Massachusetts:
6.8% (11,982)
Number of households with income $10k - 20k:
Barnstable Town:
4.8% (4,901)
Massachusetts:
4.8% (8,376)
Number of households with income $20k - 30k:
Barnstable Town:
3.7% (3,837)
State:
3.7% (6,558)
Number of households with income $30k - 40k:
Barnstable Town:
3.3% (3,364)
Massachusetts:
3.3% (5,748)
Number of households with income $40k - 50k:
Barnstable Town:
4.1% (4,208)
State:
4.1% (7,192)
Number of households with income $50k - 60k:
Barnstable Town:
5.0% (5,110)
Massachusetts:
5.0% (8,734)
Number of households with income $60k - 75k:
Barnstable Town:
5.8% (5,970)
State:
5.8% (10,203)
Number of households with income $75k - 100k:
Barnstable Town:
8.6% (8,867)
Massachusetts:
8.6% (15,154)
Number of households with income $100k - 125k:
Barnstable Town:
10.8% (11,083)
State:
10.8% (18,942)
Number of households with income $125k - 150k:
Barnstable Town:
8.0% (8,213)
State:
8.0% (14,037)
Number of households with income $150k - 200k:
Barnstable Town:
12.5% (12,788)
State:
12.5% (21,856)
Number of households with income > $200k:
Barnstable Town:
26.6% (27,321)
State:
26.6% (46,694)
Aggregate household income in Barnstable Town in 2022: $20,004,489
Median family income in Barnstable Town in 2022:
Barnstable Town:
$150,330
State:
$140,113
Number of families with income $10k - 20k:
Barnstable Town:
17.0% (9)
Massachusetts:
3.5% (4,118)
Number of families with income $20k - 30k:
Barnstable Town:
27.9% (16)
Massachusetts:
2.3% (2,708)
Number of families with income $30k - 40k:
Barnstable Town:
12.1% (7)
State:
2.8% (3,234)
Number of families with income $100k - 125k:
Barnstable Town:
43.0% (24)
State:
10.0% (11,697)
Median non-family income in Barnstable Town in 2022:
Barnstable Town:
$76,951
State:
$71,440
Change in median non-family income between 2000 and 2022:
Barnstable Town, Massachusetts:
+128.0%
State:
+128.0%
Median per capita income in Barnstable Town in 2022:
Barnstable Town:
$63,890
State:
$58,900
Income statistics for Hispanic or Latino residents
Median household income in Barnstable Town, MA in 2022:
Barnstable Town:
$89,676
Massachusetts:
$61,523
Change in median household income between 2000 and 2022:
Barnstable Town, Massachusetts:
+147.7%
Massachusetts:
+125.4%
Number of households with income < $10k:
Barnstable Town:
8.8% (33,562)
State:
8.8% (25,307)
Number of households with income $10k - 20k:
Barnstable Town:
10.0% (37,999)
Massachusetts:
10.0% (28,653)
Number of households with income $20k - 30k:
Barnstable Town:
8.8% (33,405)
State:
8.8% (25,189)
Number of households with income $30k - 40k:
Barnstable Town:
7.2% (27,614)
State:
7.2% (20,822)
Number of households with income $40k - 50k:
Barnstable Town:
7.2% (27,607)
Massachusetts:
7.2% (20,817)
Number of households with income $50k - 60k:
Barnstable Town:
6.5% (24,863)
Massachusetts:
6.5% (18,748)
Number of households with income $60k - 75k:
Barnstable Town:
8.8% (33,672)
Massachusetts:
8.8% (25,390)
Number of households with income $75k - 100k:
Barnstable Town:
12.0% (45,738)
Massachusetts:
12.0% (34,488)
Number of households with income $100k - 125k:
Barnstable Town:
8.6% (32,623)
State:
8.6% (24,599)
Number of households with income $125k - 150k:
Barnstable Town:
6.2% (23,531)
State:
6.2% (17,743)
Number of households with income $150k - 200k:
Barnstable Town:
7.3% (27,873)
Massachusetts:
7.3% (21,017)
Number of households with income > $200k:
Barnstable Town:
8.6% (32,632)
State:
8.6% (24,606)
Aggregate household income in Barnstable Town in 2022: $73,594,690
Median family income in Barnstable Town in 2022:
Barnstable Town:
$107,405
State:
$66,072
Number of families with income < $10k:
Barnstable Town:
8.7% (160)
State:
6.2% (12,456)
Number of families with income $10k - 20k:
Barnstable Town:
7.2% (132)
State:
6.0% (12,071)
Number of families with income $20k - 30k:
Barnstable Town:
12.4% (228)
Massachusetts:
10.1% (20,376)
Number of families with income $30k - 40k:
Barnstable Town:
10.3% (189)
Massachusetts:
8.2% (16,470)
Number of families with income $40k - 50k:
Barnstable Town:
8.8% (162)
State:
7.4% (14,829)
Number of families with income $50k - 60k:
Barnstable Town:
8.6% (159)
Massachusetts:
7.3% (14,643)
Number of families with income $60k - 75k:
Barnstable Town:
10.0% (184)
Massachusetts:
10.6% (21,252)
Number of families with income $75k - 100k:
Barnstable Town:
10.3% (189)
Massachusetts:
12.0% (24,088)
Number of families with income $100k - 125k:
Barnstable Town:
6.2% (114)
State:
8.9% (17,954)
Number of families with income $125k - 150k:
Barnstable Town:
4.4% (81)
Massachusetts:
6.9% (13,837)
Number of families with income $150k - 200k:
Barnstable Town:
4.4% (81)
State:
7.3% (14,683)
Number of families with income > $200k:
Barnstable Town:
8.5% (157)
Massachusetts:
9.3% (18,741)
Median non-family income in Barnstable Town in 2022:
Barnstable Town:
$125,916
State:
$37,563
Median per capita income in Barnstable Town in 2022:
Barnstable Town:
$32,210
State:
$28,993
Change in median per capita income between 2000 and 2022:
Barnstable Town, Massachusetts:
+111.4%
Massachusetts:
+142.4%
Income statistics for American Indian and Alaska Native residents
Median household income in Barnstable Town, MA in 2022:
Barnstable Town:
$144,382
State:
$87,730
Number of households with income < $10k:
Barnstable Town:
6.6% (469)
State:
6.6% (451)
Number of households with income $10k - 20k:
Barnstable Town:
7.0% (495)
State:
7.0% (476)
Number of households with income $20k - 30k:
Barnstable Town:
2.8% (199)
State:
2.8% (192)
Number of households with income $30k - 40k:
Barnstable Town:
3.2% (227)
State:
3.2% (218)
Number of households with income $40k - 50k:
Barnstable Town:
2.9% (207)
Massachusetts:
2.9% (199)
Number of households with income $50k - 60k:
Barnstable Town:
9.9% (704)
State:
9.9% (677)
Number of households with income $60k - 75k:
Barnstable Town:
11.5% (812)
State:
11.5% (781)
Number of households with income $75k - 100k:
Barnstable Town:
9.2% (654)
State:
9.2% (629)
Number of households with income $100k - 125k:
Barnstable Town:
6.0% (422)
Massachusetts:
6.0% (406)
Number of households with income $125k - 150k:
Barnstable Town:
13.5% (958)
State:
13.5% (921)
Number of households with income $150k - 200k:
Barnstable Town:
12.6% (893)
State:
12.6% (859)
Number of households with income > $200k:
Barnstable Town:
14.7% (1,043)
Massachusetts:
14.7% (1,003)
Aggregate household income in Barnstable Town in 2022: $9,615,201
Median family income in Barnstable Town in 2022:
Barnstable Town:
$99,505
State:
$105,715
Number of families with income $10k - 20k:
Barnstable Town:
5.8% (6)
State:
11.4% (365)
Number of families with income $20k - 30k:
Barnstable Town:
15.1% (15)
Massachusetts:
6.0% (193)
Number of families with income $30k - 40k:
Barnstable Town:
19.3% (19)
Massachusetts:
8.2% (263)
Number of families with income $40k - 50k:
Barnstable Town:
15.3% (15)
State:
4.3% (139)
Number of families with income $50k - 60k:
Barnstable Town:
7.5% (7)
State:
6.4% (204)
Number of families with income $60k - 75k:
Barnstable Town:
7.5% (7)
State:
14.7% (471)
Number of families with income $75k - 100k:
Barnstable Town:
29.5% (29)
State:
9.3% (297)
Median non-family income in Barnstable Town in 2022:
Barnstable Town:
$110,257
State:
$75,379
Median per capita income in Barnstable Town in 2022:
Barnstable Town:
$38,708
Massachusetts:
$39,434
Income statistics for Multirace residents
Median household income in Barnstable Town, MA in 2022:
Barnstable Town:
$75,683
State:
$71,552
Change in median household income between 2000 and 2022:
Barnstable Town, Massachusetts:
+129.9%
State:
+109.0%
Number of households with income < $10k:
Barnstable Town:
6.6% (7,320)
State:
6.6% (15,127)
Number of households with income $10k - 20k:
Barnstable Town:
9.3% (10,289)
State:
9.2% (21,158)
Number of households with income $20k - 30k:
Barnstable Town:
7.8% (8,672)
Massachusetts:
7.8% (18,016)
Number of households with income $30k - 40k:
Barnstable Town:
8.0% (8,847)
State:
7.9% (18,260)
Number of households with income $40k - 50k:
Barnstable Town:
5.7% (6,278)
Massachusetts:
5.6% (13,027)
Number of households with income $50k - 60k:
Barnstable Town:
5.6% (6,215)
State:
5.6% (12,909)
Number of households with income $60k - 75k:
Barnstable Town:
9.0% (9,996)
Massachusetts:
9.0% (20,800)
Number of households with income $75k - 100k:
Barnstable Town:
12.1% (13,487)
State:
12.1% (27,875)
Number of households with income $100k - 125k:
Barnstable Town:
8.1% (9,011)
State:
8.1% (18,754)
Number of households with income $125k - 150k:
Barnstable Town:
6.8% (7,509)
State:
6.8% (15,621)
Number of households with income $150k - 200k:
Barnstable Town:
9.2% (10,268)
Massachusetts:
9.4% (21,618)
Number of households with income > $200k:
Barnstable Town:
11.8% (13,150)
State:
12.0% (27,592)
Aggregate household income in Barnstable Town in 2022: $159,992,141
Median family income in Barnstable Town in 2022:
Barnstable Town:
$63,133
State:
$78,380
Number of families with income < $10k:
Barnstable Town:
5.2% (78)
Massachusetts:
4.5% (7,017)
Number of families with income $10k - 20k:
Barnstable Town:
3.6% (54)
State:
4.9% (7,678)
Number of families with income $20k - 30k:
Barnstable Town:
13.5% (201)
Massachusetts:
8.5% (13,245)
Number of families with income $30k - 40k:
Barnstable Town:
9.8% (146)
State:
8.2% (12,705)
Number of families with income $40k - 50k:
Barnstable Town:
1.6% (24)
State:
5.3% (8,255)
Number of families with income $50k - 60k:
Barnstable Town:
3.1% (47)
State:
6.7% (10,445)
Number of families with income $60k - 75k:
Barnstable Town:
7.7% (115)
State:
10.3% (16,064)
Number of families with income $75k - 100k:
Barnstable Town:
4.9% (73)
State:
12.1% (18,758)
Number of families with income $125k - 150k:
Barnstable Town:
23.9% (357)
State:
7.2% (11,128)
Number of families with income > $200k:
Barnstable Town:
26.7% (399)
Massachusetts:
14.0% (21,838)
Median non-family income in Barnstable Town in 2022:
Barnstable Town:
$88,017
Massachusetts:
$42,253
Median per capita income in Barnstable Town in 2022:
Barnstable Town:
$29,876
Massachusetts:
$34,029
Change in median per capita income between 2000 and 2022:
Barnstable Town, Massachusetts:
+103.4%
Massachusetts:
+132.1%
Income statistics for other residents
Number of households with income < $10k:
Barnstable Town:
8.4% (51)
Massachusetts:
8.4% (11,559)
Number of households with income $10k - 20k:
Barnstable Town:
8.4% (51)
State:
8.4% (11,499)
Number of households with income $20k - 30k:
Barnstable Town:
9.4% (57)
State:
9.5% (13,070)
Number of households with income $30k - 40k:
Barnstable Town:
6.1% (37)
Massachusetts:
6.0% (8,291)
Number of households with income $40k - 50k:
Barnstable Town:
9.1% (55)
State:
9.2% (12,611)
Number of households with income $50k - 60k:
Barnstable Town:
7.9% (48)
State:
7.9% (10,879)
Number of households with income $60k - 75k:
Barnstable Town:
7.4% (45)
Massachusetts:
7.5% (10,239)
Number of households with income $75k - 100k:
Barnstable Town:
13.1% (79)
State:
13.1% (18,032)
Number of households with income $100k - 125k:
Barnstable Town:
9.6% (58)
Massachusetts:
9.6% (13,141)
Number of households with income $125k - 150k:
Barnstable Town:
5.0% (30)
State:
5.0% (6,808)
Number of households with income $150k - 200k:
Barnstable Town:
6.4% (39)
State:
6.4% (8,843)
Number of households with income > $200k:
Barnstable Town:
9.1% (55)
State:
9.0% (12,396)
Aggregate household income in Barnstable Town in 2022: $38,519,715
Median family income in Barnstable Town in 2022:
Barnstable Town:
$155,131
State:
$66,840
Number of families with income < $10k:
Barnstable Town:
0.8% (4)
State:
6.7% (6,769)
Number of families with income $10k - 20k:
Barnstable Town:
4.1% (20)
Massachusetts:
4.7% (4,798)
Number of families with income $20k - 30k:
Barnstable Town:
7.9% (38)
State:
10.4% (10,595)
Number of families with income $30k - 40k:
Barnstable Town:
5.0% (24)
State:
7.0% (7,154)
Number of families with income $40k - 50k:
Barnstable Town:
14.7% (71)
Massachusetts:
8.9% (9,052)
Number of families with income $50k - 60k:
Barnstable Town:
9.4% (45)
Massachusetts:
8.7% (8,850)
Number of families with income $60k - 75k:
Barnstable Town:
3.5% (17)
State:
8.5% (8,683)
Number of families with income $75k - 100k:
Barnstable Town:
12.8% (62)
State:
12.8% (12,997)
Number of families with income $150k - 200k:
Barnstable Town:
41.7% (202)
State:
7.5% (7,659)
Median non-family income in Barnstable Town in 2022:
Barnstable Town:
$159,664
State:
$36,127
Median per capita income in Barnstable Town in 2022:
Barnstable Town:
$25,989
State:
$30,797
Change in median per capita income between 2000 and 2022:
Barnstable Town, Massachusetts:
+91.6%
State:
+188.5%
Discuss Barnstable Town, Massachusetts (MA) on our hugely popular Massachusetts forum.