Berkley, Massachusetts (MA) income map, earnings map, and wages data
The median household income in Berkley, MA in 2022 was $124,297, which was 24.0% greater than the median annual income of $94,488 across the entire state of Massachusetts. Compared to the median income of $66,295 in 2000 this represents an increase of 46.7%. The per capita income in 2022 was $44,150, which means an increase of 51.0% compared to 2000 when it was $21,652.
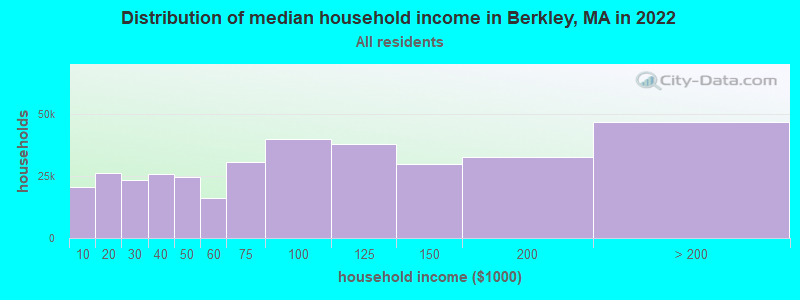
Income statistics for all residents
Median household income in Berkley, MA in 2022:| Berkley: | $124,297 |
| Massachusetts: | $94,488 |
Change in median household income between 2000 and 2022:| Berkley, Massachusetts: | +87.5% |
| Massachusetts: | +87.1% |
Number of households with income < $10k:| Berkley: | 5.8% (20,733) |
| Massachusetts: | 5.2% (146,170) |
Number of households with income $10k - 20k:| Berkley: | 7.3% (26,055) |
| Massachusetts: | 6.4% (180,001) |
Number of households with income $20k - 30k:| Berkley: | 6.6% (23,446) |
| Massachusetts: | 5.6% (156,667) |
Number of households with income $30k - 40k:| Berkley: | 7.3% (26,024) |
| State: | 5.6% (157,168) |
Number of households with income $40k - 50k:| Berkley: | 6.9% (24,478) |
| State: | 5.4% (151,455) |
Number of households with income $50k - 60k:| Berkley: | 4.6% (16,240) |
| Massachusetts: | 5.1% (142,726) |
Number of households with income $60k - 75k:| Berkley: | 8.6% (30,607) |
| State: | 7.6% (212,203) |
Number of households with income $75k - 100k:| Berkley: | 11.3% (40,047) |
| State: | 11.3% (317,064) |
Number of households with income $100k - 125k:| Berkley: | 10.7% (38,007) |
| Massachusetts: | 9.7% (270,603) |
Number of households with income $125k - 150k:| Berkley: | 8.5% (30,063) |
| State: | 8.0% (223,140) |
Number of households with income $150k - 200k:| Berkley: | 9.2% (32,875) |
| Massachusetts: | 11.0% (308,695) |
Number of households with income > $200k:| Berkley: | 13.2% (46,851) |
| State: | 19.0% (531,884) |
Aggregate household income in Berkley in 2022: $1,425,299,952
Median family income in Berkley in 2022:| Berkley: | $139,174 |
| State: | $120,263 |
Median non-family income in Berkley in 2022:| Berkley: | $38,723 |
| State: | $55,979 |
Change in median non-family income between 2000 and 2022:| Berkley, Massachusetts: | +93.6% |
| State: | +88.0% |
Median per capita income in Berkley in 2022:| Berkley: | $44,150 |
| State: | $54,025 |
Change in median per capita income between 2000 and 2022:| Berkley, Massachusetts: | +103.9% |
| Massachusetts: | +108.2% |
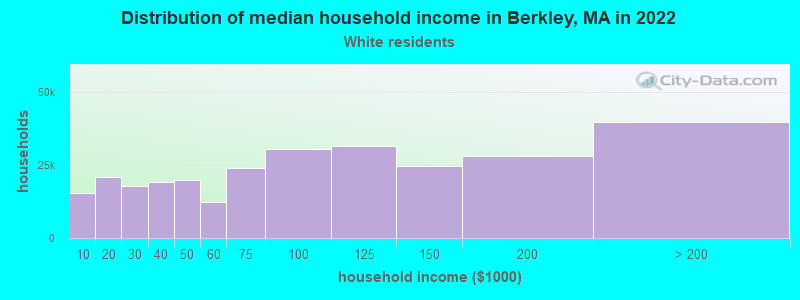
Income statistics for White residents
Median household income in Berkley, MA in 2022:| Berkley: | $128,293 |
| State: | $101,391 |
Change in median household income between 2000 and 2022:| Berkley, Massachusetts: | +92.2% |
| State: | +93.3% |
Number of households with income < $10k:| Berkley: | 5.5% (15,523) |
| Massachusetts: | 4.4% (91,120) |
Number of households with income $10k - 20k:| Berkley: | 7.4% (20,982) |
| Massachusetts: | 5.9% (122,055) |
Number of households with income $20k - 30k:| Berkley: | 6.3% (17,778) |
| State: | 5.1% (105,311) |
Number of households with income $30k - 40k:| Berkley: | 6.8% (19,227) |
| State: | 5.3% (110,239) |
Number of households with income $40k - 50k:| Berkley: | 7.0% (19,842) |
| State: | 5.0% (104,636) |
Number of households with income $50k - 60k:| Berkley: | 4.3% (12,243) |
| State: | 4.8% (99,486) |
Number of households with income $60k - 75k:| Berkley: | 8.5% (23,979) |
| State: | 7.5% (155,124) |
Number of households with income $75k - 100k:| Berkley: | 10.7% (30,418) |
| State: | 11.4% (236,252) |
Number of households with income $100k - 125k:| Berkley: | 11.0% (31,311) |
| Massachusetts: | 9.9% (204,731) |
Number of households with income $125k - 150k:| Berkley: | 8.7% (24,640) |
| State: | 8.5% (175,324) |
Number of households with income $150k - 200k:| Berkley: | 9.8% (27,867) |
| State: | 11.7% (242,980) |
Number of households with income > $200k:| Berkley: | 14.0% (39,635) |
| State: | 20.5% (425,966) |
Aggregate household income in Berkley in 2022: $1,172,266,768
Median family income in Berkley in 2022:| Berkley: | $144,830 |
| State: | $133,153 |
Number of families with income < $10k:| Berkley: | 0.6% (8) |
| State: | 2.0% (25,038) |
Number of families with income $10k - 20k:| Berkley: | 0.8% (10) |
| Massachusetts: | 2.1% (26,403) |
Number of families with income $20k - 30k:| Berkley: | 2.0% (27) |
| State: | 2.6% (32,525) |
Number of families with income $30k - 40k:| Berkley: | 2.6% (34) |
| State: | 3.9% (48,079) |
Number of families with income $40k - 50k:| Berkley: | 6.9% (92) |
| Massachusetts: | 3.8% (46,908) |
Number of families with income $50k - 60k:| Berkley: | 5.7% (75) |
| State: | 3.8% (46,476) |
Number of families with income $60k - 75k:| Berkley: | 8.7% (116) |
| State: | 6.4% (79,040) |
Number of families with income $75k - 100k:| Berkley: | 18.5% (245) |
| State: | 11.1% (137,395) |
Number of families with income $100k - 125k:| Berkley: | 23.0% (304) |
| Massachusetts: | 11.1% (136,771) |
Number of families with income $125k - 150k:| Berkley: | 12.8% (169) |
| State: | 10.0% (123,709) |
Number of families with income $150k - 200k:| Berkley: | 14.8% (196) |
| Massachusetts: | 14.7% (181,602) |
Number of families with income > $200k:| Berkley: | 3.5% (47) |
| Massachusetts: | 28.5% (351,887) |
Median non-family income in Berkley in 2022:| Berkley: | $38,542 |
| State: | $59,323 |
Change in median non-family income between 2000 and 2022:| Berkley, Massachusetts: | +92.7% |
| Massachusetts: | +94.3% |
Median per capita income in Berkley in 2022:| Berkley: | $46,993 |
| State: | $60,804 |
Change in median per capita income between 2000 and 2022:| Berkley, Massachusetts: | +115.0% |
| State: | +118.7% |
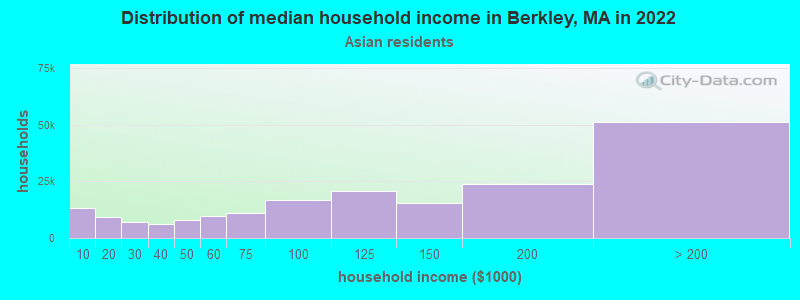
Income statistics for Asian residents
Median household income in Berkley, MA in 2022:| Berkley: | $128,051 |
| State: | $117,855 |
Change in median household income between 2000 and 2022:| Berkley, Massachusetts: | +127.6% |
| Massachusetts: | +129.9% |
Number of households with income < $10k:| Berkley: | 6.8% (13,145) |
| Massachusetts: | 6.8% (11,982) |
Number of households with income $10k - 20k:| Berkley: | 4.8% (9,189) |
| Massachusetts: | 4.8% (8,376) |
Number of households with income $20k - 30k:| Berkley: | 3.7% (7,195) |
| Massachusetts: | 3.7% (6,558) |
Number of households with income $30k - 40k:| Berkley: | 3.3% (6,306) |
| State: | 3.3% (5,748) |
Number of households with income $40k - 50k:| Berkley: | 4.1% (7,890) |
| State: | 4.1% (7,192) |
Number of households with income $50k - 60k:| Berkley: | 5.0% (9,582) |
| State: | 5.0% (8,734) |
Number of households with income $60k - 75k:| Berkley: | 5.8% (11,193) |
| State: | 5.8% (10,203) |
Number of households with income $75k - 100k:| Berkley: | 8.6% (16,625) |
| State: | 8.6% (15,154) |
Number of households with income $100k - 125k:| Berkley: | 10.8% (20,781) |
| State: | 10.8% (18,942) |
Number of households with income $125k - 150k:| Berkley: | 8.0% (15,400) |
| State: | 8.0% (14,037) |
Number of households with income $150k - 200k:| Berkley: | 12.5% (23,978) |
| Massachusetts: | 12.5% (21,856) |
Number of households with income > $200k:| Berkley: | 26.6% (51,227) |
| Massachusetts: | 26.6% (46,694) |
Aggregate household income in Berkley in 2022: $1,541,841
Median family income in Berkley in 2022:| Berkley: | $127,510 |
| State: | $140,113 |
Median per capita income in Berkley in 2022:| Berkley: | $83,537 |
| State: | $58,900 |
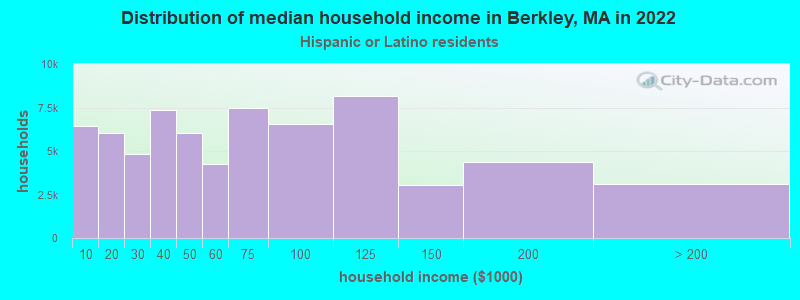
Income statistics for Hispanic or Latino residents
Median household income in Berkley, MA in 2022:| Berkley: | $228,095 |
| State: | $61,523 |
Number of households with income < $10k:| Berkley: | 9.5% (6,462) |
| State: | 8.8% (25,307) |
Number of households with income $10k - 20k:| Berkley: | 8.9% (6,055) |
| State: | 10.0% (28,653) |
Number of households with income $20k - 30k:| Berkley: | 7.1% (4,828) |
| State: | 8.8% (25,189) |
Number of households with income $30k - 40k:| Berkley: | 10.8% (7,343) |
| State: | 7.2% (20,822) |
Number of households with income $40k - 50k:| Berkley: | 8.9% (6,059) |
| State: | 7.2% (20,817) |
Number of households with income $50k - 60k:| Berkley: | 6.3% (4,259) |
| Massachusetts: | 6.5% (18,748) |
Number of households with income $60k - 75k:| Berkley: | 11.1% (7,494) |
| State: | 8.8% (25,390) |
Number of households with income $75k - 100k:| Berkley: | 9.7% (6,554) |
| State: | 12.0% (34,488) |
Number of households with income $100k - 125k:| Berkley: | 12.1% (8,187) |
| Massachusetts: | 8.6% (24,599) |
Number of households with income $125k - 150k:| Berkley: | 4.5% (3,036) |
| State: | 6.2% (17,743) |
Number of households with income $150k - 200k:| Berkley: | 6.4% (4,351) |
| Massachusetts: | 7.3% (21,017) |
Number of households with income > $200k:| Berkley: | 4.6% (3,092) |
| State: | 8.6% (24,606) |
Aggregate household income in Berkley in 2022: $8,400,899
Median family income in Berkley in 2022:| Berkley: | $204,833 |
| Massachusetts: | $66,072 |
Number of families with income < $10k:| Berkley: | 2.3% (3) |
| Massachusetts: | 6.2% (12,456) |
Number of families with income $10k - 20k:| Berkley: | 1.4% (2) |
| State: | 6.0% (12,071) |
Number of families with income $20k - 30k:| Berkley: | 9.3% (13) |
| State: | 10.1% (20,376) |
Number of families with income $30k - 40k:| Berkley: | 5.0% (7) |
| State: | 8.2% (16,470) |
Number of families with income $40k - 50k:| Berkley: | 8.8% (12) |
| State: | 7.4% (14,829) |
Number of families with income $50k - 60k:| Berkley: | 3.7% (5) |
| State: | 7.3% (14,643) |
Number of families with income $60k - 75k:| Berkley: | 12.4% (17) |
| State: | 10.6% (21,252) |
Number of families with income $75k - 100k:| Berkley: | 19.8% (27) |
| Massachusetts: | 12.0% (24,088) |
Number of families with income $100k - 125k:| Berkley: | 20.1% (28) |
| Massachusetts: | 8.9% (17,954) |
Number of families with income $125k - 150k:| Berkley: | 8.4% (11) |
| Massachusetts: | 6.9% (13,837) |
Number of families with income $150k - 200k:| Berkley: | 8.0% (11) |
| State: | 7.3% (14,683) |
Number of families with income > $200k:| Berkley: | 0.8% (1) |
| Massachusetts: | 9.3% (18,741) |
Median per capita income in Berkley in 2022:| Berkley: | $26,862 |
| State: | $28,993 |
Change in median per capita income between 2000 and 2022:| Berkley, Massachusetts: | +98.7% |
| Massachusetts: | +142.4% |
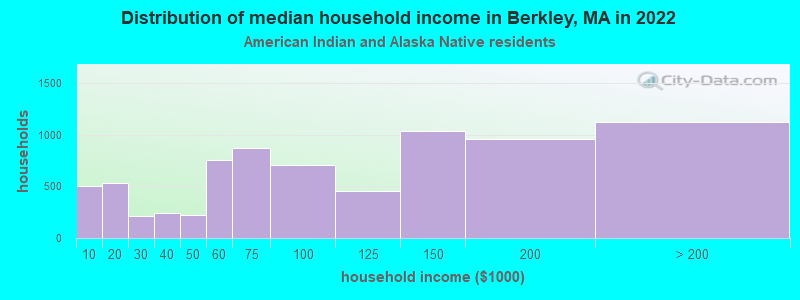
Income statistics for American Indian and Alaska Native residents
Median household income in Berkley, MA in 2022:| Berkley: | $96,787 |
| State: | $87,730 |
Change in median household income between 2000 and 2022:| Berkley, Massachusetts: | +134.6% |
| State: | +138.3% |
Number of households with income < $10k:| Berkley: | 6.6% (505) |
| State: | 6.6% (451) |
Number of households with income $10k - 20k:| Berkley: | 7.0% (534) |
| Massachusetts: | 7.0% (476) |
Number of households with income $20k - 30k:| Berkley: | 2.8% (215) |
| State: | 2.8% (192) |
Number of households with income $30k - 40k:| Berkley: | 3.2% (244) |
| State: | 3.2% (218) |
Number of households with income $40k - 50k:| Berkley: | 2.9% (223) |
| State: | 2.9% (199) |
Number of households with income $50k - 60k:| Berkley: | 9.9% (759) |
| State: | 9.9% (677) |
Number of households with income $60k - 75k:| Berkley: | 11.5% (875) |
| State: | 11.5% (781) |
Number of households with income $75k - 100k:| Berkley: | 9.2% (705) |
| State: | 9.2% (629) |
Number of households with income $100k - 125k:| Berkley: | 6.0% (455) |
| Massachusetts: | 6.0% (406) |
Number of households with income $125k - 150k:| Berkley: | 13.5% (1,032) |
| State: | 13.5% (921) |
Number of households with income $150k - 200k:| Berkley: | 12.6% (963) |
| State: | 12.6% (859) |
Number of households with income > $200k:| Berkley: | 14.7% (1,124) |
| Massachusetts: | 14.7% (1,003) |
Aggregate household income in Berkley in 2022: $286,948
Median per capita income in Berkley in 2022:| Berkley: | $19,046 |
| Massachusetts: | $39,434 |
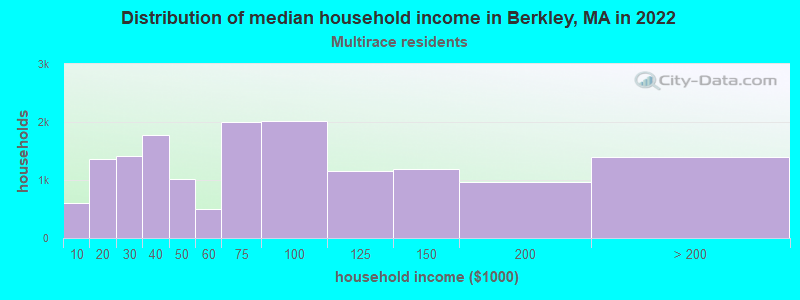
Income statistics for Multirace residents
Median household income in Berkley, MA in 2022:| Berkley: | $60,476 |
| Massachusetts: | $71,552 |
Change in median household income between 2000 and 2022:| Berkley, Massachusetts: | +110.4% |
| State: | +109.0% |
Number of households with income < $10k:| Berkley: | 4.0% (611) |
| State: | 6.6% (15,127) |
Number of households with income $10k - 20k:| Berkley: | 8.9% (1,368) |
| State: | 9.2% (21,158) |
Number of households with income $20k - 30k:| Berkley: | 9.2% (1,419) |
| State: | 7.8% (18,016) |
Number of households with income $30k - 40k:| Berkley: | 11.6% (1,782) |
| State: | 7.9% (18,260) |
Number of households with income $40k - 50k:| Berkley: | 6.6% (1,023) |
| State: | 5.6% (13,027) |
Number of households with income $50k - 60k:| Berkley: | 3.3% (506) |
| State: | 5.6% (12,909) |
Number of households with income $60k - 75k:| Berkley: | 13.0% (2,007) |
| Massachusetts: | 9.0% (20,800) |
Number of households with income $75k - 100k:| Berkley: | 13.1% (2,015) |
| Massachusetts: | 12.1% (27,875) |
Number of households with income $100k - 125k:| Berkley: | 7.5% (1,154) |
| State: | 8.1% (18,754) |
Number of households with income $125k - 150k:| Berkley: | 7.7% (1,194) |
| State: | 6.8% (15,621) |
Number of households with income $150k - 200k:| Berkley: | 6.2% (957) |
| State: | 9.4% (21,618) |
Number of households with income > $200k:| Berkley: | 9.0% (1,389) |
| Massachusetts: | 12.0% (27,592) |
Aggregate household income in Berkley in 2022: $1,841,910
Median family income in Berkley in 2022:| Berkley: | $44,228 |
| State: | $78,380 |
Number of families with income $20k - 30k:| Berkley: | 100.0% (23) |
| State: | 8.5% (13,245) |
Median per capita income in Berkley in 2022:| Berkley: | $28,136 |
| State: | $34,029 |
Change in median per capita income between 2000 and 2022:| Berkley, Massachusetts: | +76.3% |
| Massachusetts: | +132.1% |
Income statistics for other residents
Number of households with income < $10k:| Berkley: | 9.8% (8) |
| State: | 8.4% (11,559) |
Number of households with income $10k - 20k:| Berkley: | 8.5% (7) |
| Massachusetts: | 8.4% (11,499) |
Number of households with income $20k - 30k:| Berkley: | 13.4% (11) |
| State: | 9.5% (13,070) |
Number of households with income $30k - 40k:| Berkley: | 7.3% (6) |
| State: | 6.0% (8,291) |
Number of households with income $40k - 50k:| Berkley: | 6.1% (5) |
| State: | 9.2% (12,611) |
Number of households with income $50k - 60k:| Berkley: | 11.0% (9) |
| State: | 7.9% (10,879) |
Number of households with income $60k - 75k:| Berkley: | 4.9% (4) |
| State: | 7.5% (10,239) |
Number of households with income $75k - 100k:| Berkley: | 11.0% (9) |
| State: | 13.1% (18,032) |
Number of households with income $100k - 125k:| Berkley: | 8.5% (7) |
| State: | 9.6% (13,141) |
Number of households with income $125k - 150k:| Berkley: | 7.3% (6) |
| Massachusetts: | 5.0% (6,808) |
Number of households with income $150k - 200k:| Berkley: | 8.5% (7) |
| State: | 6.4% (8,843) |
Number of households with income > $200k:| Berkley: | 3.7% (3) |
| Massachusetts: | 9.0% (12,396) |
Aggregate household income in Berkley in 2022: $6,208,466
Median family income in Berkley in 2022:| Berkley: | $133,251 |
| State: | $66,840 |
Number of families with income $10k - 20k:| Berkley: | 11.0% (4) |
| Massachusetts: | 4.7% (4,798) |
Number of families with income $40k - 50k:| Berkley: | 6.6% (3) |
| State: | 8.9% (9,052) |
Number of families with income $75k - 100k:| Berkley: | 82.4% (32) |
| State: | 12.8% (12,997) |
Median per capita income in Berkley in 2022:| Berkley: | $28,839 |
| State: | $30,797 |
Change in median per capita income between 2000 and 2022:| Berkley, Massachusetts: | +128.7% |
| State: | +188.5% |