Mashpee, Massachusetts (MA) income map, earnings map, and wages data
The median household income in Mashpee, MA in 2022 was $101,267, which was 6.7% greater than the median annual income of $94,488 across the entire state of Massachusetts. Compared to the median income of $50,871 in 2000 this represents an increase of 49.8%. The per capita income in 2022 was $60,121, which means an increase of 58.1% compared to 2000 when it was $25,215.
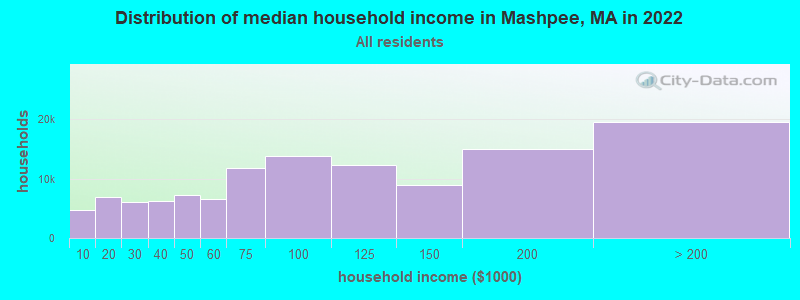
Income statistics for all residents
Median household income in Mashpee, MA in 2022:| Mashpee: | $101,268 |
| State: | $94,488 |
Change in median household income between 2000 and 2022:| Mashpee, Massachusetts: | +99.1% |
| State: | +87.1% |
Number of households with income < $10k:| Mashpee: | 4.0% (4,763) |
| Massachusetts: | 5.2% (146,170) |
Number of households with income $10k - 20k:| Mashpee: | 5.8% (6,831) |
| Massachusetts: | 6.4% (180,001) |
Number of households with income $20k - 30k:| Mashpee: | 5.1% (6,012) |
| State: | 5.6% (156,667) |
Number of households with income $30k - 40k:| Mashpee: | 5.2% (6,168) |
| State: | 5.6% (157,168) |
Number of households with income $40k - 50k:| Mashpee: | 6.0% (7,155) |
| State: | 5.4% (151,455) |
Number of households with income $50k - 60k:| Mashpee: | 5.5% (6,518) |
| Massachusetts: | 5.1% (142,726) |
Number of households with income $60k - 75k:| Mashpee: | 9.9% (11,769) |
| State: | 7.6% (212,203) |
Number of households with income $75k - 100k:| Mashpee: | 11.6% (13,815) |
| State: | 11.3% (317,064) |
Number of households with income $100k - 125k:| Mashpee: | 10.4% (12,331) |
| Massachusetts: | 9.7% (270,603) |
Number of households with income $125k - 150k:| Mashpee: | 7.5% (8,880) |
| State: | 8.0% (223,140) |
Number of households with income $150k - 200k:| Mashpee: | 12.6% (14,965) |
| State: | 11.0% (308,695) |
Number of households with income > $200k:| Mashpee: | 16.4% (19,503) |
| State: | 19.0% (531,884) |
Aggregate household income in Mashpee in 2022: $2,086,992,843
Median family income in Mashpee in 2022:| Mashpee: | $119,754 |
| State: | $120,263 |
Median non-family income in Mashpee in 2022:| Mashpee: | $70,580 |
| Massachusetts: | $55,979 |
Change in median non-family income between 2000 and 2022:| Mashpee, Massachusetts: | +103.0% |
| Massachusetts: | +88.0% |
Median per capita income in Mashpee in 2022:| Mashpee: | $60,121 |
| State: | $54,025 |
Change in median per capita income between 2000 and 2022:| Mashpee, Massachusetts: | +138.4% |
| State: | +108.2% |
Income statistics for White residents
Median household income in Mashpee, MA in 2022:| Mashpee: | $106,049 |
| State: | $101,391 |
Change in median household income between 2000 and 2022:| Mashpee, Massachusetts: | +105.6% |
| State: | +93.3% |
Number of households with income < $10k:| Mashpee: | 3.5% (3,794) |
| Massachusetts: | 4.4% (91,120) |
Number of households with income $10k - 20k:| Mashpee: | 6.0% (6,410) |
| Massachusetts: | 5.9% (122,055) |
Number of households with income $20k - 30k:| Mashpee: | 4.4% (4,707) |
| State: | 5.1% (105,311) |
Number of households with income $30k - 40k:| Mashpee: | 5.1% (5,492) |
| Massachusetts: | 5.3% (110,239) |
Number of households with income $40k - 50k:| Mashpee: | 5.8% (6,234) |
| State: | 5.0% (104,636) |
Number of households with income $50k - 60k:| Mashpee: | 5.7% (6,095) |
| Massachusetts: | 4.8% (99,486) |
Number of households with income $60k - 75k:| Mashpee: | 10.1% (10,808) |
| Massachusetts: | 7.5% (155,124) |
Number of households with income $75k - 100k:| Mashpee: | 11.2% (12,069) |
| State: | 11.4% (236,252) |
Number of households with income $100k - 125k:| Mashpee: | 10.8% (11,588) |
| Massachusetts: | 9.9% (204,731) |
Number of households with income $125k - 150k:| Mashpee: | 7.8% (8,340) |
| Massachusetts: | 8.5% (175,324) |
Number of households with income $150k - 200k:| Mashpee: | 12.4% (13,378) |
| Massachusetts: | 11.7% (242,980) |
Number of households with income > $200k:| Mashpee: | 17.3% (18,622) |
| Massachusetts: | 20.5% (425,966) |
Aggregate household income in Mashpee in 2022: $1,825,416,606
Median family income in Mashpee in 2022:| Mashpee: | $127,325 |
| Massachusetts: | $133,153 |
Number of families with income < $10k:| Mashpee: | 0.9% (31) |
| Massachusetts: | 2.0% (25,038) |
Number of families with income $10k - 20k:| Mashpee: | 1.8% (59) |
| State: | 2.1% (26,403) |
Number of families with income $20k - 30k:| Mashpee: | 0.8% (25) |
| State: | 2.6% (32,525) |
Number of families with income $30k - 40k:| Mashpee: | 3.8% (125) |
| State: | 3.9% (48,079) |
Number of families with income $40k - 50k:| Mashpee: | 5.2% (169) |
| State: | 3.8% (46,908) |
Number of families with income $50k - 60k:| Mashpee: | 4.1% (133) |
| State: | 3.8% (46,476) |
Number of families with income $60k - 75k:| Mashpee: | 9.3% (305) |
| State: | 6.4% (79,040) |
Number of families with income $75k - 100k:| Mashpee: | 14.1% (460) |
| State: | 11.1% (137,395) |
Number of families with income $100k - 125k:| Mashpee: | 14.9% (485) |
| Massachusetts: | 11.1% (136,771) |
Number of families with income $125k - 150k:| Mashpee: | 10.8% (352) |
| State: | 10.0% (123,709) |
Number of families with income $150k - 200k:| Mashpee: | 13.3% (432) |
| State: | 14.7% (181,602) |
Number of families with income > $200k:| Mashpee: | 21.0% (686) |
| State: | 28.5% (351,887) |
Median non-family income in Mashpee in 2022:| Mashpee: | $70,391 |
| State: | $59,323 |
Change in median non-family income between 2000 and 2022:| Mashpee, Massachusetts: | +96.7% |
| State: | +94.3% |
Median per capita income in Mashpee in 2022:| Mashpee: | $65,447 |
| State: | $60,804 |
Income statistics for Black or African American residents
Median household income in Mashpee, MA in 2022:| Mashpee: | $62,980 |
| State: | $63,189 |
Change in median household income between 2000 and 2022:| Mashpee, Massachusetts: | +36.2% |
| State: | +87.4% |
Number of households with income < $10k:| Mashpee: | 9.1% (21,663) |
| Massachusetts: | 9.1% (15,797) |
Number of households with income $10k - 20k:| Mashpee: | 9.4% (22,307) |
| State: | 9.4% (16,267) |
Number of households with income $20k - 30k:| Mashpee: | 7.8% (18,540) |
| State: | 7.8% (13,520) |
Number of households with income $30k - 40k:| Mashpee: | 8.3% (19,763) |
| Massachusetts: | 8.3% (14,412) |
Number of households with income $40k - 50k:| Mashpee: | 7.9% (18,910) |
| State: | 7.9% (13,790) |
Number of households with income $50k - 60k:| Mashpee: | 5.8% (13,769) |
| Massachusetts: | 5.8% (10,041) |
Number of households with income $60k - 75k:| Mashpee: | 8.5% (20,325) |
| State: | 8.5% (14,822) |
Number of households with income $75k - 100k:| Mashpee: | 11.0% (26,222) |
| Massachusetts: | 11.0% (19,122) |
Number of households with income $100k - 125k:| Mashpee: | 8.4% (19,987) |
| State: | 8.4% (14,575) |
Number of households with income $125k - 150k:| Mashpee: | 6.0% (14,301) |
| State: | 6.0% (10,429) |
Number of households with income $150k - 200k:| Mashpee: | 7.2% (17,195) |
| State: | 7.2% (12,539) |
Number of households with income > $200k:| Mashpee: | 10.5% (24,937) |
| Massachusetts: | 10.5% (18,185) |
Aggregate household income in Mashpee in 2022: $21,617,774
Median family income in Mashpee in 2022:| Mashpee: | $123,889 |
| State: | $79,815 |
Number of families with income $10k - 20k:| Mashpee: | 6.8% (8) |
| State: | 6.8% (7,412) |
Number of families with income $20k - 30k:| Mashpee: | 9.7% (12) |
| State: | 6.6% (7,274) |
Number of families with income $40k - 50k:| Mashpee: | 13.1% (16) |
| Massachusetts: | 7.9% (8,656) |
Number of families with income $60k - 75k:| Mashpee: | 20.5% (25) |
| State: | 7.9% (8,699) |
Number of families with income $75k - 100k:| Mashpee: | 23.8% (29) |
| State: | 11.5% (12,654) |
Number of families with income $100k - 125k:| Mashpee: | 26.1% (31) |
| State: | 10.4% (11,452) |
Median non-family income in Mashpee in 2022:| Mashpee: | $387,467 |
| Massachusetts: | $38,934 |
Median per capita income in Mashpee in 2022:| Mashpee: | $29,573 |
| State: | $33,524 |
Change in median per capita income between 2000 and 2022:| Mashpee, Massachusetts: | +50.9% |
| State: | +109.4% |
Income statistics for Asian residents
Median household income in Mashpee, MA in 2022:| Mashpee: | $147,771 |
| State: | $117,855 |
Number of households with income < $10k:| Mashpee: | 6.8% (6,923) |
| Massachusetts: | 6.8% (11,982) |
Number of households with income $10k - 20k:| Mashpee: | 4.8% (4,840) |
| State: | 4.8% (8,376) |
Number of households with income $20k - 30k:| Mashpee: | 3.7% (3,790) |
| State: | 3.7% (6,558) |
Number of households with income $30k - 40k:| Mashpee: | 3.3% (3,321) |
| State: | 3.3% (5,748) |
Number of households with income $40k - 50k:| Mashpee: | 4.1% (4,155) |
| State: | 4.1% (7,192) |
Number of households with income $50k - 60k:| Mashpee: | 5.0% (5,046) |
| Massachusetts: | 5.0% (8,734) |
Number of households with income $60k - 75k:| Mashpee: | 5.8% (5,895) |
| Massachusetts: | 5.8% (10,203) |
Number of households with income $75k - 100k:| Mashpee: | 8.6% (8,756) |
| Massachusetts: | 8.6% (15,154) |
Number of households with income $100k - 125k:| Mashpee: | 10.8% (10,944) |
| State: | 10.8% (18,942) |
Number of households with income $125k - 150k:| Mashpee: | 8.0% (8,110) |
| Massachusetts: | 8.0% (14,037) |
Number of households with income $150k - 200k:| Mashpee: | 12.5% (12,628) |
| State: | 12.5% (21,856) |
Number of households with income > $200k:| Mashpee: | 26.6% (26,979) |
| Massachusetts: | 26.6% (46,694) |
Aggregate household income in Mashpee in 2022: $4,366,868
Median family income in Mashpee in 2022:| Mashpee: | $166,418 |
| Massachusetts: | $140,113 |
Number of families with income $20k - 30k:| Mashpee: | 39.9% (6) |
| Massachusetts: | 2.3% (2,708) |
Number of families with income $75k - 100k:| Mashpee: | 60.1% (10) |
| State: | 8.5% (10,022) |
Median per capita income in Mashpee in 2022:| Mashpee: | $98,055 |
| Massachusetts: | $58,900 |
Income statistics for Hispanic or Latino residents
Median household income in Mashpee, MA in 2022:| Mashpee: | $108,365 |
| State: | $61,523 |
Change in median household income between 2000 and 2022:| Mashpee, Massachusetts: | +147.7% |
| Massachusetts: | +125.4% |
Number of households with income < $10k:| Mashpee: | 8.8% (40,556) |
| State: | 8.8% (25,307) |
Number of households with income $10k - 20k:| Mashpee: | 10.0% (45,918) |
| Massachusetts: | 10.0% (28,653) |
Number of households with income $20k - 30k:| Mashpee: | 8.8% (40,367) |
| Massachusetts: | 8.8% (25,189) |
Number of households with income $30k - 40k:| Mashpee: | 7.2% (33,368) |
| State: | 7.2% (20,822) |
Number of households with income $40k - 50k:| Mashpee: | 7.2% (33,360) |
| Massachusetts: | 7.2% (20,817) |
Number of households with income $50k - 60k:| Mashpee: | 6.5% (30,045) |
| State: | 6.5% (18,748) |
Number of households with income $60k - 75k:| Mashpee: | 8.8% (40,689) |
| State: | 8.8% (25,390) |
Number of households with income $75k - 100k:| Mashpee: | 12.0% (55,269) |
| Massachusetts: | 12.0% (34,488) |
Number of households with income $100k - 125k:| Mashpee: | 8.6% (39,421) |
| State: | 8.6% (24,599) |
Number of households with income $125k - 150k:| Mashpee: | 6.2% (28,434) |
| State: | 6.2% (17,743) |
Number of households with income $150k - 200k:| Mashpee: | 7.3% (33,681) |
| State: | 7.3% (21,017) |
Number of households with income > $200k:| Mashpee: | 8.6% (39,433) |
| Massachusetts: | 8.6% (24,606) |
Aggregate household income in Mashpee in 2022: $16,823,829
Median family income in Mashpee in 2022:| Mashpee: | $95,563 |
| State: | $66,072 |
Number of families with income < $10k:| Mashpee: | 6.1% (28) |
| Massachusetts: | 6.2% (12,456) |
Number of families with income $10k - 20k:| Mashpee: | 5.9% (28) |
| State: | 6.0% (12,071) |
Number of families with income $20k - 30k:| Mashpee: | 9.4% (44) |
| State: | 10.1% (20,376) |
Number of families with income $30k - 40k:| Mashpee: | 10.6% (49) |
| Massachusetts: | 8.2% (16,470) |
Number of families with income $40k - 50k:| Mashpee: | 12.4% (58) |
| State: | 7.4% (14,829) |
Number of families with income $50k - 60k:| Mashpee: | 9.0% (42) |
| State: | 7.3% (14,643) |
Number of families with income $60k - 75k:| Mashpee: | 11.8% (55) |
| Massachusetts: | 10.6% (21,252) |
Number of families with income $75k - 100k:| Mashpee: | 13.2% (61) |
| State: | 12.0% (24,088) |
Number of families with income $100k - 125k:| Mashpee: | 7.3% (34) |
| Massachusetts: | 8.9% (17,954) |
Number of families with income $125k - 150k:| Mashpee: | 4.9% (23) |
| State: | 6.9% (13,837) |
Number of families with income $150k - 200k:| Mashpee: | 3.3% (15) |
| State: | 7.3% (14,683) |
Number of families with income > $200k:| Mashpee: | 6.0% (28) |
| Massachusetts: | 9.3% (18,741) |
Median non-family income in Mashpee in 2022:| Mashpee: | $195,339 |
| Massachusetts: | $37,563 |
Median per capita income in Mashpee in 2022:| Mashpee: | $33,692 |
| State: | $28,993 |
Change in median per capita income between 2000 and 2022:| Mashpee, Massachusetts: | +111.4% |
| Massachusetts: | +142.4% |
Income statistics for American Indian and Alaska Native residents
Median household income in Mashpee, MA in 2022:| Mashpee: | $190,940 |
| State: | $87,730 |
Number of households with income < $10k:| Mashpee: | 6.6% (620) |
| State: | 6.6% (451) |
Number of households with income $10k - 20k:| Mashpee: | 7.0% (655) |
| State: | 7.0% (476) |
Number of households with income $20k - 30k:| Mashpee: | 2.8% (264) |
| Massachusetts: | 2.8% (192) |
Number of households with income $30k - 40k:| Mashpee: | 3.2% (300) |
| State: | 3.2% (218) |
Number of households with income $40k - 50k:| Mashpee: | 2.9% (274) |
| State: | 2.9% (199) |
Number of households with income $50k - 60k:| Mashpee: | 9.9% (931) |
| State: | 9.9% (677) |
Number of households with income $60k - 75k:| Mashpee: | 11.5% (1,074) |
| Massachusetts: | 11.5% (781) |
Number of households with income $75k - 100k:| Mashpee: | 9.2% (865) |
| State: | 9.2% (629) |
Number of households with income $100k - 125k:| Mashpee: | 6.0% (558) |
| State: | 6.0% (406) |
Number of households with income $125k - 150k:| Mashpee: | 13.5% (1,267) |
| Massachusetts: | 13.5% (921) |
Number of households with income $150k - 200k:| Mashpee: | 12.6% (1,181) |
| State: | 12.6% (859) |
Number of households with income > $200k:| Mashpee: | 14.7% (1,379) |
| State: | 14.7% (1,003) |
Aggregate household income in Mashpee in 2022: $12,055,647
Median family income in Mashpee in 2022:| Mashpee: | $134,559 |
| State: | $105,715 |
Number of families with income < $10k:| Mashpee: | 2.8% (4) |
| State: | 5.9% (188) |
Number of families with income $10k - 20k:| Mashpee: | 3.7% (5) |
| State: | 11.4% (365) |
Number of families with income $20k - 30k:| Mashpee: | 3.5% (5) |
| State: | 6.0% (193) |
Number of families with income $30k - 40k:| Mashpee: | 4.8% (7) |
| State: | 8.2% (263) |
Number of families with income $40k - 50k:| Mashpee: | 6.5% (9) |
| State: | 4.3% (139) |
Number of families with income $50k - 60k:| Mashpee: | 10.7% (14) |
| Massachusetts: | 6.4% (204) |
Number of families with income $60k - 75k:| Mashpee: | 35.4% (48) |
| State: | 14.7% (471) |
Number of families with income $75k - 100k:| Mashpee: | 14.1% (19) |
| State: | 9.3% (297) |
Number of families with income $100k - 125k:| Mashpee: | 18.6% (25) |
| Massachusetts: | 8.9% (285) |
Median non-family income in Mashpee in 2022:| Mashpee: | $263,430 |
| State: | $75,379 |
Median per capita income in Mashpee in 2022:| Mashpee: | $48,206 |
| State: | $39,434 |
Income statistics for Multirace residents
Median household income in Mashpee, MA in 2022:| Mashpee: | $57,069 |
| State: | $71,552 |
Change in median household income between 2000 and 2022:| Mashpee, Massachusetts: | +129.9% |
| State: | +109.0% |
Number of households with income < $10k:| Mashpee: | 6.6% (5,519) |
| State: | 6.6% (15,127) |
Number of households with income $10k - 20k:| Mashpee: | 9.3% (7,758) |
| State: | 9.2% (21,158) |
Number of households with income $20k - 30k:| Mashpee: | 7.8% (6,539) |
| Massachusetts: | 7.8% (18,016) |
Number of households with income $30k - 40k:| Mashpee: | 8.0% (6,670) |
| Massachusetts: | 7.9% (18,260) |
Number of households with income $40k - 50k:| Mashpee: | 5.7% (4,734) |
| State: | 5.6% (13,027) |
Number of households with income $50k - 60k:| Mashpee: | 5.6% (4,686) |
| State: | 5.6% (12,909) |
Number of households with income $60k - 75k:| Mashpee: | 9.0% (7,537) |
| Massachusetts: | 9.0% (20,800) |
Number of households with income $75k - 100k:| Mashpee: | 12.1% (10,170) |
| Massachusetts: | 12.1% (27,875) |
Number of households with income $100k - 125k:| Mashpee: | 8.1% (6,795) |
| State: | 8.1% (18,754) |
Number of households with income $125k - 150k:| Mashpee: | 6.8% (5,662) |
| State: | 6.8% (15,621) |
Number of households with income $150k - 200k:| Mashpee: | 9.2% (7,743) |
| State: | 9.4% (21,618) |
Number of households with income > $200k:| Mashpee: | 11.8% (9,916) |
| State: | 12.0% (27,592) |
Aggregate household income in Mashpee in 2022: $23,455,613
Median family income in Mashpee in 2022:| Mashpee: | $63,690 |
| State: | $78,380 |
Number of families with income < $10k:| Mashpee: | 13.8% (21) |
| State: | 4.5% (7,017) |
Number of families with income $20k - 30k:| Mashpee: | 31.8% (49) |
| State: | 8.5% (13,245) |
Number of families with income $30k - 40k:| Mashpee: | 35.3% (55) |
| State: | 8.2% (12,705) |
Number of families with income $40k - 50k:| Mashpee: | 8.3% (13) |
| Massachusetts: | 5.3% (8,255) |
Number of families with income $50k - 60k:| Mashpee: | 10.8% (17) |
| State: | 6.7% (10,445) |
Median non-family income in Mashpee in 2022:| Mashpee: | $47,325 |
| State: | $42,253 |
Median per capita income in Mashpee in 2022:| Mashpee: | $23,053 |
| State: | $34,029 |
Change in median per capita income between 2000 and 2022:| Mashpee, Massachusetts: | +103.4% |
| Massachusetts: | +132.1% |
Income statistics for other residents
Number of households with income < $10k:| Mashpee: | 8.7% (13) |
| State: | 8.4% (11,559) |
Number of households with income $10k - 20k:| Mashpee: | 8.7% (13) |
| State: | 8.4% (11,499) |
Number of households with income $20k - 30k:| Mashpee: | 9.4% (14) |
| Massachusetts: | 9.5% (13,070) |
Number of households with income $30k - 40k:| Mashpee: | 6.0% (9) |
| Massachusetts: | 6.0% (8,291) |
Number of households with income $40k - 50k:| Mashpee: | 8.7% (13) |
| State: | 9.2% (12,611) |
Number of households with income $50k - 60k:| Mashpee: | 8.1% (12) |
| Massachusetts: | 7.9% (10,879) |
Number of households with income $60k - 75k:| Mashpee: | 7.4% (11) |
| State: | 7.5% (10,239) |
Number of households with income $75k - 100k:| Mashpee: | 13.4% (20) |
| Massachusetts: | 13.1% (18,032) |
Number of households with income $100k - 125k:| Mashpee: | 9.4% (14) |
| Massachusetts: | 9.6% (13,141) |
Number of households with income $125k - 150k:| Mashpee: | 4.7% (7) |
| State: | 5.0% (6,808) |
Number of households with income $150k - 200k:| Mashpee: | 6.7% (10) |
| Massachusetts: | 6.4% (8,843) |
Number of households with income > $200k:| Mashpee: | 8.7% (13) |
| State: | 9.0% (12,396) |
Aggregate household income in Mashpee in 2022: $9,502,683
Median family income in Mashpee in 2022:| Mashpee: | $220,680 |
| Massachusetts: | $66,840 |
Number of families with income $10k - 20k:| Mashpee: | 6.3% (5) |
| State: | 4.7% (4,798) |
Number of families with income $20k - 30k:| Mashpee: | 10.7% (9) |
| Massachusetts: | 10.4% (10,595) |
Number of families with income $40k - 50k:| Mashpee: | 14.9% (12) |
| State: | 8.9% (9,052) |
Number of families with income $60k - 75k:| Mashpee: | 20.2% (17) |
| Massachusetts: | 8.5% (8,683) |
Number of families with income $75k - 100k:| Mashpee: | 47.9% (40) |
| State: | 12.8% (12,997) |
Median non-family income in Mashpee in 2022:| Mashpee: | $48,404 |
| State: | $36,127 |
Median per capita income in Mashpee in 2022:| Mashpee: | $29,767 |
| State: | $30,797 |
Change in median per capita income between 2000 and 2022:| Mashpee, Massachusetts: | +91.6% |
| State: | +188.5% |