The median household income in Needham, MA in 2022 was $198,306, which was 52.4% greater than the median annual income of $94,488 across the entire state of Massachusetts. Compared to the median income of $88,079 in 2000 this represents an increase of 55.6%. The per capita income in 2022 was $94,633, which means an increase of 52.9% compared to 2000 when it was $44,549.
Whole page based on the data from 2000 / 2022 when the population of Needham, Massachusetts was 28,911 / 32,108
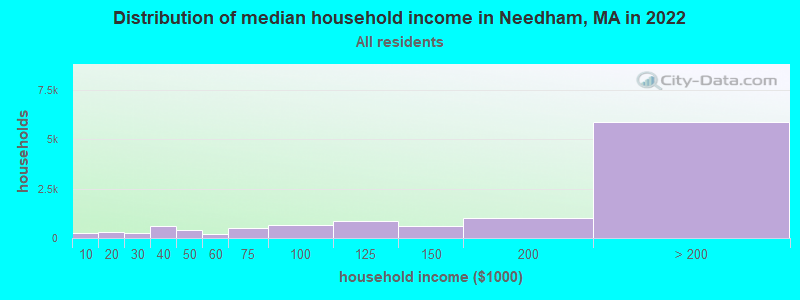
Income statistics for all residents
Median household income in Needham, MA in 2022:
Needham:
$198,306
State:
$94,488
Change in median household income between 2000 and 2022:
Needham, Massachusetts:
+125.1%
State:
+87.1%
Number of households with income < $10k:
Needham:
2.1% (238)
Massachusetts:
5.2% (146,170)
Number of households with income $10k - 20k:
Needham:
2.6% (296)
State:
6.4% (180,001)
Number of households with income $20k - 30k:
Needham:
2.1% (236)
State:
5.6% (156,667)
Number of households with income $30k - 40k:
Needham:
5.4% (618)
Massachusetts:
5.6% (157,168)
Number of households with income $40k - 50k:
Needham:
3.3% (382)
State:
5.4% (151,455)
Number of households with income $50k - 60k:
Needham:
1.8% (201)
Massachusetts:
5.1% (142,726)
Number of households with income $60k - 75k:
Needham:
4.4% (502)
State:
7.6% (212,203)
Number of households with income $75k - 100k:
Needham:
5.7% (648)
Massachusetts:
11.3% (317,064)
Number of households with income $100k - 125k:
Needham:
7.5% (854)
State:
9.7% (270,603)
Number of households with income $125k - 150k:
Needham:
5.3% (604)
State:
8.0% (223,140)
Number of households with income $150k - 200k:
Needham:
8.9% (1,017)
State:
11.0% (308,695)
Number of households with income > $200k:
Needham:
51.2% (5,864)
Massachusetts:
19.0% (531,884)
Aggregate household income in Needham in 2022: $3,028,420,822
Median family income in Needham in 2022:
Needham:
$242,647
State:
$120,263
Number of families with income < $10k:
Needham:
1.1% (97)
State:
2.9% (49,671)
Number of families with income $10k - 20k:
Needham:
0.7% (67)
State:
2.9% (50,542)
Number of families with income $20k - 30k:
Needham:
1.2% (105)
Massachusetts:
3.9% (66,398)
Number of families with income $30k - 40k:
Needham:
2.5% (230)
State:
4.5% (78,234)
Number of families with income $40k - 50k:
Needham:
2.6% (230)
State:
4.5% (77,656)
Number of families with income $50k - 60k:
Needham:
1.0% (86)
State:
4.5% (77,928)
Number of families with income $60k - 75k:
Needham:
3.1% (276)
Massachusetts:
7.0% (120,295)
Number of families with income $75k - 100k:
Needham:
6.3% (571)
State:
11.1% (192,172)
Number of families with income $100k - 125k:
Needham:
6.3% (567)
State:
10.6% (182,105)
Number of families with income $125k - 150k:
Needham:
4.8% (430)
State:
9.3% (159,566)
Number of families with income $150k - 200k:
Needham:
8.6% (775)
Massachusetts:
13.4% (231,410)
Number of families with income > $200k:
Needham:
61.9% (5,585)
State:
25.4% (438,378)
Median non-family income in Needham in 2022:
Needham:
$68,581
Massachusetts:
$55,979
Change in median non-family income between 2000 and 2022:
Needham, Massachusetts:
+81.2%
Massachusetts:
+88.0%
Median per capita income in Needham in 2022:
Needham:
$94,634
State:
$54,025
Change in median per capita income between 2000 and 2022:
Needham, Massachusetts:
+112.4%
Massachusetts:
+108.2%
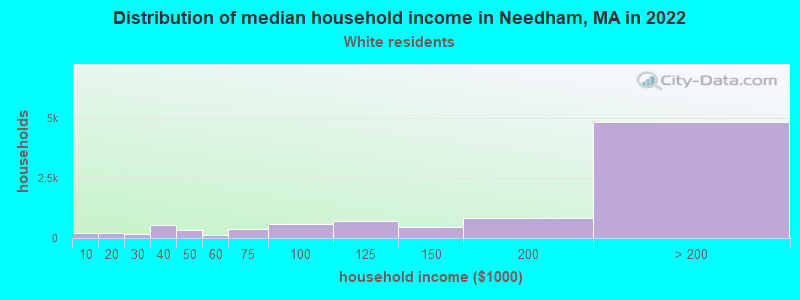
Income statistics for White residents
Median household income in Needham, MA in 2022:
Needham:
$195,767
State:
$101,391
Change in median household income between 2000 and 2022:
Needham, Massachusetts:
+124.0%
Massachusetts:
+93.3%
Number of households with income < $10k:
Needham:
2.2% (208)
State:
4.4% (91,120)
Number of households with income $10k - 20k:
Needham:
2.3% (217)
Massachusetts:
5.9% (122,055)
Number of households with income $20k - 30k:
Needham:
1.8% (174)
Massachusetts:
5.1% (105,311)
Number of households with income $30k - 40k:
Needham:
5.8% (553)
State:
5.3% (110,239)
Number of households with income $40k - 50k:
Needham:
3.5% (337)
Massachusetts:
5.0% (104,636)
Number of households with income $50k - 60k:
Needham:
1.5% (143)
State:
4.8% (99,486)
Number of households with income $60k - 75k:
Needham:
4.0% (379)
State:
7.5% (155,124)
Number of households with income $75k - 100k:
Needham:
6.4% (603)
Massachusetts:
11.4% (236,252)
Number of households with income $100k - 125k:
Needham:
7.7% (729)
State:
9.9% (204,731)
Number of households with income $125k - 150k:
Needham:
5.0% (472)
State:
8.5% (175,324)
Number of households with income $150k - 200k:
Needham:
8.9% (843)
State:
11.7% (242,980)
Number of households with income > $200k:
Needham:
50.9% (4,835)
Massachusetts:
20.5% (425,966)
Aggregate household income in Needham in 2022: $2,494,773,401
Median family income in Needham in 2022:
Needham:
$243,403
State:
$133,153
Number of families with income < $10k:
Needham:
1.0% (75)
Massachusetts:
2.0% (25,038)
Number of families with income $10k - 20k:
Needham:
0.2% (16)
State:
2.1% (26,403)
Number of families with income $20k - 30k:
Needham:
1.2% (91)
State:
2.6% (32,525)
Number of families with income $30k - 40k:
Needham:
2.3% (171)
Massachusetts:
3.9% (48,079)
Number of families with income $40k - 50k:
Needham:
2.7% (199)
State:
3.8% (46,908)
Number of families with income $50k - 60k:
Needham:
1.1% (81)
State:
3.8% (46,476)
Number of families with income $60k - 75k:
Needham:
2.1% (157)
Massachusetts:
6.4% (79,040)
Number of families with income $75k - 100k:
Needham:
6.9% (506)
State:
11.1% (137,395)
Number of families with income $100k - 125k:
Needham:
6.6% (488)
Massachusetts:
11.1% (136,771)
Number of families with income $125k - 150k:
Needham:
4.8% (349)
State:
10.0% (123,709)
Number of families with income $150k - 200k:
Needham:
8.4% (618)
State:
14.7% (181,602)
Number of families with income > $200k:
Needham:
62.5% (4,590)
Massachusetts:
28.5% (351,887)
Median non-family income in Needham in 2022:
Needham:
$69,186
Massachusetts:
$59,323
Change in median non-family income between 2000 and 2022:
Needham, Massachusetts:
+79.7%
State:
+94.3%
Median per capita income in Needham in 2022:
Needham:
$96,446
Massachusetts:
$60,804
Change in median per capita income between 2000 and 2022:
Needham, Massachusetts:
+113.3%
State:
+118.7%
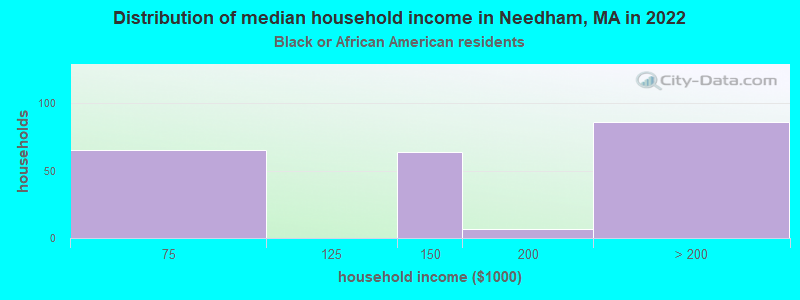
Income statistics for Black or African American residents
Number of households with income < $10k:
Needham:
0.0% (0)
State:
9.1% (15,797)
Number of households with income $10k - 20k:
Needham:
0.0% (0)
State:
9.4% (16,267)
Number of households with income $20k - 30k:
Needham:
0.0% (0)
Massachusetts:
7.8% (13,520)
Number of households with income $30k - 40k:
Needham:
0.0% (0)
State:
8.3% (14,412)
Number of households with income $40k - 50k:
Needham:
0.0% (0)
State:
7.9% (13,790)
Number of households with income $50k - 60k:
Needham:
0.0% (0)
State:
5.8% (10,041)
Number of households with income $60k - 75k:
Needham:
29.3% (65)
Massachusetts:
8.5% (14,822)
Number of households with income $75k - 100k:
Needham:
0.0% (0)
State:
11.0% (19,122)
Number of households with income $100k - 125k:
Needham:
0.0% (0)
State:
8.4% (14,575)
Number of households with income $125k - 150k:
Needham:
28.8% (64)
Massachusetts:
6.0% (10,429)
Number of households with income $150k - 200k:
Needham:
3.2% (7)
State:
7.2% (12,539)
Number of households with income > $200k:
Needham:
38.7% (86)
State:
10.5% (18,185)
Aggregate household income in Needham in 2022: $69,799,810
Median family income in Needham in 2022:
Needham:
$122,088
State:
$79,815
Number of families with income $60k - 75k:
Needham:
33.8% (69)
State:
7.9% (8,699)
Number of families with income $100k - 125k:
Needham:
9.3% (19)
State:
10.4% (11,452)
Number of families with income $125k - 150k:
Needham:
28.2% (58)
State:
7.5% (8,277)
Number of families with income $150k - 200k:
Needham:
2.6% (5)
State:
9.3% (10,230)
Number of families with income > $200k:
Needham:
26.1% (54)
State:
12.9% (14,108)
Median per capita income in Needham in 2022:
Needham:
$101,478
Massachusetts:
$33,524
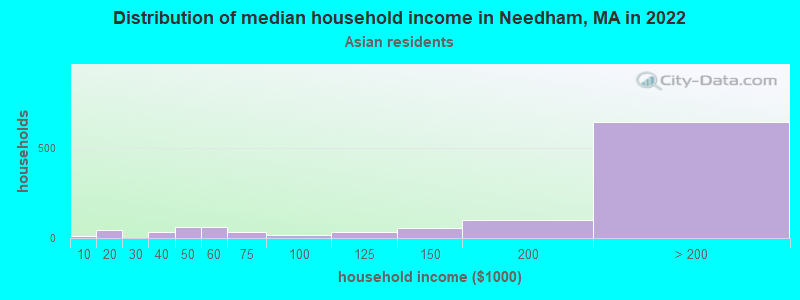
Income statistics for Asian residents
Median household income in Needham, MA in 2022:
Needham:
$236,759
State:
$117,855
Change in median household income between 2000 and 2022:
Needham, Massachusetts:
+124.2%
State:
+129.9%
Number of households with income < $10k:
Needham:
1.2% (13)
Massachusetts:
6.8% (11,982)
Number of households with income $10k - 20k:
Needham:
3.9% (43)
State:
4.8% (8,376)
Number of households with income $20k - 30k:
Needham:
0.0% (0)
State:
3.7% (6,558)
Number of households with income $30k - 40k:
Needham:
3.3% (36)
State:
3.3% (5,748)
Number of households with income $40k - 50k:
Needham:
5.5% (60)
State:
4.1% (7,192)
Number of households with income $50k - 60k:
Needham:
5.4% (59)
State:
5.0% (8,734)
Number of households with income $60k - 75k:
Needham:
3.2% (35)
State:
5.8% (10,203)
Number of households with income $75k - 100k:
Needham:
1.6% (18)
Massachusetts:
8.6% (15,154)
Number of households with income $100k - 125k:
Needham:
2.9% (32)
Massachusetts:
10.8% (18,942)
Number of households with income $125k - 150k:
Needham:
5.2% (57)
State:
8.0% (14,037)
Number of households with income $150k - 200k:
Needham:
9.2% (101)
State:
12.5% (21,856)
Number of households with income > $200k:
Needham:
58.7% (645)
Massachusetts:
26.6% (46,694)
Aggregate household income in Needham in 2022: $278,960,834
Median family income in Needham in 2022:
Needham:
$252,065
Massachusetts:
$140,113
Number of families with income $10k - 20k:
Needham:
2.5% (23)
State:
3.5% (4,118)
Number of families with income $30k - 40k:
Needham:
5.3% (50)
State:
2.8% (3,234)
Number of families with income $40k - 50k:
Needham:
4.2% (39)
State:
3.9% (4,621)
Number of families with income $60k - 75k:
Needham:
3.7% (35)
State:
6.1% (7,105)
Number of families with income $75k - 100k:
Needham:
2.4% (23)
State:
8.5% (10,022)
Number of families with income $100k - 125k:
Needham:
1.1% (11)
State:
10.0% (11,697)
Number of families with income $125k - 150k:
Needham:
2.8% (27)
State:
8.6% (10,071)
Number of families with income $150k - 200k:
Needham:
10.1% (95)
State:
13.2% (15,478)
Number of families with income > $200k:
Needham:
67.7% (637)
Massachusetts:
34.0% (39,856)
Median non-family income in Needham in 2022:
Needham:
$50,538
State:
$71,440
Change in median non-family income between 2000 and 2022:
Needham, Massachusetts:
+39.0%
State:
+128.0%
Median per capita income in Needham in 2022:
Needham:
$90,846
State:
$58,900
Change in median per capita income between 2000 and 2022:
Needham, Massachusetts:
+131.9%
Massachusetts:
+174.6%
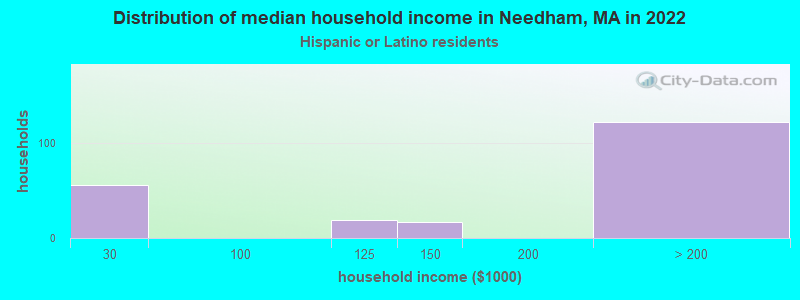
Income statistics for Hispanic or Latino residents
Median household income in Needham, MA in 2022:
Needham:
$211,819
State:
$61,523
Number of households with income < $10k:
Needham:
0.0% (0)
State:
8.8% (25,307)
Number of households with income $10k - 20k:
Needham:
0.0% (0)
Massachusetts:
10.0% (28,653)
Number of households with income $20k - 30k:
Needham:
26.2% (56)
Massachusetts:
8.8% (25,189)
Number of households with income $30k - 40k:
Needham:
0.0% (0)
State:
7.2% (20,822)
Number of households with income $40k - 50k:
Needham:
0.0% (0)
Massachusetts:
7.2% (20,817)
Number of households with income $50k - 60k:
Needham:
0.0% (0)
State:
6.5% (18,748)
Number of households with income $60k - 75k:
Needham:
0.0% (0)
Massachusetts:
8.8% (25,390)
Number of households with income $75k - 100k:
Needham:
0.0% (0)
Massachusetts:
12.0% (34,488)
Number of households with income $100k - 125k:
Needham:
8.9% (19)
State:
8.6% (24,599)
Number of households with income $125k - 150k:
Needham:
7.9% (17)
Massachusetts:
6.2% (17,743)
Number of households with income $150k - 200k:
Needham:
0.0% (0)
State:
7.3% (21,017)
Number of households with income > $200k:
Needham:
57.0% (122)
Massachusetts:
8.6% (24,606)
Aggregate household income in Needham in 2022: $55,511,545
Median family income in Needham in 2022:
Needham:
$245,252
State:
$66,072
Number of families with income $20k - 30k:
Needham:
6.7% (15)
Massachusetts:
10.1% (20,376)
Number of families with income $100k - 125k:
Needham:
9.8% (22)
State:
8.9% (17,954)
Number of families with income $125k - 150k:
Needham:
14.3% (32)
Massachusetts:
6.9% (13,837)
Number of families with income > $200k:
Needham:
69.2% (153)
State:
9.3% (18,741)
Median per capita income in Needham in 2022:
Needham:
$69,233
State:
$28,993
Income statistics for American Indian and Alaska Native residents
Number of households with income < $10k:
Needham:
0.0% (0)
State:
6.6% (451)
Number of households with income $10k - 20k:
Needham:
0.0% (0)
State:
7.0% (476)
Number of households with income $20k - 30k:
Needham:
0.0% (0)
State:
2.8% (192)
Number of households with income $30k - 40k:
Needham:
0.0% (0)
Massachusetts:
3.2% (218)
Number of households with income $40k - 50k:
Needham:
0.0% (0)
State:
2.9% (199)
Number of households with income $50k - 60k:
Needham:
0.0% (0)
State:
9.9% (677)
Number of households with income $60k - 75k:
Needham:
0.0% (0)
Massachusetts:
11.5% (781)
Number of households with income $75k - 100k:
Needham:
0.0% (0)
State:
9.2% (629)
Number of households with income $100k - 125k:
Needham:
0.0% (0)
State:
6.0% (406)
Number of households with income $125k - 150k:
Needham:
100.0% (14)
State:
13.5% (921)
Number of households with income $150k - 200k:
Needham:
0.0% (0)
State:
12.6% (859)
Number of households with income > $200k:
Needham:
0.0% (0)
State:
14.7% (1,003)
Aggregate household income in Needham in 2022: $854,915
Median per capita income in Needham in 2022:
Needham:
$67,783
State:
$39,434
Income statistics for Multirace residents
Median household income in Needham, MA in 2022:
Needham:
$233,762
Massachusetts:
$71,552
Change in median household income between 2000 and 2022:
Needham, Massachusetts:
+120.0%
State:
+109.0%
Number of households with income < $10k:
Needham:
0.0% (0)
State:
6.6% (15,127)
Number of households with income $10k - 20k:
Needham:
4.0% (17)
State:
9.2% (21,158)
Number of households with income $20k - 30k:
Needham:
3.7% (16)
Massachusetts:
7.8% (18,016)
Number of households with income $30k - 40k:
Needham:
0.0% (0)
State:
7.9% (18,260)
Number of households with income $40k - 50k:
Needham:
0.0% (0)
State:
5.6% (13,027)
Number of households with income $50k - 60k:
Needham:
0.0% (0)
Massachusetts:
5.6% (12,909)
Number of households with income $60k - 75k:
Needham:
0.0% (0)
State:
9.0% (20,800)
Number of households with income $75k - 100k:
Needham:
8.1% (35)
State:
12.1% (27,875)
Number of households with income $100k - 125k:
Needham:
14.9% (64)
Massachusetts:
8.1% (18,754)
Number of households with income $125k - 150k:
Needham:
3.0% (13)
State:
6.8% (15,621)
Number of households with income $150k - 200k:
Needham:
6.5% (28)
Massachusetts:
9.4% (21,618)
Number of households with income > $200k:
Needham:
59.8% (257)
State:
12.0% (27,592)
Aggregate household income in Needham in 2022: $140,161,049
Median family income in Needham in 2022:
Needham:
$224,165
Massachusetts:
$78,380
Number of families with income $10k - 20k:
Needham:
6.6% (26)
Massachusetts:
4.9% (7,678)
Number of families with income $20k - 30k:
Needham:
5.2% (20)
State:
8.5% (13,245)
Number of families with income $75k - 100k:
Needham:
10.8% (43)
State:
12.1% (18,758)
Number of families with income $100k - 125k:
Needham:
6.8% (27)
State:
7.9% (12,321)
Number of families with income $125k - 150k:
Needham:
4.9% (19)
Massachusetts:
7.2% (11,128)
Number of families with income $150k - 200k:
Needham:
9.0% (36)
State:
10.3% (15,978)
Number of families with income > $200k:
Needham:
56.7% (223)
State:
14.0% (21,838)
Median per capita income in Needham in 2022:
Needham:
$93,159
Massachusetts:
$34,029
Income statistics for other residents
Median per capita income in Needham in 2022:
Needham:
$28,624
State:
$30,797
Discuss Needham, Massachusetts (MA) on our hugely popular Massachusetts forum.