Raynham, Massachusetts (MA) income map, earnings map, and wages data
The median household income in Raynham, MA in 2022 was $113,336, which was 16.6% greater than the median annual income of $94,488 across the entire state of Massachusetts. Compared to the median income of $60,449 in 2000 this represents an increase of 46.7%. The per capita income in 2022 was $49,908, which means an increase of 51.0% compared to 2000 when it was $24,476.
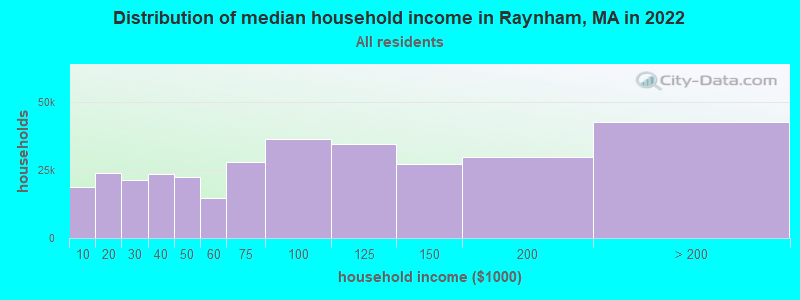
Income statistics for all residents
Median household income in Raynham, MA in 2022:| Raynham: | $113,336 |
| State: | $94,488 |
Change in median household income between 2000 and 2022:| Raynham, Massachusetts: | +87.5% |
| State: | +87.1% |
Number of households with income < $10k:| Raynham: | 5.8% (18,905) |
| State: | 5.2% (146,170) |
Number of households with income $10k - 20k:| Raynham: | 7.3% (23,758) |
| Massachusetts: | 6.4% (180,001) |
Number of households with income $20k - 30k:| Raynham: | 6.6% (21,379) |
| State: | 5.6% (156,667) |
Number of households with income $30k - 40k:| Raynham: | 7.3% (23,729) |
| State: | 5.6% (157,168) |
Number of households with income $40k - 50k:| Raynham: | 6.9% (22,319) |
| State: | 5.4% (151,455) |
Number of households with income $50k - 60k:| Raynham: | 4.6% (14,808) |
| State: | 5.1% (142,726) |
Number of households with income $60k - 75k:| Raynham: | 8.6% (27,908) |
| Massachusetts: | 7.6% (212,203) |
Number of households with income $75k - 100k:| Raynham: | 11.3% (36,516) |
| State: | 11.3% (317,064) |
Number of households with income $100k - 125k:| Raynham: | 10.7% (34,655) |
| State: | 9.7% (270,603) |
Number of households with income $125k - 150k:| Raynham: | 8.5% (27,412) |
| State: | 8.0% (223,140) |
Number of households with income $150k - 200k:| Raynham: | 9.2% (29,976) |
| State: | 11.0% (308,695) |
Number of households with income > $200k:| Raynham: | 13.2% (42,720) |
| Massachusetts: | 19.0% (531,884) |
Aggregate household income in Raynham in 2022: $3,245,121,586
Median family income in Raynham in 2022:| Raynham: | $137,429 |
| Massachusetts: | $120,263 |
Median non-family income in Raynham in 2022:| Raynham: | $67,565 |
| State: | $55,979 |
Change in median non-family income between 2000 and 2022:| Raynham, Massachusetts: | +93.6% |
| Massachusetts: | +88.0% |
Median per capita income in Raynham in 2022:| Raynham: | $49,909 |
| Massachusetts: | $54,025 |
Change in median per capita income between 2000 and 2022:| Raynham, Massachusetts: | +103.9% |
| State: | +108.2% |
Income statistics for White residents
Median household income in Raynham, MA in 2022:| Raynham: | $116,269 |
| Massachusetts: | $101,391 |
Change in median household income between 2000 and 2022:| Raynham, Massachusetts: | +92.2% |
| Massachusetts: | +93.3% |
Number of households with income < $10k:| Raynham: | 5.5% (14,068) |
| State: | 4.4% (91,120) |
Number of households with income $10k - 20k:| Raynham: | 7.4% (19,015) |
| State: | 5.9% (122,055) |
Number of households with income $20k - 30k:| Raynham: | 6.3% (16,112) |
| State: | 5.1% (105,311) |
Number of households with income $30k - 40k:| Raynham: | 6.8% (17,424) |
| Massachusetts: | 5.3% (110,239) |
Number of households with income $40k - 50k:| Raynham: | 7.0% (17,982) |
| Massachusetts: | 5.0% (104,636) |
Number of households with income $50k - 60k:| Raynham: | 4.3% (11,095) |
| State: | 4.8% (99,486) |
Number of households with income $60k - 75k:| Raynham: | 8.5% (21,732) |
| State: | 7.5% (155,124) |
Number of households with income $75k - 100k:| Raynham: | 10.7% (27,567) |
| State: | 11.4% (236,252) |
Number of households with income $100k - 125k:| Raynham: | 11.0% (28,377) |
| Massachusetts: | 9.9% (204,731) |
Number of households with income $125k - 150k:| Raynham: | 8.7% (22,331) |
| State: | 8.5% (175,324) |
Number of households with income $150k - 200k:| Raynham: | 9.8% (25,255) |
| Massachusetts: | 11.7% (242,980) |
Number of households with income > $200k:| Raynham: | 14.0% (35,921) |
| State: | 20.5% (425,966) |
Aggregate household income in Raynham in 2022: $2,567,685,762
Median family income in Raynham in 2022:| Raynham: | $139,488 |
| State: | $133,153 |
Number of families with income < $10k:| Raynham: | 1.5% (49) |
| State: | 2.0% (25,038) |
Number of families with income $10k - 20k:| Raynham: | 0.9% (29) |
| State: | 2.1% (26,403) |
Number of families with income $20k - 30k:| Raynham: | 2.4% (77) |
| State: | 2.6% (32,525) |
Number of families with income $30k - 40k:| Raynham: | 3.5% (113) |
| Massachusetts: | 3.9% (48,079) |
Number of families with income $40k - 50k:| Raynham: | 3.6% (114) |
| State: | 3.8% (46,908) |
Number of families with income $50k - 60k:| Raynham: | 4.6% (149) |
| State: | 3.8% (46,476) |
Number of families with income $60k - 75k:| Raynham: | 7.1% (229) |
| State: | 6.4% (79,040) |
Number of families with income $75k - 100k:| Raynham: | 12.4% (397) |
| Massachusetts: | 11.1% (137,395) |
Number of families with income $100k - 125k:| Raynham: | 20.6% (662) |
| Massachusetts: | 11.1% (136,771) |
Number of families with income $125k - 150k:| Raynham: | 13.5% (433) |
| Massachusetts: | 10.0% (123,709) |
Number of families with income $150k - 200k:| Raynham: | 15.5% (496) |
| State: | 14.7% (181,602) |
Number of families with income > $200k:| Raynham: | 14.3% (459) |
| Massachusetts: | 28.5% (351,887) |
Median non-family income in Raynham in 2022:| Raynham: | $63,031 |
| State: | $59,323 |
Change in median non-family income between 2000 and 2022:| Raynham, Massachusetts: | +92.7% |
| State: | +94.3% |
Median per capita income in Raynham in 2022:| Raynham: | $52,126 |
| State: | $60,804 |
Change in median per capita income between 2000 and 2022:| Raynham, Massachusetts: | +115.0% |
| State: | +118.7% |
Income statistics for Black or African American residents
Median household income in Raynham, MA in 2022:| Raynham: | $47,304 |
| Massachusetts: | $63,189 |
Change in median household income between 2000 and 2022:| Raynham, Massachusetts: | +138.9% |
| Massachusetts: | +87.4% |
Number of households with income < $10k:| Raynham: | 13.0% (931) |
| State: | 9.1% (15,797) |
Number of households with income $10k - 20k:| Raynham: | 5.4% (388) |
| State: | 9.4% (16,267) |
Number of households with income $20k - 30k:| Raynham: | 3.7% (265) |
| State: | 7.8% (13,520) |
Number of households with income $30k - 40k:| Raynham: | 10.3% (737) |
| Massachusetts: | 8.3% (14,412) |
Number of households with income $40k - 50k:| Raynham: | 7.7% (549) |
| State: | 7.9% (13,790) |
Number of households with income $50k - 60k:| Raynham: | 5.0% (359) |
| State: | 5.8% (10,041) |
Number of households with income $60k - 75k:| Raynham: | 9.4% (673) |
| State: | 8.5% (14,822) |
Number of households with income $75k - 100k:| Raynham: | 11.7% (835) |
| Massachusetts: | 11.0% (19,122) |
Number of households with income $100k - 125k:| Raynham: | 11.9% (853) |
| Massachusetts: | 8.4% (14,575) |
Number of households with income $125k - 150k:| Raynham: | 6.7% (481) |
| State: | 6.0% (10,429) |
Number of households with income $150k - 200k:| Raynham: | 5.8% (417) |
| State: | 7.2% (12,539) |
Number of households with income > $200k:| Raynham: | 9.4% (676) |
| State: | 10.5% (18,185) |
Aggregate household income in Raynham in 2022: $11,023,631
Median family income in Raynham in 2022:| Raynham: | $224,439 |
| State: | $79,815 |
Number of families with income $60k - 75k:| Raynham: | 19.6% (15) |
| Massachusetts: | 7.9% (8,699) |
Number of families with income $100k - 125k:| Raynham: | 80.4% (62) |
| Massachusetts: | 10.4% (11,452) |
Median non-family income in Raynham in 2022:| Raynham: | $30,807 |
| State: | $38,934 |
Change in median non-family income between 2000 and 2022:| Raynham, Massachusetts: | +64.3% |
| Massachusetts: | +69.2% |
Median per capita income in Raynham in 2022:| Raynham: | $31,237 |
| State: | $33,524 |
Change in median per capita income between 2000 and 2022:| Raynham, Massachusetts: | +99.0% |
| Massachusetts: | +109.4% |
Income statistics for Asian residents
Median household income in Raynham, MA in 2022:| Raynham: | $128,634 |
| State: | $117,855 |
Change in median household income between 2000 and 2022:| Raynham, Massachusetts: | +127.6% |
| Massachusetts: | +129.9% |
Number of households with income < $10k:| Raynham: | 6.8% (13,205) |
| Massachusetts: | 6.8% (11,982) |
Number of households with income $10k - 20k:| Raynham: | 4.8% (9,231) |
| Massachusetts: | 4.8% (8,376) |
Number of households with income $20k - 30k:| Raynham: | 3.7% (7,228) |
| State: | 3.7% (6,558) |
Number of households with income $30k - 40k:| Raynham: | 3.3% (6,335) |
| State: | 3.3% (5,748) |
Number of households with income $40k - 50k:| Raynham: | 4.1% (7,926) |
| State: | 4.1% (7,192) |
Number of households with income $50k - 60k:| Raynham: | 5.0% (9,625) |
| Massachusetts: | 5.0% (8,734) |
Number of households with income $60k - 75k:| Raynham: | 5.8% (11,244) |
| State: | 5.8% (10,203) |
Number of households with income $75k - 100k:| Raynham: | 8.6% (16,701) |
| State: | 8.6% (15,154) |
Number of households with income $100k - 125k:| Raynham: | 10.8% (20,875) |
| Massachusetts: | 10.8% (18,942) |
Number of households with income $125k - 150k:| Raynham: | 8.0% (15,470) |
| Massachusetts: | 8.0% (14,037) |
Number of households with income $150k - 200k:| Raynham: | 12.5% (24,087) |
| State: | 12.5% (21,856) |
Number of households with income > $200k:| Raynham: | 26.6% (51,460) |
| Massachusetts: | 26.6% (46,694) |
Aggregate household income in Raynham in 2022: $48,056,202
Median family income in Raynham in 2022:| Raynham: | $365,931 |
| State: | $140,113 |
Number of families with income $150k - 200k:| Raynham: | 50.8% (126) |
| State: | 13.2% (15,478) |
Number of families with income > $200k:| Raynham: | 49.2% (121) |
| Massachusetts: | 34.0% (39,856) |
Median non-family income in Raynham in 2022:| Raynham: | $121,574 |
| State: | $71,440 |
Change in median non-family income between 2000 and 2022:| Raynham, Massachusetts: | +118.9% |
| State: | +128.0% |
Median per capita income in Raynham in 2022:| Raynham: | $122,424 |
| State: | $58,900 |
Income statistics for Hispanic or Latino residents
Median household income in Raynham, MA in 2022:| Raynham: | $96,119 |
| Massachusetts: | $61,523 |
Number of households with income < $10k:| Raynham: | 9.5% (2,723) |
| Massachusetts: | 8.8% (25,307) |
Number of households with income $10k - 20k:| Raynham: | 8.9% (2,552) |
| Massachusetts: | 10.0% (28,653) |
Number of households with income $20k - 30k:| Raynham: | 7.1% (2,034) |
| Massachusetts: | 8.8% (25,189) |
Number of households with income $30k - 40k:| Raynham: | 10.8% (3,094) |
| State: | 7.2% (20,822) |
Number of households with income $40k - 50k:| Raynham: | 8.9% (2,553) |
| State: | 7.2% (20,817) |
Number of households with income $50k - 60k:| Raynham: | 6.3% (1,795) |
| Massachusetts: | 6.5% (18,748) |
Number of households with income $60k - 75k:| Raynham: | 11.1% (3,158) |
| Massachusetts: | 8.8% (25,390) |
Number of households with income $75k - 100k:| Raynham: | 9.7% (2,762) |
| State: | 12.0% (34,488) |
Number of households with income $100k - 125k:| Raynham: | 12.1% (3,450) |
| State: | 8.6% (24,599) |
Number of households with income $125k - 150k:| Raynham: | 4.5% (1,279) |
| State: | 6.2% (17,743) |
Number of households with income $150k - 200k:| Raynham: | 6.4% (1,833) |
| State: | 7.3% (21,017) |
Number of households with income > $200k:| Raynham: | 4.6% (1,303) |
| State: | 8.6% (24,606) |
Aggregate household income in Raynham in 2022: $1,774,733
Median family income in Raynham in 2022:| Raynham: | $92,064 |
| Massachusetts: | $66,072 |
Number of families with income < $10k:| Raynham: | 6.1% (20) |
| Massachusetts: | 6.2% (12,456) |
Number of families with income $10k - 20k:| Raynham: | 1.9% (6) |
| Massachusetts: | 6.0% (12,071) |
Number of families with income $20k - 30k:| Raynham: | 11.1% (36) |
| State: | 10.1% (20,376) |
Number of families with income $30k - 40k:| Raynham: | 8.4% (28) |
| State: | 8.2% (16,470) |
Number of families with income $40k - 50k:| Raynham: | 6.4% (21) |
| State: | 7.4% (14,829) |
Number of families with income $50k - 60k:| Raynham: | 3.2% (11) |
| State: | 7.3% (14,643) |
Number of families with income $60k - 75k:| Raynham: | 10.3% (34) |
| State: | 10.6% (21,252) |
Number of families with income $75k - 100k:| Raynham: | 13.5% (44) |
| State: | 12.0% (24,088) |
Number of families with income $100k - 125k:| Raynham: | 18.4% (60) |
| Massachusetts: | 8.9% (17,954) |
Number of families with income $125k - 150k:| Raynham: | 9.0% (29) |
| State: | 6.9% (13,837) |
Number of families with income $150k - 200k:| Raynham: | 8.5% (28) |
| Massachusetts: | 7.3% (14,683) |
Number of families with income > $200k:| Raynham: | 3.1% (10) |
| State: | 9.3% (18,741) |
Median per capita income in Raynham in 2022:| Raynham: | $10,962 |
| State: | $28,993 |
Change in median per capita income between 2000 and 2022:| Raynham, Massachusetts: | +98.7% |
| Massachusetts: | +142.4% |
Income statistics for American Indian and Alaska Native residents
Number of households with income < $10k:| Raynham: | 6.6% (1,022) |
| Massachusetts: | 6.6% (451) |
Number of households with income $10k - 20k:| Raynham: | 7.0% (1,079) |
| State: | 7.0% (476) |
Number of households with income $20k - 30k:| Raynham: | 2.8% (435) |
| State: | 2.8% (192) |
Number of households with income $30k - 40k:| Raynham: | 3.2% (494) |
| Massachusetts: | 3.2% (218) |
Number of households with income $40k - 50k:| Raynham: | 2.9% (451) |
| State: | 2.9% (199) |
Number of households with income $50k - 60k:| Raynham: | 9.9% (1,534) |
| Massachusetts: | 9.9% (677) |
Number of households with income $60k - 75k:| Raynham: | 11.5% (1,770) |
| State: | 11.5% (781) |
Number of households with income $75k - 100k:| Raynham: | 9.2% (1,425) |
| State: | 9.2% (629) |
Number of households with income $100k - 125k:| Raynham: | 6.0% (920) |
| State: | 6.0% (406) |
Number of households with income $125k - 150k:| Raynham: | 13.5% (2,087) |
| State: | 13.5% (921) |
Number of households with income $150k - 200k:| Raynham: | 12.6% (1,947) |
| Massachusetts: | 12.6% (859) |
Number of households with income > $200k:| Raynham: | 14.7% (2,273) |
| Massachusetts: | 14.7% (1,003) |
Median per capita income in Raynham in 2022:| Raynham: | $33,451 |
| State: | $39,434 |
Income statistics for Multirace residents
Median household income in Raynham, MA in 2022:| Raynham: | $194,772 |
| State: | $71,552 |
Change in median household income between 2000 and 2022:| Raynham, Massachusetts: | +110.4% |
| State: | +109.0% |
Number of households with income < $10k:| Raynham: | 4.0% (1,966) |
| State: | 6.6% (15,127) |
Number of households with income $10k - 20k:| Raynham: | 8.9% (4,405) |
| Massachusetts: | 9.2% (21,158) |
Number of households with income $20k - 30k:| Raynham: | 9.2% (4,569) |
| State: | 7.8% (18,016) |
Number of households with income $30k - 40k:| Raynham: | 11.6% (5,742) |
| Massachusetts: | 7.9% (18,260) |
Number of households with income $40k - 50k:| Raynham: | 6.6% (3,297) |
| State: | 5.6% (13,027) |
Number of households with income $50k - 60k:| Raynham: | 3.3% (1,628) |
| Massachusetts: | 5.6% (12,909) |
Number of households with income $60k - 75k:| Raynham: | 13.0% (6,462) |
| Massachusetts: | 9.0% (20,800) |
Number of households with income $75k - 100k:| Raynham: | 13.1% (6,491) |
| State: | 12.1% (27,875) |
Number of households with income $100k - 125k:| Raynham: | 7.5% (3,717) |
| State: | 8.1% (18,754) |
Number of households with income $125k - 150k:| Raynham: | 7.7% (3,845) |
| State: | 6.8% (15,621) |
Number of households with income $150k - 200k:| Raynham: | 6.2% (3,081) |
| State: | 9.4% (21,618) |
Number of households with income > $200k:| Raynham: | 9.0% (4,474) |
| State: | 12.0% (27,592) |
Aggregate household income in Raynham in 2022: $31,879,336
Median family income in Raynham in 2022:| Raynham: | $142,442 |
| Massachusetts: | $78,380 |
Number of families with income < $10k:| Raynham: | 2.5% (6) |
| State: | 4.5% (7,017) |
Number of families with income $30k - 40k:| Raynham: | 5.8% (14) |
| Massachusetts: | 8.2% (12,705) |
Number of families with income $75k - 100k:| Raynham: | 75.9% (186) |
| Massachusetts: | 12.1% (18,758) |
Number of families with income $100k - 125k:| Raynham: | 15.7% (38) |
| State: | 7.9% (12,321) |
Median per capita income in Raynham in 2022:| Raynham: | $46,287 |
| State: | $34,029 |
Change in median per capita income between 2000 and 2022:| Raynham, Massachusetts: | +76.3% |
| Massachusetts: | +132.1% |