Redland, Oregon (OR) income map, earnings map, and wages data
The median household income in Redland, OR in 2022 was $110,295, which was 31.4% greater than the median annual income of $75,657 across the entire state of Oregon. Compared to the median income of $58,964 in 2000 this represents an increase of 46.5%. The per capita income in 2022 was $50,661, which means an increase of 49.1% compared to 2000 when it was $25,807.
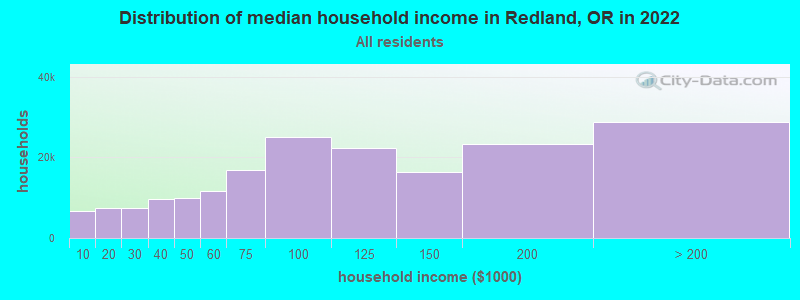
Income statistics for all residents
Median household income in Redland, OR in 2022:| Redland: | $110,296 |
| State: | $75,657 |
Change in median household income between 2000 and 2022:| Redland, Oregon: | +87.1% |
| Oregon: | +84.9% |
Number of households with income < $10k:| Redland: | 3.6% (6,635) |
| State: | 5.1% (87,297) |
Number of households with income $10k - 20k:| Redland: | 4.0% (7,464) |
| Oregon: | 6.7% (115,299) |
Number of households with income $20k - 30k:| Redland: | 4.0% (7,468) |
| Oregon: | 6.9% (119,114) |
Number of households with income $30k - 40k:| Redland: | 5.2% (9,614) |
| State: | 7.1% (122,333) |
Number of households with income $40k - 50k:| Redland: | 5.4% (9,942) |
| State: | 7.2% (124,562) |
Number of households with income $50k - 60k:| Redland: | 6.3% (11,761) |
| State: | 6.9% (118,435) |
Number of households with income $60k - 75k:| Redland: | 9.1% (16,799) |
| Oregon: | 9.8% (168,926) |
Number of households with income $75k - 100k:| Redland: | 13.5% (24,997) |
| State: | 13.3% (229,104) |
Number of households with income $100k - 125k:| Redland: | 12.0% (22,327) |
| State: | 10.5% (181,787) |
Number of households with income $125k - 150k:| Redland: | 8.8% (16,376) |
| Oregon: | 7.4% (127,392) |
Number of households with income $150k - 200k:| Redland: | 12.6% (23,291) |
| State: | 8.6% (148,614) |
Number of households with income > $200k:| Redland: | 15.5% (28,783) |
| State: | 10.6% (183,477) |
Aggregate household income in Redland in 2022: $1,535,657,647
Median family income in Redland in 2022:| Redland: | $119,162 |
| Oregon: | $93,384 |
Median non-family income in Redland in 2022:| Redland: | $59,067 |
| Oregon: | $48,114 |
Change in median non-family income between 2000 and 2022:| Redland, Oregon: | +88.1% |
| State: | +86.8% |
Median per capita income in Redland in 2022:| Redland: | $50,661 |
| State: | $42,474 |
Change in median per capita income between 2000 and 2022:| Redland, Oregon: | +96.3% |
| Oregon: | +102.8% |
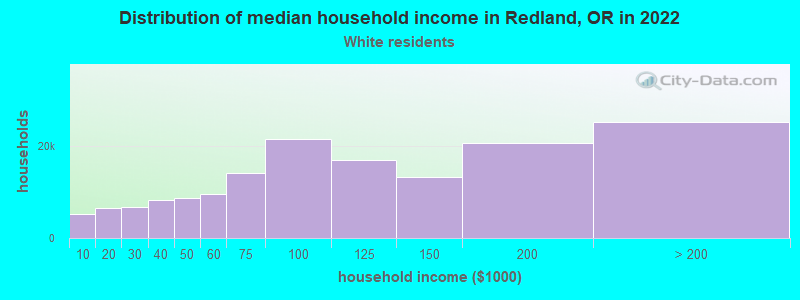
Income statistics for White residents
Median household income in Redland, OR in 2022:| Redland: | $109,414 |
| Oregon: | $76,846 |
Change in median household income between 2000 and 2022:| Redland, Oregon: | +83.8% |
| Oregon: | +84.8% |
Number of households with income < $10k:| Redland: | 3.3% (5,187) |
| Oregon: | 4.9% (67,757) |
Number of households with income $10k - 20k:| Redland: | 4.1% (6,504) |
| Oregon: | 6.6% (91,229) |
Number of households with income $20k - 30k:| Redland: | 4.2% (6,659) |
| State: | 6.8% (93,981) |
Number of households with income $30k - 40k:| Redland: | 5.3% (8,324) |
| State: | 6.9% (95,328) |
Number of households with income $40k - 50k:| Redland: | 5.6% (8,796) |
| State: | 7.2% (100,221) |
Number of households with income $50k - 60k:| Redland: | 6.1% (9,512) |
| Oregon: | 6.9% (95,294) |
Number of households with income $60k - 75k:| Redland: | 9.0% (14,150) |
| State: | 9.5% (132,178) |
Number of households with income $75k - 100k:| Redland: | 13.8% (21,596) |
| State: | 13.5% (187,105) |
Number of households with income $100k - 125k:| Redland: | 10.8% (16,986) |
| Oregon: | 10.5% (145,264) |
Number of households with income $125k - 150k:| Redland: | 8.4% (13,249) |
| Oregon: | 7.3% (101,755) |
Number of households with income $150k - 200k:| Redland: | 13.1% (20,629) |
| State: | 8.7% (121,099) |
Number of households with income > $200k:| Redland: | 16.1% (25,308) |
| Oregon: | 11.1% (153,992) |
Aggregate household income in Redland in 2022: $1,273,143,431
Median family income in Redland in 2022:| Redland: | $124,092 |
| Oregon: | $95,912 |
Number of families with income < $10k:| Redland: | 0.5% (10) |
| State: | 2.8% (23,325) |
Number of families with income $10k - 20k:| Redland: | 0.9% (15) |
| State: | 2.8% (23,464) |
Number of families with income $20k - 30k:| Redland: | 3.0% (54) |
| State: | 4.1% (33,830) |
Number of families with income $30k - 40k:| Redland: | 5.2% (92) |
| Oregon: | 5.6% (46,508) |
Number of families with income $40k - 50k:| Redland: | 3.9% (68) |
| State: | 6.4% (53,001) |
Number of families with income $50k - 60k:| Redland: | 7.5% (132) |
| State: | 6.0% (49,589) |
Number of families with income $60k - 75k:| Redland: | 9.1% (160) |
| State: | 9.4% (77,838) |
Number of families with income $75k - 100k:| Redland: | 16.1% (283) |
| State: | 14.7% (121,106) |
Number of families with income $100k - 125k:| Redland: | 12.6% (221) |
| State: | 12.3% (101,829) |
Number of families with income $125k - 150k:| Redland: | 7.2% (126) |
| State: | 8.9% (73,376) |
Number of families with income $150k - 200k:| Redland: | 18.0% (318) |
| Oregon: | 11.7% (96,629) |
Number of families with income > $200k:| Redland: | 16.1% (283) |
| State: | 15.2% (125,084) |
Median non-family income in Redland in 2022:| Redland: | $58,093 |
| Oregon: | $48,924 |
Change in median non-family income between 2000 and 2022:| Redland, Oregon: | +84.4% |
| State: | +88.0% |
Median per capita income in Redland in 2022:| Redland: | $53,273 |
| State: | $45,669 |
Change in median per capita income between 2000 and 2022:| Redland, Oregon: | +103.3% |
| State: | +106.5% |
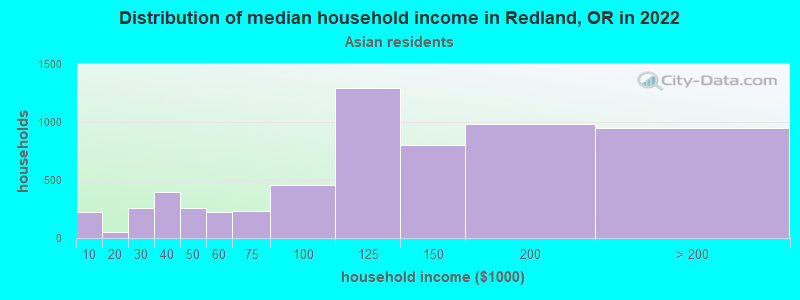
Income statistics for Asian residents
Median household income in Redland, OR in 2022:| Redland: | $109,228 |
| State: | $104,214 |
Change in median household income between 2000 and 2022:| Redland, Oregon: | +96.4% |
| State: | +121.9% |
Number of households with income < $10k:| Redland: | 3.7% (226) |
| Oregon: | 4.8% (3,402) |
Number of households with income $10k - 20k:| Redland: | 0.8% (49) |
| Oregon: | 6.0% (4,253) |
Number of households with income $20k - 30k:| Redland: | 4.2% (255) |
| State: | 4.6% (3,310) |
Number of households with income $30k - 40k:| Redland: | 6.5% (395) |
| Oregon: | 4.7% (3,339) |
Number of households with income $40k - 50k:| Redland: | 4.2% (257) |
| Oregon: | 4.9% (3,495) |
Number of households with income $50k - 60k:| Redland: | 3.7% (225) |
| Oregon: | 4.8% (3,456) |
Number of households with income $60k - 75k:| Redland: | 3.7% (229) |
| State: | 6.7% (4,746) |
Number of households with income $75k - 100k:| Redland: | 7.5% (460) |
| Oregon: | 10.2% (7,251) |
Number of households with income $100k - 125k:| Redland: | 21.1% (1,292) |
| State: | 11.7% (8,327) |
Number of households with income $125k - 150k:| Redland: | 13.2% (806) |
| State: | 11.0% (7,818) |
Number of households with income $150k - 200k:| Redland: | 16.0% (980) |
| Oregon: | 11.5% (8,235) |
Number of households with income > $200k:| Redland: | 15.5% (948) |
| Oregon: | 19.2% (13,672) |
Aggregate household income in Redland in 2022: $6,093,189
Median family income in Redland in 2022:| Redland: | $104,156 |
| State: | $123,331 |
Number of families with income $50k - 60k:| Redland: | 35.9% (14) |
| Oregon: | 4.7% (2,277) |
Number of families with income $100k - 125k:| Redland: | 64.1% (25) |
| State: | 12.3% (5,926) |
Median non-family income in Redland in 2022:| Redland: | $29,143 |
| State: | $62,679 |
Change in median non-family income between 2000 and 2022:| Redland, Oregon: | +22.7% |
| State: | +164.5% |
Median per capita income in Redland in 2022:| Redland: | $41,561 |
| State: | $52,607 |
Change in median per capita income between 2000 and 2022:| Redland, Oregon: | +85.2% |
| State: | +165.8% |
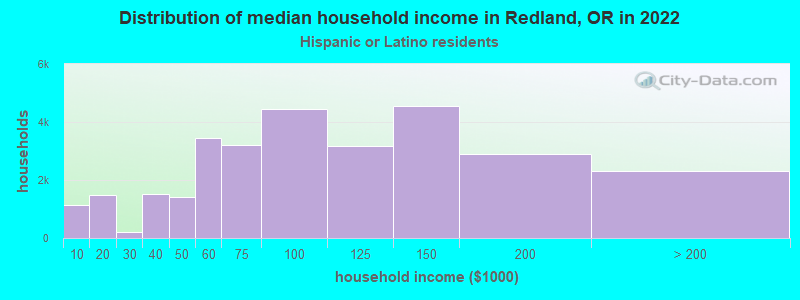
Income statistics for Hispanic or Latino residents
Median household income in Redland, OR in 2022:| Redland: | $238,174 |
| State: | $65,081 |
Change in median household income between 2000 and 2022:| Redland, Oregon: | +132.9% |
| Oregon: | +103.9% |
Number of households with income < $10k:| Redland: | 3.8% (1,137) |
| State: | 5.0% (8,626) |
Number of households with income $10k - 20k:| Redland: | 5.0% (1,492) |
| Oregon: | 5.4% (9,284) |
Number of households with income $20k - 30k:| Redland: | 0.7% (194) |
| Oregon: | 8.2% (14,265) |
Number of households with income $30k - 40k:| Redland: | 5.1% (1,512) |
| Oregon: | 9.9% (17,228) |
Number of households with income $40k - 50k:| Redland: | 4.7% (1,412) |
| Oregon: | 9.2% (16,040) |
Number of households with income $50k - 60k:| Redland: | 11.5% (3,432) |
| Oregon: | 7.8% (13,499) |
Number of households with income $60k - 75k:| Redland: | 10.7% (3,195) |
| Oregon: | 12.6% (21,845) |
Number of households with income $75k - 100k:| Redland: | 14.9% (4,440) |
| State: | 13.6% (23,566) |
Number of households with income $100k - 125k:| Redland: | 10.6% (3,160) |
| Oregon: | 10.2% (17,704) |
Number of households with income $125k - 150k:| Redland: | 15.3% (4,550) |
| State: | 5.9% (10,188) |
Number of households with income $150k - 200k:| Redland: | 9.7% (2,896) |
| State: | 7.1% (12,405) |
Number of households with income > $200k:| Redland: | 7.8% (2,317) |
| State: | 5.1% (8,851) |
Aggregate household income in Redland in 2022: $8,915,969
Median family income in Redland in 2022:| Redland: | $237,232 |
| Oregon: | $70,541 |
Number of families with income < $10k:| Redland: | 1.3% (2) |
| Oregon: | 4.3% (5,112) |
Number of families with income $10k - 20k:| Redland: | 4.5% (7) |
| State: | 3.1% (3,774) |
Number of families with income $20k - 30k:| Redland: | 0.8% (1) |
| State: | 7.8% (9,379) |
Number of families with income $30k - 40k:| Redland: | 4.5% (7) |
| Oregon: | 8.8% (10,547) |
Number of families with income $40k - 50k:| Redland: | 8.3% (14) |
| Oregon: | 8.9% (10,692) |
Number of families with income $50k - 60k:| Redland: | 13.2% (21) |
| State: | 7.0% (8,368) |
Number of families with income $60k - 75k:| Redland: | 9.0% (15) |
| State: | 13.7% (16,446) |
Number of families with income $75k - 100k:| Redland: | 18.2% (30) |
| State: | 14.6% (17,572) |
Number of families with income $100k - 125k:| Redland: | 14.5% (23) |
| Oregon: | 12.0% (14,418) |
Number of families with income $125k - 150k:| Redland: | 8.8% (14) |
| State: | 6.0% (7,198) |
Number of families with income $150k - 200k:| Redland: | 10.0% (16) |
| Oregon: | 8.1% (9,776) |
Number of families with income > $200k:| Redland: | 6.8% (11) |
| State: | 5.7% (6,869) |
Median per capita income in Redland in 2022:| Redland: | $23,838 |
| State: | $25,274 |
Change in median per capita income between 2000 and 2022:| Redland, Oregon: | +132.0% |
| State: | +149.8% |
Income statistics for American Indian and Alaska Native residents
Number of households with income < $10k:| Redland: | 11.4% (774) |
| State: | 11.0% (1,885) |
Number of households with income $10k - 20k:| Redland: | 6.6% (452) |
| State: | 6.6% (1,129) |
Number of households with income $20k - 30k:| Redland: | 8.0% (541) |
| State: | 7.9% (1,360) |
Number of households with income $30k - 40k:| Redland: | 8.6% (587) |
| Oregon: | 8.6% (1,471) |
Number of households with income $40k - 50k:| Redland: | 12.1% (820) |
| Oregon: | 12.1% (2,084) |
Number of households with income $50k - 60k:| Redland: | 5.1% (345) |
| State: | 5.0% (853) |
Number of households with income $60k - 75k:| Redland: | 10.1% (689) |
| State: | 10.1% (1,730) |
Number of households with income $75k - 100k:| Redland: | 9.9% (670) |
| State: | 9.8% (1,679) |
Number of households with income $100k - 125k:| Redland: | 17.1% (1,165) |
| State: | 17.6% (3,026) |
Number of households with income $125k - 150k:| Redland: | 5.8% (391) |
| Oregon: | 5.8% (1,002) |
Number of households with income $150k - 200k:| Redland: | 1.5% (101) |
| Oregon: | 1.5% (264) |
Number of households with income > $200k:| Redland: | 3.9% (263) |
| Oregon: | 4.0% (681) |
Median per capita income in Redland in 2022:| Redland: | $19,217 |
| Oregon: | $28,382 |
Change in median per capita income between 2000 and 2022:| Redland, Oregon: | +79.0% |
| Oregon: | +111.1% |
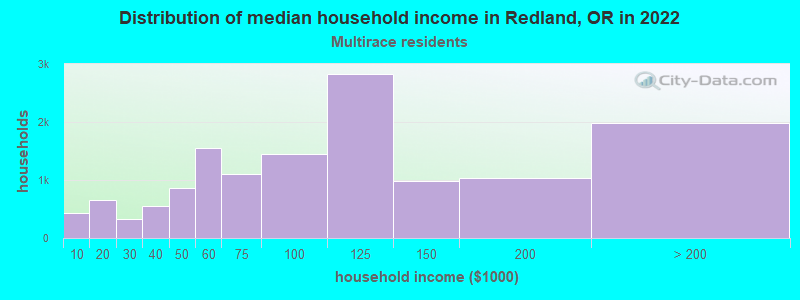
Income statistics for Multirace residents
Median household income in Redland, OR in 2022:| Redland: | $117,872 |
| State: | $68,947 |
Change in median household income between 2000 and 2022:| Redland, Oregon: | +135.3% |
| State: | +113.0% |
Number of households with income < $10k:| Redland: | 3.1% (432) |
| Oregon: | 4.7% (7,092) |
Number of households with income $10k - 20k:| Redland: | 4.8% (658) |
| State: | 7.7% (11,619) |
Number of households with income $20k - 30k:| Redland: | 2.3% (321) |
| State: | 7.4% (11,055) |
Number of households with income $30k - 40k:| Redland: | 4.0% (552) |
| Oregon: | 8.2% (12,256) |
Number of households with income $40k - 50k:| Redland: | 6.3% (865) |
| Oregon: | 7.6% (11,440) |
Number of households with income $50k - 60k:| Redland: | 11.3% (1,557) |
| State: | 7.9% (11,878) |
Number of households with income $60k - 75k:| Redland: | 8.0% (1,097) |
| Oregon: | 10.8% (16,149) |
Number of households with income $75k - 100k:| Redland: | 10.5% (1,449) |
| Oregon: | 13.7% (20,620) |
Number of households with income $100k - 125k:| Redland: | 20.6% (2,831) |
| Oregon: | 9.7% (14,562) |
Number of households with income $125k - 150k:| Redland: | 7.1% (979) |
| State: | 6.6% (9,976) |
Number of households with income $150k - 200k:| Redland: | 7.6% (1,041) |
| Oregon: | 8.8% (13,229) |
Number of households with income > $200k:| Redland: | 14.4% (1,982) |
| Oregon: | 6.8% (10,234) |
Aggregate household income in Redland in 2022: $33,938,686
Median family income in Redland in 2022:| Redland: | $124,772 |
| State: | $81,783 |
Number of families with income $40k - 50k:| Redland: | 17.0% (37) |
| State: | 7.4% (6,757) |
Number of families with income $50k - 60k:| Redland: | 9.4% (21) |
| State: | 7.1% (6,467) |
Number of families with income $60k - 75k:| Redland: | 7.9% (17) |
| State: | 11.3% (10,267) |
Number of families with income $100k - 125k:| Redland: | 65.6% (144) |
| State: | 12.1% (11,019) |
Median non-family income in Redland in 2022:| Redland: | $65,304 |
| State: | $45,215 |
Change in median non-family income between 2000 and 2022:| Redland, Oregon: | +109.0% |
| State: | +107.2% |
Median per capita income in Redland in 2022:| Redland: | $38,368 |
| State: | $29,750 |