South Hadley, Massachusetts (MA) income map, earnings map, and wages data
The median household income in South Hadley, MA in 2022 was $83,110, which was 13.7% less than the median annual income of $94,488 across the entire state of Massachusetts. Compared to the median income of $46,678 in 2000 this represents an increase of 43.8%. The per capita income in 2022 was $43,603, which means an increase of 47.9% compared to 2000 when it was $22,732.
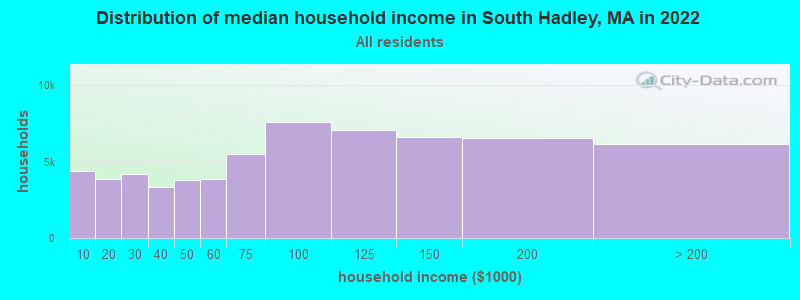
Income statistics for all residents
Median household income in South Hadley, MA in 2022:| South Hadley: | $83,111 |
| State: | $94,488 |
Change in median household income between 2000 and 2022:| South Hadley, Massachusetts: | +78.1% |
| State: | +87.1% |
Number of households with income < $10k:| South Hadley: | 7.0% (4,399) |
| Massachusetts: | 5.2% (146,170) |
Number of households with income $10k - 20k:| South Hadley: | 6.1% (3,862) |
| State: | 6.4% (180,001) |
Number of households with income $20k - 30k:| South Hadley: | 6.6% (4,171) |
| State: | 5.6% (156,667) |
Number of households with income $30k - 40k:| South Hadley: | 5.3% (3,350) |
| State: | 5.6% (157,168) |
Number of households with income $40k - 50k:| South Hadley: | 6.0% (3,770) |
| Massachusetts: | 5.4% (151,455) |
Number of households with income $50k - 60k:| South Hadley: | 6.2% (3,887) |
| Massachusetts: | 5.1% (142,726) |
Number of households with income $60k - 75k:| South Hadley: | 8.7% (5,479) |
| State: | 7.6% (212,203) |
Number of households with income $75k - 100k:| South Hadley: | 12.1% (7,596) |
| State: | 11.3% (317,064) |
Number of households with income $100k - 125k:| South Hadley: | 11.2% (7,081) |
| Massachusetts: | 9.7% (270,603) |
Number of households with income $125k - 150k:| South Hadley: | 10.5% (6,613) |
| Massachusetts: | 8.0% (223,140) |
Number of households with income $150k - 200k:| South Hadley: | 10.4% (6,576) |
| State: | 11.0% (308,695) |
Number of households with income > $200k:| South Hadley: | 9.8% (6,177) |
| State: | 19.0% (531,884) |
Aggregate household income in South Hadley in 2022: $1,170,324,533
Median family income in South Hadley in 2022:| South Hadley: | $115,151 |
| State: | $120,263 |
Median non-family income in South Hadley in 2022:| South Hadley: | $46,908 |
| State: | $55,979 |
Change in median non-family income between 2000 and 2022:| South Hadley, Massachusetts: | +62.3% |
| State: | +88.0% |
Median per capita income in South Hadley in 2022:| South Hadley: | $43,603 |
| Massachusetts: | $54,025 |
Change in median per capita income between 2000 and 2022:| South Hadley, Massachusetts: | +91.8% |
| State: | +108.2% |
Income statistics for White residents
Median household income in South Hadley, MA in 2022:| South Hadley: | $86,434 |
| Massachusetts: | $101,391 |
Change in median household income between 2000 and 2022:| South Hadley, Massachusetts: | +84.3% |
| State: | +93.3% |
Number of households with income < $10k:| South Hadley: | 5.2% (2,762) |
| Massachusetts: | 4.4% (91,120) |
Number of households with income $10k - 20k:| South Hadley: | 5.4% (2,886) |
| Massachusetts: | 5.9% (122,055) |
Number of households with income $20k - 30k:| South Hadley: | 5.7% (3,049) |
| Massachusetts: | 5.1% (105,311) |
Number of households with income $30k - 40k:| South Hadley: | 6.0% (3,216) |
| Massachusetts: | 5.3% (110,239) |
Number of households with income $40k - 50k:| South Hadley: | 6.3% (3,365) |
| State: | 5.0% (104,636) |
Number of households with income $50k - 60k:| South Hadley: | 6.0% (3,203) |
| State: | 4.8% (99,486) |
Number of households with income $60k - 75k:| South Hadley: | 8.6% (4,570) |
| Massachusetts: | 7.5% (155,124) |
Number of households with income $75k - 100k:| South Hadley: | 12.6% (6,677) |
| Massachusetts: | 11.4% (236,252) |
Number of households with income $100k - 125k:| South Hadley: | 11.8% (6,255) |
| State: | 9.9% (204,731) |
Number of households with income $125k - 150k:| South Hadley: | 11.5% (6,129) |
| Massachusetts: | 8.5% (175,324) |
Number of households with income $150k - 200k:| South Hadley: | 10.6% (5,638) |
| State: | 11.7% (242,980) |
Number of households with income > $200k:| South Hadley: | 10.2% (5,440) |
| State: | 20.5% (425,966) |
Aggregate household income in South Hadley in 2022: $1,007,974,786
Median family income in South Hadley in 2022:| South Hadley: | $114,916 |
| State: | $133,153 |
Number of families with income < $10k:| South Hadley: | 0.8% (32) |
| State: | 2.0% (25,038) |
Number of families with income $10k - 20k:| South Hadley: | 1.9% (75) |
| State: | 2.1% (26,403) |
Number of families with income $20k - 30k:| South Hadley: | 2.4% (96) |
| State: | 2.6% (32,525) |
Number of families with income $30k - 40k:| South Hadley: | 5.0% (195) |
| State: | 3.9% (48,079) |
Number of families with income $40k - 50k:| South Hadley: | 5.0% (196) |
| State: | 3.8% (46,908) |
Number of families with income $50k - 60k:| South Hadley: | 4.0% (155) |
| State: | 3.8% (46,476) |
Number of families with income $60k - 75k:| South Hadley: | 6.0% (234) |
| State: | 6.4% (79,040) |
Number of families with income $75k - 100k:| South Hadley: | 15.3% (598) |
| State: | 11.1% (137,395) |
Number of families with income $100k - 125k:| South Hadley: | 13.6% (533) |
| State: | 11.1% (136,771) |
Number of families with income $125k - 150k:| South Hadley: | 15.7% (615) |
| Massachusetts: | 10.0% (123,709) |
Number of families with income $150k - 200k:| South Hadley: | 14.5% (568) |
| State: | 14.7% (181,602) |
Number of families with income > $200k:| South Hadley: | 15.6% (612) |
| Massachusetts: | 28.5% (351,887) |
Median non-family income in South Hadley in 2022:| South Hadley: | $52,195 |
| State: | $59,323 |
Change in median non-family income between 2000 and 2022:| South Hadley, Massachusetts: | +79.8% |
| State: | +94.3% |
Median per capita income in South Hadley in 2022:| South Hadley: | $45,958 |
| State: | $60,804 |
Change in median per capita income between 2000 and 2022:| South Hadley, Massachusetts: | +99.4% |
| Massachusetts: | +118.7% |
Income statistics for Black or African American residents
Median household income in South Hadley, MA in 2022:| South Hadley: | $99,700 |
| Massachusetts: | $63,189 |
Change in median household income between 2000 and 2022:| South Hadley, Massachusetts: | +62.3% |
| State: | +87.4% |
Number of households with income < $10k:| South Hadley: | 9.1% (28,772) |
| State: | 9.1% (15,797) |
Number of households with income $10k - 20k:| South Hadley: | 9.4% (29,628) |
| Massachusetts: | 9.4% (16,267) |
Number of households with income $20k - 30k:| South Hadley: | 7.8% (24,625) |
| State: | 7.8% (13,520) |
Number of households with income $30k - 40k:| South Hadley: | 8.3% (26,249) |
| State: | 8.3% (14,412) |
Number of households with income $40k - 50k:| South Hadley: | 7.9% (25,116) |
| State: | 7.9% (13,790) |
Number of households with income $50k - 60k:| South Hadley: | 5.8% (18,288) |
| Massachusetts: | 5.8% (10,041) |
Number of households with income $60k - 75k:| South Hadley: | 8.5% (26,996) |
| Massachusetts: | 8.5% (14,822) |
Number of households with income $75k - 100k:| South Hadley: | 11.0% (34,828) |
| State: | 11.0% (19,122) |
Number of households with income $100k - 125k:| South Hadley: | 8.4% (26,546) |
| State: | 8.4% (14,575) |
Number of households with income $125k - 150k:| South Hadley: | 6.0% (18,995) |
| State: | 6.0% (10,429) |
Number of households with income $150k - 200k:| South Hadley: | 7.2% (22,838) |
| State: | 7.2% (12,539) |
Number of households with income > $200k:| South Hadley: | 10.5% (33,121) |
| State: | 10.5% (18,185) |
Aggregate household income in South Hadley in 2022: $18,015,193
Median family income in South Hadley in 2022:| South Hadley: | $165,459 |
| State: | $79,815 |
Number of families with income $10k - 20k:| South Hadley: | 8.1% (12) |
| Massachusetts: | 6.8% (7,412) |
Number of families with income $50k - 60k:| South Hadley: | 4.8% (7) |
| State: | 6.4% (6,986) |
Number of families with income $75k - 100k:| South Hadley: | 14.1% (20) |
| State: | 11.5% (12,654) |
Number of families with income > $200k:| South Hadley: | 73.0% (105) |
| State: | 12.9% (14,108) |
Median non-family income in South Hadley in 2022:| South Hadley: | $107,234 |
| State: | $38,934 |
Change in median non-family income between 2000 and 2022:| South Hadley, Massachusetts: | +73.1% |
| Massachusetts: | +69.2% |
Median per capita income in South Hadley in 2022:| South Hadley: | $77,164 |
| Massachusetts: | $33,524 |
Change in median per capita income between 2000 and 2022:| South Hadley, Massachusetts: | +124.2% |
| Massachusetts: | +109.4% |
Income statistics for Asian residents
Median household income in South Hadley, MA in 2022:| South Hadley: | $82,358 |
| State: | $117,855 |
Change in median household income between 2000 and 2022:| South Hadley, Massachusetts: | +128.3% |
| Massachusetts: | +129.9% |
Number of households with income < $10k:| South Hadley: | 6.8% (8,429) |
| Massachusetts: | 6.8% (11,982) |
Number of households with income $10k - 20k:| South Hadley: | 4.8% (5,892) |
| State: | 4.8% (8,376) |
Number of households with income $20k - 30k:| South Hadley: | 3.7% (4,614) |
| State: | 3.7% (6,558) |
Number of households with income $30k - 40k:| South Hadley: | 3.3% (4,044) |
| State: | 3.3% (5,748) |
Number of households with income $40k - 50k:| South Hadley: | 4.1% (5,060) |
| State: | 4.1% (7,192) |
Number of households with income $50k - 60k:| South Hadley: | 5.0% (6,144) |
| Massachusetts: | 5.0% (8,734) |
Number of households with income $60k - 75k:| South Hadley: | 5.8% (7,178) |
| State: | 5.8% (10,203) |
Number of households with income $75k - 100k:| South Hadley: | 8.6% (10,661) |
| Massachusetts: | 8.6% (15,154) |
Number of households with income $100k - 125k:| South Hadley: | 10.8% (13,326) |
| State: | 10.8% (18,942) |
Number of households with income $125k - 150k:| South Hadley: | 8.0% (9,875) |
| Massachusetts: | 8.0% (14,037) |
Number of households with income $150k - 200k:| South Hadley: | 12.5% (15,376) |
| Massachusetts: | 12.5% (21,856) |
Number of households with income > $200k:| South Hadley: | 26.6% (32,850) |
| Massachusetts: | 26.6% (46,694) |
Aggregate household income in South Hadley in 2022: $17,781,810
Median family income in South Hadley in 2022:| South Hadley: | $309,875 |
| State: | $140,113 |
Number of families with income $30k - 40k:| South Hadley: | 2.0% (5) |
| State: | 2.8% (3,234) |
Number of families with income $40k - 50k:| South Hadley: | 2.1% (5) |
| State: | 3.9% (4,621) |
Number of families with income $75k - 100k:| South Hadley: | 1.1% (3) |
| State: | 8.5% (10,022) |
Number of families with income $100k - 125k:| South Hadley: | 5.3% (13) |
| State: | 10.0% (11,697) |
Number of families with income > $200k:| South Hadley: | 89.6% (226) |
| State: | 34.0% (39,856) |
Median non-family income in South Hadley in 2022:| South Hadley: | $47,228 |
| State: | $71,440 |
Change in median non-family income between 2000 and 2022:| South Hadley, Massachusetts: | +128.0% |
| State: | +128.0% |
Median per capita income in South Hadley in 2022:| South Hadley: | $33,309 |
| State: | $58,900 |
Change in median per capita income between 2000 and 2022:| South Hadley, Massachusetts: | +69.4% |
| Massachusetts: | +174.6% |
Income statistics for Hispanic or Latino residents
Median household income in South Hadley, MA in 2022:| South Hadley: | $71,436 |
| Massachusetts: | $61,523 |
Change in median household income between 2000 and 2022:| South Hadley, Massachusetts: | +77.7% |
| State: | +125.4% |
Number of households with income < $10k:| South Hadley: | 8.8% (37,273) |
| Massachusetts: | 8.8% (25,307) |
Number of households with income $10k - 20k:| South Hadley: | 10.0% (42,200) |
| State: | 10.0% (28,653) |
Number of households with income $20k - 30k:| South Hadley: | 8.8% (37,099) |
| Massachusetts: | 8.8% (25,189) |
Number of households with income $30k - 40k:| South Hadley: | 7.2% (30,667) |
| Massachusetts: | 7.2% (20,822) |
Number of households with income $40k - 50k:| South Hadley: | 7.2% (30,660) |
| State: | 7.2% (20,817) |
Number of households with income $50k - 60k:| South Hadley: | 6.5% (27,612) |
| State: | 6.5% (18,748) |
Number of households with income $60k - 75k:| South Hadley: | 8.8% (37,395) |
| State: | 8.8% (25,390) |
Number of households with income $75k - 100k:| South Hadley: | 12.0% (50,795) |
| Massachusetts: | 12.0% (34,488) |
Number of households with income $100k - 125k:| South Hadley: | 8.6% (36,230) |
| Massachusetts: | 8.6% (24,599) |
Number of households with income $125k - 150k:| South Hadley: | 6.2% (26,132) |
| State: | 6.2% (17,743) |
Number of households with income $150k - 200k:| South Hadley: | 7.3% (30,954) |
| State: | 7.3% (21,017) |
Number of households with income > $200k:| South Hadley: | 8.6% (36,240) |
| Massachusetts: | 8.6% (24,606) |
Aggregate household income in South Hadley in 2022: $24,034,621
Median family income in South Hadley in 2022:| South Hadley: | $218,451 |
| State: | $66,072 |
Number of families with income < $10k:| South Hadley: | 5.4% (32) |
| Massachusetts: | 6.2% (12,456) |
Number of families with income $10k - 20k:| South Hadley: | 5.9% (35) |
| Massachusetts: | 6.0% (12,071) |
Number of families with income $20k - 30k:| South Hadley: | 15.4% (90) |
| State: | 10.1% (20,376) |
Number of families with income $30k - 40k:| South Hadley: | 9.9% (58) |
| State: | 8.2% (16,470) |
Number of families with income $40k - 50k:| South Hadley: | 9.3% (54) |
| State: | 7.4% (14,829) |
Number of families with income $50k - 60k:| South Hadley: | 9.2% (54) |
| State: | 7.3% (14,643) |
Number of families with income $60k - 75k:| South Hadley: | 11.8% (69) |
| State: | 10.6% (21,252) |
Number of families with income $75k - 100k:| South Hadley: | 12.7% (74) |
| State: | 12.0% (24,088) |
Number of families with income $100k - 125k:| South Hadley: | 7.1% (42) |
| State: | 8.9% (17,954) |
Number of families with income $125k - 150k:| South Hadley: | 5.6% (33) |
| State: | 6.9% (13,837) |
Number of families with income $150k - 200k:| South Hadley: | 4.0% (23) |
| State: | 7.3% (14,683) |
Number of families with income > $200k:| South Hadley: | 3.8% (22) |
| Massachusetts: | 9.3% (18,741) |
Median non-family income in South Hadley in 2022:| South Hadley: | $21,459 |
| Massachusetts: | $37,563 |
Change in median non-family income between 2000 and 2022:| South Hadley, Massachusetts: | +33.9% |
| State: | +115.0% |
Median per capita income in South Hadley in 2022:| South Hadley: | $23,754 |
| State: | $28,993 |
Change in median per capita income between 2000 and 2022:| South Hadley, Massachusetts: | +129.7% |
| State: | +142.4% |
Income statistics for Multirace residents
Median household income in South Hadley, MA in 2022:| South Hadley: | $47,894 |
| Massachusetts: | $71,552 |
Change in median household income between 2000 and 2022:| South Hadley, Massachusetts: | +43.0% |
| State: | +109.0% |
Number of households with income < $10k:| South Hadley: | 6.6% (7,445) |
| State: | 6.6% (15,127) |
Number of households with income $10k - 20k:| South Hadley: | 9.3% (10,466) |
| State: | 9.2% (21,158) |
Number of households with income $20k - 30k:| South Hadley: | 7.8% (8,821) |
| State: | 7.8% (18,016) |
Number of households with income $30k - 40k:| South Hadley: | 8.0% (8,998) |
| State: | 7.9% (18,260) |
Number of households with income $40k - 50k:| South Hadley: | 5.7% (6,385) |
| State: | 5.6% (13,027) |
Number of households with income $50k - 60k:| South Hadley: | 5.6% (6,322) |
| State: | 5.6% (12,909) |
Number of households with income $60k - 75k:| South Hadley: | 9.0% (10,168) |
| State: | 9.0% (20,800) |
Number of households with income $75k - 100k:| South Hadley: | 12.1% (13,719) |
| State: | 12.1% (27,875) |
Number of households with income $100k - 125k:| South Hadley: | 8.1% (9,166) |
| State: | 8.1% (18,754) |
Number of households with income $125k - 150k:| South Hadley: | 6.8% (7,638) |
| State: | 6.8% (15,621) |
Number of households with income $150k - 200k:| South Hadley: | 9.2% (10,444) |
| Massachusetts: | 9.4% (21,618) |
Number of households with income > $200k:| South Hadley: | 11.8% (13,375) |
| State: | 12.0% (27,592) |
Aggregate household income in South Hadley in 2022: $15,828,989
Median family income in South Hadley in 2022:| South Hadley: | $77,621 |
| State: | $78,380 |
Number of families with income $10k - 20k:| South Hadley: | 8.5% (8) |
| State: | 4.9% (7,678) |
Number of families with income $30k - 40k:| South Hadley: | 22.2% (20) |
| State: | 8.2% (12,705) |
Number of families with income $60k - 75k:| South Hadley: | 53.5% (49) |
| Massachusetts: | 10.3% (16,064) |
Number of families with income $75k - 100k:| South Hadley: | 15.8% (15) |
| State: | 12.1% (18,758) |
Median non-family income in South Hadley in 2022:| South Hadley: | $18,915 |
| State: | $42,253 |
Median per capita income in South Hadley in 2022:| South Hadley: | $16,137 |
| State: | $34,029 |
Change in median per capita income between 2000 and 2022:| South Hadley, Massachusetts: | +78.7% |
| State: | +132.1% |
Income statistics for other residents
Number of households with income < $10k:| South Hadley: | 7.5% (3) |
| Massachusetts: | 8.4% (11,559) |
Number of households with income $10k - 20k:| South Hadley: | 7.5% (3) |
| State: | 8.4% (11,499) |
Number of households with income $20k - 30k:| South Hadley: | 10.0% (4) |
| State: | 9.5% (13,070) |
Number of households with income $30k - 40k:| South Hadley: | 5.0% (2) |
| State: | 6.0% (8,291) |
Number of households with income $40k - 50k:| South Hadley: | 10.0% (4) |
| State: | 9.2% (12,611) |
Number of households with income $50k - 60k:| South Hadley: | 7.5% (3) |
| Massachusetts: | 7.9% (10,879) |
Number of households with income $60k - 75k:| South Hadley: | 7.5% (3) |
| Massachusetts: | 7.5% (10,239) |
Number of households with income $75k - 100k:| South Hadley: | 12.5% (5) |
| State: | 13.1% (18,032) |
Number of households with income $100k - 125k:| South Hadley: | 10.0% (4) |
| Massachusetts: | 9.6% (13,141) |
Number of households with income $125k - 150k:| South Hadley: | 5.0% (2) |
| Massachusetts: | 5.0% (6,808) |
Number of households with income $150k - 200k:| South Hadley: | 7.5% (3) |
| State: | 6.4% (8,843) |
Number of households with income > $200k:| South Hadley: | 10.0% (4) |
| Massachusetts: | 9.0% (12,396) |
Aggregate household income in South Hadley in 2022: $1,727,764
Median family income in South Hadley in 2022:| South Hadley: | $37,600 |
| Massachusetts: | $66,840 |
Number of families with income $10k - 20k:| South Hadley: | 28.3% (5) |
| State: | 4.7% (4,798) |
Number of families with income $40k - 50k:| South Hadley: | 71.7% (12) |
| State: | 8.9% (9,052) |
Median non-family income in South Hadley in 2022:| South Hadley: | $33,132 |
| State: | $36,127 |
Median per capita income in South Hadley in 2022:| South Hadley: | $11,515 |
| Massachusetts: | $30,797 |