Sterling, Massachusetts (MA) income map, earnings map, and wages data
The median household income in Sterling, MA in 2022 was $121,057, which was 21.9% greater than the median annual income of $94,488 across the entire state of Massachusetts. Compared to the median income of $67,188 in 2000 this represents an increase of 44.5%. The per capita income in 2022 was $56,239, which means an increase of 48.7% compared to 2000 when it was $28,844.
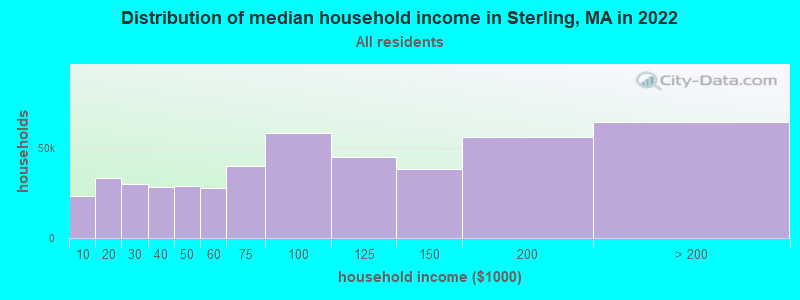
Income statistics for all residents
Median household income in Sterling, MA in 2022:| Sterling: | $121,057 |
| State: | $94,488 |
Change in median household income between 2000 and 2022:| Sterling, Massachusetts: | +80.2% |
| Massachusetts: | +87.1% |
Number of households with income < $10k:| Sterling: | 4.9% (23,287) |
| State: | 5.2% (146,170) |
Number of households with income $10k - 20k:| Sterling: | 7.0% (33,225) |
| Massachusetts: | 6.4% (180,001) |
Number of households with income $20k - 30k:| Sterling: | 6.4% (30,259) |
| State: | 5.6% (156,667) |
Number of households with income $30k - 40k:| Sterling: | 5.9% (28,164) |
| Massachusetts: | 5.6% (157,168) |
Number of households with income $40k - 50k:| Sterling: | 6.1% (28,840) |
| Massachusetts: | 5.4% (151,455) |
Number of households with income $50k - 60k:| Sterling: | 5.8% (27,614) |
| State: | 5.1% (142,726) |
Number of households with income $60k - 75k:| Sterling: | 8.4% (40,072) |
| State: | 7.6% (212,203) |
Number of households with income $75k - 100k:| Sterling: | 12.3% (58,283) |
| State: | 11.3% (317,064) |
Number of households with income $100k - 125k:| Sterling: | 9.5% (45,240) |
| State: | 9.7% (270,603) |
Number of households with income $125k - 150k:| Sterling: | 8.1% (38,658) |
| State: | 8.0% (223,140) |
Number of households with income $150k - 200k:| Sterling: | 11.9% (56,303) |
| Massachusetts: | 11.0% (308,695) |
Number of households with income > $200k:| Sterling: | 13.6% (64,537) |
| State: | 19.0% (531,884) |
Aggregate household income in Sterling in 2022: $3,771,685,857
Median family income in Sterling in 2022:| Sterling: | $141,576 |
| Massachusetts: | $120,263 |
Median non-family income in Sterling in 2022:| Sterling: | $50,394 |
| Massachusetts: | $55,979 |
Change in median non-family income between 2000 and 2022:| Sterling, Massachusetts: | +85.7% |
| State: | +88.0% |
Median per capita income in Sterling in 2022:| Sterling: | $56,240 |
| State: | $54,025 |
Change in median per capita income between 2000 and 2022:| Sterling, Massachusetts: | +95.0% |
| Massachusetts: | +108.2% |
Income statistics for White residents
Median household income in Sterling, MA in 2022:| Sterling: | $124,940 |
| State: | $101,391 |
Change in median household income between 2000 and 2022:| Sterling, Massachusetts: | +85.1% |
| Massachusetts: | +93.3% |
Number of households with income < $10k:| Sterling: | 4.6% (16,688) |
| State: | 4.4% (91,120) |
Number of households with income $10k - 20k:| Sterling: | 6.5% (23,863) |
| Massachusetts: | 5.9% (122,055) |
Number of households with income $20k - 30k:| Sterling: | 6.1% (22,127) |
| State: | 5.1% (105,311) |
Number of households with income $30k - 40k:| Sterling: | 5.5% (19,965) |
| Massachusetts: | 5.3% (110,239) |
Number of households with income $40k - 50k:| Sterling: | 5.6% (20,442) |
| Massachusetts: | 5.0% (104,636) |
Number of households with income $50k - 60k:| Sterling: | 5.4% (19,823) |
| State: | 4.8% (99,486) |
Number of households with income $60k - 75k:| Sterling: | 8.4% (30,698) |
| State: | 7.5% (155,124) |
Number of households with income $75k - 100k:| Sterling: | 12.2% (44,613) |
| State: | 11.4% (236,252) |
Number of households with income $100k - 125k:| Sterling: | 10.1% (37,073) |
| State: | 9.9% (204,731) |
Number of households with income $125k - 150k:| Sterling: | 8.4% (30,574) |
| Massachusetts: | 8.5% (175,324) |
Number of households with income $150k - 200k:| Sterling: | 12.5% (45,548) |
| State: | 11.7% (242,980) |
Number of households with income > $200k:| Sterling: | 14.7% (53,874) |
| State: | 20.5% (425,966) |
Aggregate household income in Sterling in 2022: $3,053,209,372
Median family income in Sterling in 2022:| Sterling: | $149,497 |
| Massachusetts: | $133,153 |
Number of families with income < $10k:| Sterling: | 0.3% (7) |
| State: | 2.0% (25,038) |
Number of families with income $10k - 20k:| Sterling: | 0.7% (19) |
| Massachusetts: | 2.1% (26,403) |
Number of families with income $20k - 30k:| Sterling: | 0.9% (24) |
| Massachusetts: | 2.6% (32,525) |
Number of families with income $30k - 40k:| Sterling: | 2.5% (69) |
| State: | 3.9% (48,079) |
Number of families with income $40k - 50k:| Sterling: | 1.9% (51) |
| State: | 3.8% (46,908) |
Number of families with income $50k - 60k:| Sterling: | 4.0% (110) |
| State: | 3.8% (46,476) |
Number of families with income $60k - 75k:| Sterling: | 5.4% (147) |
| State: | 6.4% (79,040) |
Number of families with income $75k - 100k:| Sterling: | 12.4% (338) |
| State: | 11.1% (137,395) |
Number of families with income $100k - 125k:| Sterling: | 7.6% (206) |
| State: | 11.1% (136,771) |
Number of families with income $125k - 150k:| Sterling: | 14.7% (401) |
| State: | 10.0% (123,709) |
Number of families with income $150k - 200k:| Sterling: | 19.8% (538) |
| Massachusetts: | 14.7% (181,602) |
Number of families with income > $200k:| Sterling: | 29.8% (809) |
| Massachusetts: | 28.5% (351,887) |
Median non-family income in Sterling in 2022:| Sterling: | $52,108 |
| State: | $59,323 |
Change in median non-family income between 2000 and 2022:| Sterling, Massachusetts: | +92.0% |
| State: | +94.3% |
Median per capita income in Sterling in 2022:| Sterling: | $59,545 |
| State: | $60,804 |
Change in median per capita income between 2000 and 2022:| Sterling, Massachusetts: | +105.3% |
| State: | +118.7% |
Income statistics for Black or African American residents
Median household income in Sterling, MA in 2022:| Sterling: | $75,614 |
| Massachusetts: | $63,189 |
Change in median household income between 2000 and 2022:| Sterling, Massachusetts: | +69.8% |
| State: | +87.4% |
Number of households with income < $10k:| Sterling: | 7.3% (1,434) |
| Massachusetts: | 9.1% (15,797) |
Number of households with income $10k - 20k:| Sterling: | 11.9% (2,344) |
| Massachusetts: | 9.4% (16,267) |
Number of households with income $20k - 30k:| Sterling: | 9.8% (1,930) |
| State: | 7.8% (13,520) |
Number of households with income $30k - 40k:| Sterling: | 3.3% (640) |
| Massachusetts: | 8.3% (14,412) |
Number of households with income $40k - 50k:| Sterling: | 13.5% (2,655) |
| Massachusetts: | 7.9% (13,790) |
Number of households with income $50k - 60k:| Sterling: | 5.8% (1,135) |
| Massachusetts: | 5.8% (10,041) |
Number of households with income $60k - 75k:| Sterling: | 10.7% (2,112) |
| State: | 8.5% (14,822) |
Number of households with income $75k - 100k:| Sterling: | 13.0% (2,565) |
| State: | 11.0% (19,122) |
Number of households with income $100k - 125k:| Sterling: | 7.5% (1,480) |
| State: | 8.4% (14,575) |
Number of households with income $125k - 150k:| Sterling: | 5.0% (978) |
| Massachusetts: | 6.0% (10,429) |
Number of households with income $150k - 200k:| Sterling: | 7.3% (1,427) |
| State: | 7.2% (12,539) |
Number of households with income > $200k:| Sterling: | 4.9% (972) |
| Massachusetts: | 10.5% (18,185) |
Aggregate household income in Sterling in 2022: $12,869,592
Median family income in Sterling in 2022:| Sterling: | $73,064 |
| State: | $79,815 |
Number of families with income $40k - 50k:| Sterling: | 25.2% (50) |
| State: | 7.9% (8,656) |
Number of families with income > $200k:| Sterling: | 74.8% (148) |
| State: | 12.9% (14,108) |
Median per capita income in Sterling in 2022:| Sterling: | $66,859 |
| State: | $33,524 |
Change in median per capita income between 2000 and 2022:| Sterling, Massachusetts: | +95.7% |
| Massachusetts: | +109.4% |
Income statistics for American Indian and Alaska Native residents
Number of households with income < $10k:| Sterling: | 6.6% (76) |
| State: | 6.6% (451) |
Number of households with income $10k - 20k:| Sterling: | 7.0% (80) |
| State: | 7.0% (476) |
Number of households with income $20k - 30k:| Sterling: | 2.8% (32) |
| State: | 2.8% (192) |
Number of households with income $30k - 40k:| Sterling: | 3.2% (37) |
| State: | 3.2% (218) |
Number of households with income $40k - 50k:| Sterling: | 3.0% (34) |
| State: | 2.9% (199) |
Number of households with income $50k - 60k:| Sterling: | 9.9% (114) |
| State: | 9.9% (677) |
Number of households with income $60k - 75k:| Sterling: | 11.4% (131) |
| State: | 11.5% (781) |
Number of households with income $75k - 100k:| Sterling: | 9.2% (106) |
| Massachusetts: | 9.2% (629) |
Number of households with income $100k - 125k:| Sterling: | 5.9% (68) |
| Massachusetts: | 6.0% (406) |
Number of households with income $125k - 150k:| Sterling: | 13.5% (155) |
| State: | 13.5% (921) |
Number of households with income $150k - 200k:| Sterling: | 12.6% (144) |
| Massachusetts: | 12.6% (859) |
Number of households with income > $200k:| Sterling: | 14.7% (169) |
| State: | 14.7% (1,003) |
Median per capita income in Sterling in 2022:| Sterling: | $4,805 |
| State: | $39,434 |
Change in median per capita income between 2000 and 2022:| Sterling, Massachusetts: | +80.0% |
| State: | +148.2% |
Income statistics for Multirace residents
Median household income in Sterling, MA in 2022:| Sterling: | $94,671 |
| State: | $71,552 |
Change in median household income between 2000 and 2022:| Sterling, Massachusetts: | +84.7% |
| State: | +109.0% |
Number of households with income < $10k:| Sterling: | 7.4% (3,526) |
| State: | 6.6% (15,127) |
Number of households with income $10k - 20k:| Sterling: | 10.3% (4,899) |
| State: | 9.2% (21,158) |
Number of households with income $20k - 30k:| Sterling: | 10.2% (4,842) |
| Massachusetts: | 7.8% (18,016) |
Number of households with income $30k - 40k:| Sterling: | 11.3% (5,361) |
| State: | 7.9% (18,260) |
Number of households with income $40k - 50k:| Sterling: | 6.2% (2,940) |
| Massachusetts: | 5.6% (13,027) |
Number of households with income $50k - 60k:| Sterling: | 8.7% (4,140) |
| State: | 5.6% (12,909) |
Number of households with income $60k - 75k:| Sterling: | 8.2% (3,872) |
| State: | 9.0% (20,800) |
Number of households with income $75k - 100k:| Sterling: | 13.5% (6,400) |
| Massachusetts: | 12.1% (27,875) |
Number of households with income $100k - 125k:| Sterling: | 6.2% (2,928) |
| State: | 8.1% (18,754) |
Number of households with income $125k - 150k:| Sterling: | 6.4% (3,046) |
| Massachusetts: | 6.8% (15,621) |
Number of households with income $150k - 200k:| Sterling: | 5.9% (2,811) |
| Massachusetts: | 9.4% (21,618) |
Number of households with income > $200k:| Sterling: | 5.6% (2,643) |
| State: | 12.0% (27,592) |
Aggregate household income in Sterling in 2022: $8,695,082
Median family income in Sterling in 2022:| Sterling: | $92,732 |
| State: | $78,380 |
Number of families with income $50k - 60k:| Sterling: | 100.0% (170) |
| State: | 6.7% (10,445) |
Median per capita income in Sterling in 2022:| Sterling: | $36,653 |
| State: | $34,029 |
Change in median per capita income between 2000 and 2022:| Sterling, Massachusetts: | +104.0% |
| Massachusetts: | +132.1% |