Tyngsborough, Massachusetts (MA) income map, earnings map, and wages data
The median household income in Tyngsborough, MA in 2022 was $136,373, which was 30.7% greater than the median annual income of $94,488 across the entire state of Massachusetts. Compared to the median income of $69,818 in 2000 this represents an increase of 48.8%. The per capita income in 2022 was $56,574, which means an increase of 51.8% compared to 2000 when it was $27,249.
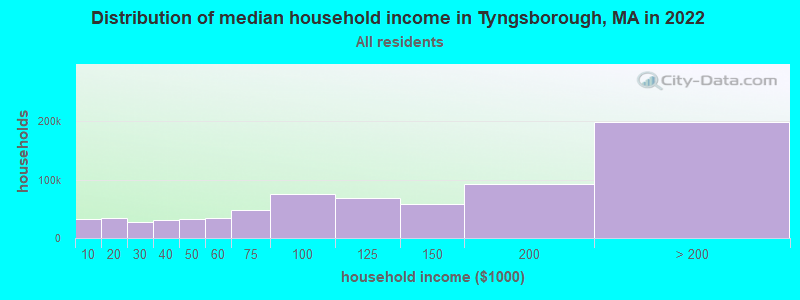
Income statistics for all residents
Median household income in Tyngsborough, MA in 2022:| Tyngsborough: | $136,374 |
| Massachusetts: | $94,488 |
Change in median household income between 2000 and 2022:| Tyngsborough, Massachusetts: | +95.3% |
| State: | +87.1% |
Number of households with income < $10k:| Tyngsborough: | 4.5% (32,774) |
| State: | 5.2% (146,170) |
Number of households with income $10k - 20k:| Tyngsborough: | 4.7% (34,669) |
| State: | 6.4% (180,001) |
Number of households with income $20k - 30k:| Tyngsborough: | 3.8% (27,753) |
| Massachusetts: | 5.6% (156,667) |
Number of households with income $30k - 40k:| Tyngsborough: | 4.2% (30,765) |
| State: | 5.6% (157,168) |
Number of households with income $40k - 50k:| Tyngsborough: | 4.5% (32,777) |
| Massachusetts: | 5.4% (151,455) |
Number of households with income $50k - 60k:| Tyngsborough: | 4.6% (34,045) |
| State: | 5.1% (142,726) |
Number of households with income $60k - 75k:| Tyngsborough: | 6.5% (47,637) |
| Massachusetts: | 7.6% (212,203) |
Number of households with income $75k - 100k:| Tyngsborough: | 10.2% (74,568) |
| Massachusetts: | 11.3% (317,064) |
Number of households with income $100k - 125k:| Tyngsborough: | 9.4% (69,171) |
| State: | 9.7% (270,603) |
Number of households with income $125k - 150k:| Tyngsborough: | 7.9% (57,616) |
| State: | 8.0% (223,140) |
Number of households with income $150k - 200k:| Tyngsborough: | 12.6% (92,552) |
| State: | 11.0% (308,695) |
Number of households with income > $200k:| Tyngsborough: | 27.1% (198,300) |
| State: | 19.0% (531,884) |
Aggregate household income in Tyngsborough in 2022: $14,567,872,065
Median family income in Tyngsborough in 2022:| Tyngsborough: | $160,059 |
| State: | $120,263 |
Median non-family income in Tyngsborough in 2022:| Tyngsborough: | $74,979 |
| Massachusetts: | $55,979 |
Change in median non-family income between 2000 and 2022:| Tyngsborough, Massachusetts: | +94.2% |
| State: | +88.0% |
Median per capita income in Tyngsborough in 2022:| Tyngsborough: | $56,574 |
| Massachusetts: | $54,025 |
Change in median per capita income between 2000 and 2022:| Tyngsborough, Massachusetts: | +107.6% |
| Massachusetts: | +108.2% |
Income statistics for White residents
Median household income in Tyngsborough, MA in 2022:| Tyngsborough: | $136,668 |
| State: | $101,391 |
Change in median household income between 2000 and 2022:| Tyngsborough, Massachusetts: | +98.2% |
| State: | +93.3% |
Number of households with income < $10k:| Tyngsborough: | 3.9% (19,952) |
| Massachusetts: | 4.4% (91,120) |
Number of households with income $10k - 20k:| Tyngsborough: | 4.7% (24,323) |
| State: | 5.9% (122,055) |
Number of households with income $20k - 30k:| Tyngsborough: | 3.8% (19,628) |
| Massachusetts: | 5.1% (105,311) |
Number of households with income $30k - 40k:| Tyngsborough: | 4.2% (21,882) |
| State: | 5.3% (110,239) |
Number of households with income $40k - 50k:| Tyngsborough: | 4.0% (20,783) |
| Massachusetts: | 5.0% (104,636) |
Number of households with income $50k - 60k:| Tyngsborough: | 4.3% (22,328) |
| State: | 4.8% (99,486) |
Number of households with income $60k - 75k:| Tyngsborough: | 6.6% (34,028) |
| Massachusetts: | 7.5% (155,124) |
Number of households with income $75k - 100k:| Tyngsborough: | 10.1% (52,373) |
| Massachusetts: | 11.4% (236,252) |
Number of households with income $100k - 125k:| Tyngsborough: | 8.8% (45,476) |
| State: | 9.9% (204,731) |
Number of households with income $125k - 150k:| Tyngsborough: | 8.1% (42,002) |
| State: | 8.5% (175,324) |
Number of households with income $150k - 200k:| Tyngsborough: | 13.2% (68,470) |
| State: | 11.7% (242,980) |
Number of households with income > $200k:| Tyngsborough: | 28.2% (145,670) |
| State: | 20.5% (425,966) |
Aggregate household income in Tyngsborough in 2022: $10,169,163,513
Median family income in Tyngsborough in 2022:| Tyngsborough: | $166,794 |
| Massachusetts: | $133,153 |
Number of families with income < $10k:| Tyngsborough: | 1.8% (33) |
| State: | 2.0% (25,038) |
Number of families with income $10k - 20k:| Tyngsborough: | 2.2% (42) |
| State: | 2.1% (26,403) |
Number of families with income $20k - 30k:| Tyngsborough: | 1.7% (31) |
| Massachusetts: | 2.6% (32,525) |
Number of families with income $30k - 40k:| Tyngsborough: | 3.0% (56) |
| State: | 3.9% (48,079) |
Number of families with income $40k - 50k:| Tyngsborough: | 4.9% (91) |
| Massachusetts: | 3.8% (46,908) |
Number of families with income $50k - 60k:| Tyngsborough: | 3.6% (68) |
| Massachusetts: | 3.8% (46,476) |
Number of families with income $60k - 75k:| Tyngsborough: | 5.4% (101) |
| State: | 6.4% (79,040) |
Number of families with income $75k - 100k:| Tyngsborough: | 18.0% (338) |
| State: | 11.1% (137,395) |
Number of families with income $100k - 125k:| Tyngsborough: | 12.2% (230) |
| State: | 11.1% (136,771) |
Number of families with income $125k - 150k:| Tyngsborough: | 9.8% (184) |
| State: | 10.0% (123,709) |
Number of families with income $150k - 200k:| Tyngsborough: | 15.4% (288) |
| State: | 14.7% (181,602) |
Number of families with income > $200k:| Tyngsborough: | 22.0% (412) |
| State: | 28.5% (351,887) |
Median non-family income in Tyngsborough in 2022:| Tyngsborough: | $73,682 |
| State: | $59,323 |
Change in median non-family income between 2000 and 2022:| Tyngsborough, Massachusetts: | +90.7% |
| Massachusetts: | +94.3% |
Median per capita income in Tyngsborough in 2022:| Tyngsborough: | $57,512 |
| Massachusetts: | $60,804 |
Change in median per capita income between 2000 and 2022:| Tyngsborough, Massachusetts: | +117.3% |
| State: | +118.7% |
Income statistics for Black or African American residents
Median household income in Tyngsborough, MA in 2022:| Tyngsborough: | $154,538 |
| State: | $63,189 |
Change in median household income between 2000 and 2022:| Tyngsborough, Massachusetts: | +92.0% |
| State: | +87.4% |
Number of households with income < $10k:| Tyngsborough: | 5.7% (2,920) |
| State: | 9.1% (15,797) |
Number of households with income $10k - 20k:| Tyngsborough: | 7.1% (3,665) |
| Massachusetts: | 9.4% (16,267) |
Number of households with income $20k - 30k:| Tyngsborough: | 4.3% (2,227) |
| State: | 7.8% (13,520) |
Number of households with income $30k - 40k:| Tyngsborough: | 6.4% (3,317) |
| Massachusetts: | 8.3% (14,412) |
Number of households with income $40k - 50k:| Tyngsborough: | 9.6% (4,932) |
| Massachusetts: | 7.9% (13,790) |
Number of households with income $50k - 60k:| Tyngsborough: | 5.7% (2,932) |
| State: | 5.8% (10,041) |
Number of households with income $60k - 75k:| Tyngsborough: | 8.9% (4,595) |
| Massachusetts: | 8.5% (14,822) |
Number of households with income $75k - 100k:| Tyngsborough: | 13.0% (6,691) |
| Massachusetts: | 11.0% (19,122) |
Number of households with income $100k - 125k:| Tyngsborough: | 8.1% (4,177) |
| Massachusetts: | 8.4% (14,575) |
Number of households with income $125k - 150k:| Tyngsborough: | 6.7% (3,460) |
| State: | 6.0% (10,429) |
Number of households with income $150k - 200k:| Tyngsborough: | 11.2% (5,758) |
| State: | 7.2% (12,539) |
Number of households with income > $200k:| Tyngsborough: | 13.3% (6,828) |
| State: | 10.5% (18,185) |
Aggregate household income in Tyngsborough in 2022: $3,141,876
Median family income in Tyngsborough in 2022:| Tyngsborough: | $186,258 |
| Massachusetts: | $79,815 |
Number of families with income $75k - 100k:| Tyngsborough: | 100.0% (19) |
| State: | 11.5% (12,654) |
Median per capita income in Tyngsborough in 2022:| Tyngsborough: | $43,832 |
| Massachusetts: | $33,524 |
Change in median per capita income between 2000 and 2022:| Tyngsborough, Massachusetts: | +98.1% |
| State: | +109.4% |
Income statistics for Asian residents
Median household income in Tyngsborough, MA in 2022:| Tyngsborough: | $220,129 |
| State: | $117,855 |
Change in median household income between 2000 and 2022:| Tyngsborough, Massachusetts: | +108.1% |
| State: | +129.9% |
Number of households with income < $10k:| Tyngsborough: | 6.0% (7,814) |
| State: | 6.8% (11,982) |
Number of households with income $10k - 20k:| Tyngsborough: | 3.1% (4,033) |
| Massachusetts: | 4.8% (8,376) |
Number of households with income $20k - 30k:| Tyngsborough: | 1.9% (2,529) |
| State: | 3.7% (6,558) |
Number of households with income $30k - 40k:| Tyngsborough: | 2.4% (3,110) |
| State: | 3.3% (5,748) |
Number of households with income $40k - 50k:| Tyngsborough: | 4.4% (5,681) |
| State: | 4.1% (7,192) |
Number of households with income $50k - 60k:| Tyngsborough: | 4.3% (5,608) |
| State: | 5.0% (8,734) |
Number of households with income $60k - 75k:| Tyngsborough: | 4.5% (5,838) |
| State: | 5.8% (10,203) |
Number of households with income $75k - 100k:| Tyngsborough: | 7.9% (10,316) |
| State: | 8.6% (15,154) |
Number of households with income $100k - 125k:| Tyngsborough: | 13.0% (16,915) |
| State: | 10.8% (18,942) |
Number of households with income $125k - 150k:| Tyngsborough: | 8.3% (10,795) |
| Massachusetts: | 8.0% (14,037) |
Number of households with income $150k - 200k:| Tyngsborough: | 11.1% (14,446) |
| Massachusetts: | 12.5% (21,856) |
Number of households with income > $200k:| Tyngsborough: | 32.9% (42,765) |
| State: | 26.6% (46,694) |
Aggregate household income in Tyngsborough in 2022: $109,031,077
Median family income in Tyngsborough in 2022:| Tyngsborough: | $234,602 |
| Massachusetts: | $140,113 |
Number of families with income $40k - 50k:| Tyngsborough: | 3.3% (11) |
| State: | 3.9% (4,621) |
Number of families with income $60k - 75k:| Tyngsborough: | 2.7% (9) |
| State: | 6.1% (7,105) |
Number of families with income $75k - 100k:| Tyngsborough: | 6.2% (21) |
| State: | 8.5% (10,022) |
Number of families with income $100k - 125k:| Tyngsborough: | 7.9% (27) |
| State: | 10.0% (11,697) |
Number of families with income $125k - 150k:| Tyngsborough: | 6.0% (21) |
| State: | 8.6% (10,071) |
Number of families with income $150k - 200k:| Tyngsborough: | 14.1% (49) |
| State: | 13.2% (15,478) |
Number of families with income > $200k:| Tyngsborough: | 60.0% (208) |
| State: | 34.0% (39,856) |
Median per capita income in Tyngsborough in 2022:| Tyngsborough: | $178,303 |
| Massachusetts: | $58,900 |
Income statistics for Hispanic or Latino residents
Median household income in Tyngsborough, MA in 2022:| Tyngsborough: | $140,372 |
| State: | $61,523 |
Change in median household income between 2000 and 2022:| Tyngsborough, Massachusetts: | +138.1% |
| Massachusetts: | +125.4% |
Number of households with income < $10k:| Tyngsborough: | 6.6% (4,222) |
| State: | 8.8% (25,307) |
Number of households with income $10k - 20k:| Tyngsborough: | 7.1% (4,514) |
| State: | 10.0% (28,653) |
Number of households with income $20k - 30k:| Tyngsborough: | 6.0% (3,862) |
| Massachusetts: | 8.8% (25,189) |
Number of households with income $30k - 40k:| Tyngsborough: | 3.4% (2,165) |
| State: | 7.2% (20,822) |
Number of households with income $40k - 50k:| Tyngsborough: | 6.4% (4,083) |
| Massachusetts: | 7.2% (20,817) |
Number of households with income $50k - 60k:| Tyngsborough: | 6.1% (3,929) |
| Massachusetts: | 6.5% (18,748) |
Number of households with income $60k - 75k:| Tyngsborough: | 6.3% (4,032) |
| State: | 8.8% (25,390) |
Number of households with income $75k - 100k:| Tyngsborough: | 11.4% (7,312) |
| State: | 12.0% (34,488) |
Number of households with income $100k - 125k:| Tyngsborough: | 10.6% (6,773) |
| State: | 8.6% (24,599) |
Number of households with income $125k - 150k:| Tyngsborough: | 7.5% (4,795) |
| State: | 6.2% (17,743) |
Number of households with income $150k - 200k:| Tyngsborough: | 11.4% (7,290) |
| Massachusetts: | 7.3% (21,017) |
Number of households with income > $200k:| Tyngsborough: | 17.2% (10,998) |
| Massachusetts: | 8.6% (24,606) |
Aggregate household income in Tyngsborough in 2022: $8,360,523
Median family income in Tyngsborough in 2022:| Tyngsborough: | $145,157 |
| State: | $66,072 |
Number of families with income < $10k:| Tyngsborough: | 3.2% (7) |
| State: | 6.2% (12,456) |
Number of families with income $10k - 20k:| Tyngsborough: | 5.8% (13) |
| State: | 6.0% (12,071) |
Number of families with income $20k - 30k:| Tyngsborough: | 4.1% (9) |
| State: | 10.1% (20,376) |
Number of families with income $30k - 40k:| Tyngsborough: | 3.3% (7) |
| State: | 8.2% (16,470) |
Number of families with income $40k - 50k:| Tyngsborough: | 6.6% (15) |
| State: | 7.4% (14,829) |
Number of families with income $50k - 60k:| Tyngsborough: | 7.9% (18) |
| State: | 7.3% (14,643) |
Number of families with income $60k - 75k:| Tyngsborough: | 8.7% (20) |
| State: | 10.6% (21,252) |
Number of families with income $75k - 100k:| Tyngsborough: | 22.7% (51) |
| State: | 12.0% (24,088) |
Number of families with income $100k - 125k:| Tyngsborough: | 12.4% (28) |
| State: | 8.9% (17,954) |
Number of families with income $125k - 150k:| Tyngsborough: | 7.0% (16) |
| State: | 6.9% (13,837) |
Number of families with income $150k - 200k:| Tyngsborough: | 9.2% (21) |
| Massachusetts: | 7.3% (14,683) |
Number of families with income > $200k:| Tyngsborough: | 9.2% (21) |
| Massachusetts: | 9.3% (18,741) |
Median non-family income in Tyngsborough in 2022:| Tyngsborough: | $7,429 |
| Massachusetts: | $37,563 |
Change in median non-family income between 2000 and 2022:| Tyngsborough, Massachusetts: | +98.1% |
| State: | +115.0% |
Median per capita income in Tyngsborough in 2022:| Tyngsborough: | $35,890 |
| Massachusetts: | $28,993 |
Change in median per capita income between 2000 and 2022:| Tyngsborough, Massachusetts: | +142.9% |
| State: | +142.4% |
Income statistics for American Indian and Alaska Native residents
Median household income in Tyngsborough, MA in 2022:| Tyngsborough: | $231,398 |
| State: | $87,730 |
Number of households with income < $10k:| Tyngsborough: | 6.6% (986) |
| State: | 6.6% (451) |
Number of households with income $10k - 20k:| Tyngsborough: | 7.0% (1,041) |
| State: | 7.0% (476) |
Number of households with income $20k - 30k:| Tyngsborough: | 2.8% (419) |
| Massachusetts: | 2.8% (192) |
Number of households with income $30k - 40k:| Tyngsborough: | 3.2% (477) |
| State: | 3.2% (218) |
Number of households with income $40k - 50k:| Tyngsborough: | 2.9% (435) |
| State: | 2.9% (199) |
Number of households with income $50k - 60k:| Tyngsborough: | 9.9% (1,480) |
| State: | 9.9% (677) |
Number of households with income $60k - 75k:| Tyngsborough: | 11.5% (1,708) |
| State: | 11.5% (781) |
Number of households with income $75k - 100k:| Tyngsborough: | 9.2% (1,375) |
| State: | 9.2% (629) |
Number of households with income $100k - 125k:| Tyngsborough: | 6.0% (888) |
| Massachusetts: | 6.0% (406) |
Number of households with income $125k - 150k:| Tyngsborough: | 13.5% (2,014) |
| Massachusetts: | 13.5% (921) |
Number of households with income $150k - 200k:| Tyngsborough: | 12.6% (1,878) |
| State: | 12.6% (859) |
Number of households with income > $200k:| Tyngsborough: | 14.7% (2,193) |
| Massachusetts: | 14.7% (1,003) |
Aggregate household income in Tyngsborough in 2022: $1,804,363
Median family income in Tyngsborough in 2022:| Tyngsborough: | $89,866 |
| State: | $105,715 |
Number of families with income $75k - 100k:| Tyngsborough: | 100.0% (17) |
| State: | 9.3% (297) |
Median per capita income in Tyngsborough in 2022:| Tyngsborough: | $101,435 |
| Massachusetts: | $39,434 |
Income statistics for Multirace residents
Median household income in Tyngsborough, MA in 2022:| Tyngsborough: | $90,524 |
| State: | $71,552 |
Change in median household income between 2000 and 2022:| Tyngsborough, Massachusetts: | +146.3% |
| State: | +109.0% |
Number of households with income < $10k:| Tyngsborough: | 5.4% (2,152) |
| State: | 6.6% (15,127) |
Number of households with income $10k - 20k:| Tyngsborough: | 6.0% (2,404) |
| State: | 9.2% (21,158) |
Number of households with income $20k - 30k:| Tyngsborough: | 2.8% (1,133) |
| State: | 7.8% (18,016) |
Number of households with income $30k - 40k:| Tyngsborough: | 6.0% (2,416) |
| State: | 7.9% (18,260) |
Number of households with income $40k - 50k:| Tyngsborough: | 4.1% (1,647) |
| State: | 5.6% (13,027) |
Number of households with income $50k - 60k:| Tyngsborough: | 5.9% (2,357) |
| State: | 5.6% (12,909) |
Number of households with income $60k - 75k:| Tyngsborough: | 6.7% (2,656) |
| State: | 9.0% (20,800) |
Number of households with income $75k - 100k:| Tyngsborough: | 12.9% (5,168) |
| State: | 12.1% (27,875) |
Number of households with income $100k - 125k:| Tyngsborough: | 10.7% (4,293) |
| State: | 8.1% (18,754) |
Number of households with income $125k - 150k:| Tyngsborough: | 6.4% (2,542) |
| Massachusetts: | 6.8% (15,621) |
Number of households with income $150k - 200k:| Tyngsborough: | 12.8% (5,123) |
| State: | 9.4% (21,618) |
Number of households with income > $200k:| Tyngsborough: | 20.1% (8,046) |
| State: | 12.0% (27,592) |
Aggregate household income in Tyngsborough in 2022: $27,440,580
Median family income in Tyngsborough in 2022:| Tyngsborough: | $83,655 |
| State: | $78,380 |
Number of families with income < $10k:| Tyngsborough: | 18.8% (18) |
| State: | 4.5% (7,017) |
Number of families with income $30k - 40k:| Tyngsborough: | 45.8% (44) |
| State: | 8.2% (12,705) |
Number of families with income $60k - 75k:| Tyngsborough: | 35.4% (34) |
| Massachusetts: | 10.3% (16,064) |
Median non-family income in Tyngsborough in 2022:| Tyngsborough: | $36,926 |
| Massachusetts: | $42,253 |
Median per capita income in Tyngsborough in 2022:| Tyngsborough: | $28,908 |
| Massachusetts: | $34,029 |
Change in median per capita income between 2000 and 2022:| Tyngsborough, Massachusetts: | +116.4% |
| Massachusetts: | +132.1% |
Income statistics for other residents
Number of households with income < $10k:| Tyngsborough: | 8.8% (6) |
| State: | 8.4% (11,559) |
Number of households with income $10k - 20k:| Tyngsborough: | 5.9% (4) |
| Massachusetts: | 8.4% (11,499) |
Number of households with income $20k - 30k:| Tyngsborough: | 10.3% (7) |
| State: | 9.5% (13,070) |
Number of households with income $30k - 40k:| Tyngsborough: | 4.4% (3) |
| Massachusetts: | 6.0% (8,291) |
Number of households with income $40k - 50k:| Tyngsborough: | 8.8% (6) |
| Massachusetts: | 9.2% (12,611) |
Number of households with income $50k - 60k:| Tyngsborough: | 8.8% (6) |
| State: | 7.9% (10,879) |
Number of households with income $60k - 75k:| Tyngsborough: | 7.4% (5) |
| State: | 7.5% (10,239) |
Number of households with income $75k - 100k:| Tyngsborough: | 10.3% (7) |
| State: | 13.1% (18,032) |
Number of households with income $100k - 125k:| Tyngsborough: | 10.3% (7) |
| State: | 9.6% (13,141) |
Number of households with income $125k - 150k:| Tyngsborough: | 5.9% (4) |
| State: | 5.0% (6,808) |
Number of households with income $150k - 200k:| Tyngsborough: | 5.9% (4) |
| State: | 6.4% (8,843) |
Number of households with income > $200k:| Tyngsborough: | 13.2% (9) |
| State: | 9.0% (12,396) |
Aggregate household income in Tyngsborough in 2022: $8,525,548
Median family income in Tyngsborough in 2022:| Tyngsborough: | $233,650 |
| State: | $66,840 |
Number of families with income $100k - 125k:| Tyngsborough: | 42.4% (87) |
| State: | 9.3% (9,480) |
Number of families with income > $200k:| Tyngsborough: | 57.6% (118) |
| State: | 10.0% (10,188) |
Median per capita income in Tyngsborough in 2022:| Tyngsborough: | $120,057 |
| State: | $30,797 |