Old Crab Tree neighborhood in Chattanooga, Tennessee (TN), 37421 detailed profile
Settings
X


Business Search - 14 Million verified businesses
Area: 0.437 square miles
Population: 1,526
Population density:
| Old Crab Tree: | 3,490 people per square mile |
| Chattanooga: | 1,361 people per square mile |

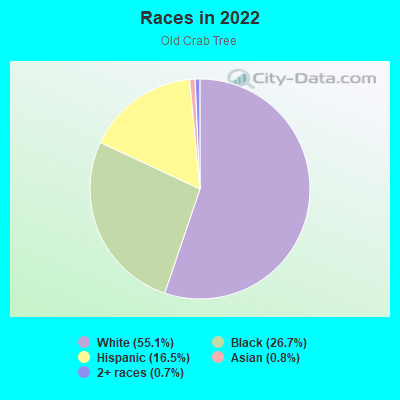
- 84355.1%White
- 40926.7%Black
- 25316.5%Hispanic or Latino
- 120.8%Asian
- 110.7%Two or more races
- 10.07%American Indian
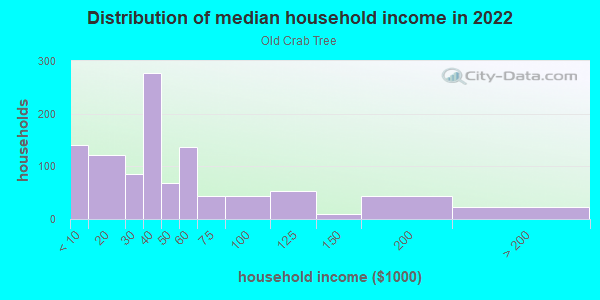
Median household income in 2022:
| Old Crab Tree: | $44,867 |
| Chattanooga: | $64,340 |
Distribution of median household income
![Distribution of median household income]()
- 140Less than $10,000
- 121$10,000 to $19,999
- 85$20,000 to $29,999
- 278$30,000 to $39,999
- 68$40,000 to $49,999
- 137$50,000 to $59,999
- 44$60,000 to $74,999
- 43$75,000 to $99,999
- 54$100,000 to $124,999
- 10$125,000 to $149,999
- 43$150,000 to $199,999
- 23$200,000 or more
Distribution of owner-occupied house/condo value
![Distribution of owner-occupied house/condo value]()
- 4Less than $50,000
- 36$50,000 to $99,999
- 43$100,000 to $149,999
- 52$150,000 to $199,999
- 24$200,000 to $249,999
- 27$250,000 to $299,999
- 59$300,000 to $399,999

Distribution of rent paid by renters
![Distribution of rent paid by renters]()
- 86Less than $100
- 104$200 to $299
- 131$400 to $499
- 14$500 to $599
- 59$600 to $699
- 23$700 to $799
- 103$800 to $899
- 141$900 to $999
- 140$1,000 to $1,249
- 84$1,250 to $1,499
- 8$1,500 to $1,999

Median rent in 2022:
| Old Crab Tree: | $900 |
| Chattanooga: | $1,009 |
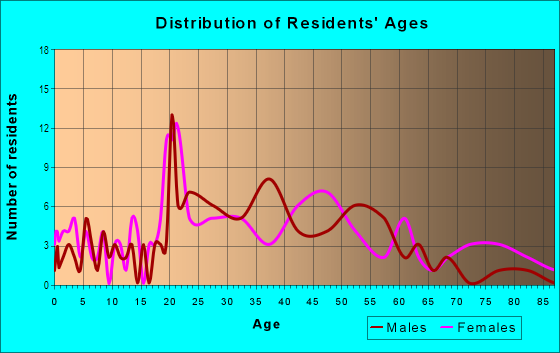
| Males: | 712 |
| Females: | 813 |
Males:
| This neighborhood: | 38.1 years |
| Whole city: | 35.0 years |
| This neighborhood: | 33.8 years |
| Whole city: | 37.5 years |
Average household size:
| Old Crab Tree: | 8.3 people |
| Chattanooga: | 2.3 people |
Percentage of family households:
| Old Crab Tree: | 35.4% |
| Chattanooga: | 38.2% |
| Here: | 13.3% |
| Chattanooga: | 38.8% |
Percentage of married-couple families with children (among all households):
| Old Crab Tree: | 26.0% |
| Chattanooga: | 26.7% |
Percentage of single-mother households (among all households):
| Old Crab Tree: | 35.8% |
| Chattanooga: | 13.0% |
Percentage of never married males 15 years old and over:
Percentage of never married females 15 years old and over:
| Old Crab Tree: | 18.3% |
| Chattanooga: | 19.0% |
Percentage of never married females 15 years old and over:
| Old Crab Tree: | 21.8% |
| city: | 17.6% |
Percentage of people that speak English not well or not at all:
| Old Crab Tree: | 9.3% |
| Chattanooga: | 2.8% |
Percentage of people born in this state:
Percentage of people born in another U.S. state:
Percentage of native residents but born outside the U.S.:
Percentage of foreign born residents:
| Here: | 52.2% |
| Chattanooga: | 54.4% |
Percentage of people born in another U.S. state:
| Old Crab Tree: | 39.7% |
| Chattanooga: | 37.8% |
Percentage of native residents but born outside the U.S.:
| Here: | 1.2% |
| city: | 0.8% |
Percentage of foreign born residents:
| Here: | 6.9% |
| Chattanooga: | 6.9% |
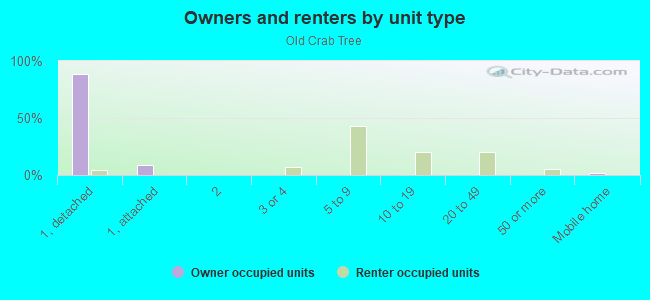
Owner-occupied
Renter-occupied

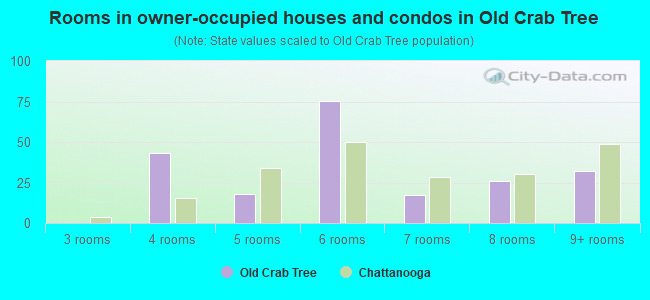
- Rooms in owner-occupied houses and condos in Old Crab Tree
- 01 room
- 02 rooms
- 03 rooms
- 434 rooms
- 185 rooms
- 756 rooms
- 177 rooms
- 268 rooms
- 329+ rooms

- Rooms in renter-occupied apartments in Old Crab Tree
- 171 room
- 1742 rooms
- 1093 rooms
- 2034 rooms
- 1715 rooms
- 386 rooms
- 07 rooms
- 178 rooms
- 09+ rooms
Owner-occupied
Renter-occupied
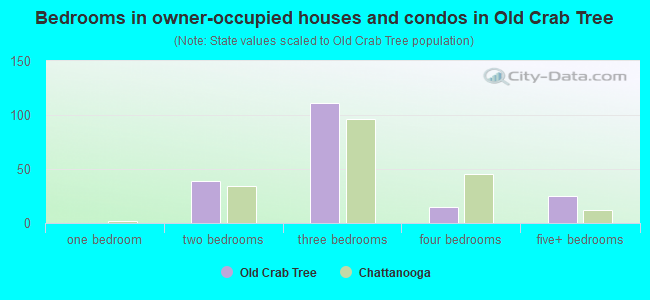
- Bedrooms in owner-occupied houses and condos in Old Crab Tree
- 0no bedroom
- 01 bedroom
- 392 bedrooms
- 1113 bedrooms
- 154 bedrooms
- 255+ bedrooms
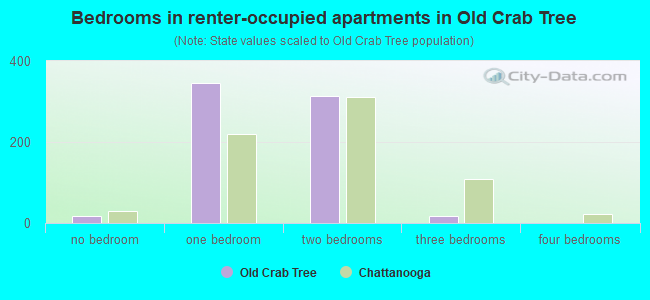
- Bedrooms in renter-occupied apartments in Old Crab Tree
- 17no bedroom
- 3451 bedroom
- 3142 bedrooms
- 173 bedrooms
- 04 bedrooms
- 05+ bedrooms
Average number of cars or other vehicles available in houses/condos:
Average number of cars or other vehicles available in apartments:
| This neighborhood: | 2.3 |
| Chattanooga: | 2.1 |
Average number of cars or other vehicles available in apartments:
| Here: | 1.3 |
| city: | 1.3 |
Percentage of units with a mortgage:
| Old Crab Tree: | 73.1% |
| Chattanooga: | 57.5% |
Average estimated value of detached houses in 2022 (25.1% of all units):
| Old Crab Tree: | $196,829 |
| Tennessee: | $374,382 |
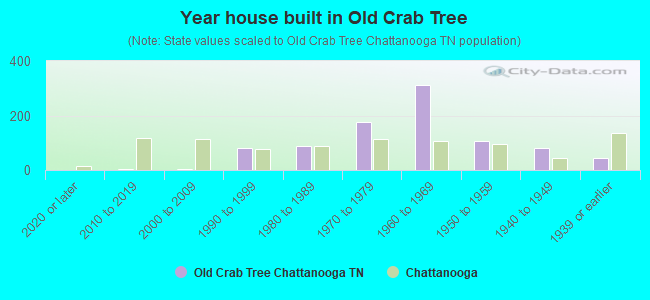
- Year house built in Old Crab Tree
- 02020 or later
- 32010 to 2019
- 52000 to 2009
- 801990 to 1999
- 881980 to 1989
- 1771970 to 1979
- 3131960 to 1969
- 1071950 to 1959
- 811940 to 1949
- 441939 or earlier
City-data.com crime index for city in 2020 (higher means more crime):
| City: | 696.9 |
| U.S. average: | 219.5 |
Travel time to work (commute)
![Travel time to work (commute)]()
- 9Less than 5 minutes
- 2005 to 9 minutes
- 9910 to 14 minutes
- 19115 to 19 minutes
- 13120 to 24 minutes
- 8425 to 29 minutes
- 5130 to 34 minutes
- 1035 to 39 minutes
- 1745 to 59 minutes
- 260 to 89 minutes

Means of transportation to work
![Means of transportation to work]()
- 91.1%692Drove a car alone
- 4.6%35Carpooled
- 7.0%53Taxi
- 5.9%45Bicycle
- 0.1%1Walked
- 2.9%22Other means
- 2.6%20Worked at home

Time leaving home to go to work
![Time leaving home to go to work]()
- 9512:00 a.m. to 4:59 a.m.
- 105:30 a.m. to 5:59 a.m.
- 756:00 a.m. to 6:29 a.m.
- 916:30 a.m. to 6:59 a.m.
- 1027:00 a.m. to 7:29 a.m.
- 547:30 a.m. to 7:59 a.m.
- 408:00 a.m. to 8:29 a.m.
- 248:30 a.m. to 8:59 a.m.
- 869:00 a.m. to 9:59 a.m.
- 210:00 a.m. to 10:59 a.m.
- 1711:00 a.m. to 11:59 a.m.
- 6412:00 p.m. to 3:59 p.m.
- 1254:00 p.m. to 11:59 p.m.

Occupations of males:
- Percentage of males in management occupations (except farmers):
Here: 1.1% city: 10.9%
- Percentage of males in business and financial operations occupations:
Here: 1.8% city: 5.8%
- Percentage of males in legal occupations:
Here: 5.7% city: 1.4%
- Percentage of males in education, training, and library occupations:
Here: 3.9% city: 3.2%
- Percentage of males in healthcare practitioners and technical occupations:
Here: 2.2% city: 3.8%
- Percentage of males in service occupations:
Here: 5.6% city: 15.6%
- Percentage of males in sales and office occupations:
Here: 20.4% city: 15.6%
- Percentage of males in construction, extraction, and maintenance occupations:
Here: 42.5% city: 7.1%
- Percentage of males in production occupations:
Here: 10.7% city: 9.6%
- Percentage of males in transportation occupations:
Here: 1.4% city: 5.4%
- Percentage of males in material moving occupations:
Here: 4.6% city: 6.7%
Occupations of females:
- Percentage of females in management occupations (except farmers):
Here: 3.3% city: 8.1%
- Percentage of females in business and financial operations occupations:
Here: 1.4% city: 6.7%
- Percentage of females in community and social services occupations:
Here: 2.0% city: 4.0%
- Percentage of females in healthcare practitioners and technical occupations:
Here: 12.1% city: 11.4%
- Percentage of females in service occupations:
Here: 49.8% city: 21.6%
- Percentage of females in sales and office occupations:
Here: 18.5% city: 25.1%
- Percentage of females in production occupations:
Here: 3.9% city: 4.9%
- Percentage of females in material moving occupations:
Here: 8.7% city: 2.2%
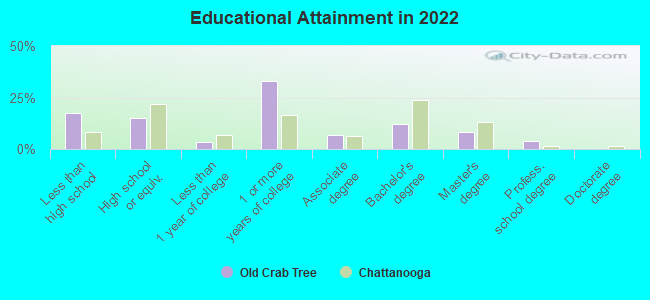
Education in this neighborhood (subdivision or community):
- Percentage of people 3 years and older in K-12 schools:
Old Crab Tree: 29.6% Chattanooga: 14.8%
- Percentage of people 3 years and older in undergraduate colleges:
Old Crab Tree: 10.6% Chattanooga: 6.2%
- Percentage of people 3 years and older in grad. or professional schools:
Old Crab Tree: 1.7% Chattanooga: 0.9%
- Percentage of students K-12 enrolled in private schools:
Old Crab Tree: 30.4% Chattanooga: 15.8%
Percentage of population below poverty level:
| Old Crab Tree: | 29.8% |
| Chattanooga: | 15.3% |
Median year owner moved in (as recorded in 2022):
Median year renter moved in (as recorded in 2022):
| Old Crab Tree: | 2011 |
| Chattanooga: | 2012 |
Median year renter moved in (as recorded in 2022):
| Old Crab Tree: | 2019 |
| Chattanooga: | 2021 |
Percentage of married-couple families with both working:
| Old Crab Tree: | 67.6% |
| Chattanooga: | 77.2% |
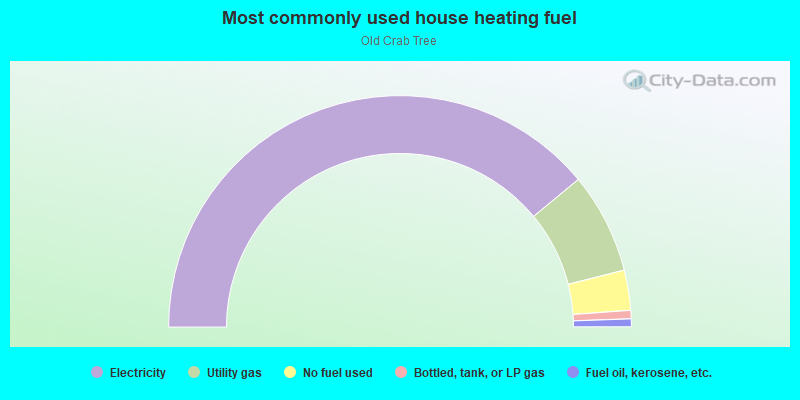
- 78.0%Electricity
- 14.1%Utility gas
- 5.6%No fuel used
- 1.2%Bottled, tank, or LP gas
- 1.1%Fuel oil, kerosene, etc.
Highways in this neighborhood:
State Hwy 2 (Lee Hwy, US Hwy 11, US Hwy 64)
Length: 0.85 miles
Direction: SW-NE
Address range: 5600 to 5999
Direction: SW-NE
Address range: 5600 to 5999
E Brainerd Rd (State Hwy 320)
Length: 0.84 miles
Directions: E-W, N-S, SE-NW
Address range: 6001 to 6199
Directions: E-W, N-S, SE-NW
Address range: 6001 to 6199
Roads and streets:
Central Dr
Length: 0.52 miles
Directions: N-S, SW-NE
Address range: 100 to 599
Directions: N-S, SW-NE
Address range: 100 to 599
Chickamauga Rd
Length: 0.51 miles
Direction: SW-NE
Address range: 100 to 499
Direction: SW-NE
Address range: 100 to 499
Friar Rd
Length: 0.37 miles
Direction: E-W
Address range: 200 to 499
Direction: E-W
Address range: 200 to 499
Nelson Dr
Length: 0.35 miles
Directions: E-W, SE-NW
Address range: 100 to 399
Directions: E-W, SE-NW
Address range: 100 to 399
Aiken Dr
Length: 0.34 miles
Directions: E-W, SE-NW
Address range: 100 to 399
Directions: E-W, SE-NW
Address range: 100 to 399
Whirlaway Dr
Length: 0.25 miles
Directions: E-W, SE-NW
Address range: 1 to 199
Directions: E-W, SE-NW
Address range: 1 to 199
N King St (NE King St)
Length: 0.24 miles
Directions: E-W, N-S, SE-NW
Directions: E-W, N-S, SE-NW
Old Birds Mill Rd
Length: 0.20 miles
Directions: E-W, SW-NE
Address range: 100 to 199
Directions: E-W, SW-NE
Address range: 100 to 199
Laverne Dr
Length: 0.17 miles
Direction: SW-NE
Address range: 300 to 499
Direction: SW-NE
Address range: 300 to 499
Melrose St
Length: 0.16 miles
Directions: N-S, SW-NE
Address range: 100 to 199
Directions: N-S, SW-NE
Address range: 100 to 199
Walker Rd
Length: 0.12 miles
Directions: N-S, SE-NW
Address range: 200 to 299
Directions: N-S, SE-NW
Address range: 200 to 299
Airport Rd
Length: 0.12 miles
Direction: SW-NE
Address range: 501 to 507
Direction: SW-NE
Address range: 501 to 507
Jubilee Dr
Length: 0.12 miles
Directions: E-W, N-S, SE-NW
Address range: 100 to 199
Directions: E-W, N-S, SE-NW
Address range: 100 to 199
Perry Rd
Length: 0.11 miles
Direction: SW-NE
Address range: 1100 to 1199
Direction: SW-NE
Address range: 1100 to 1199
Charles Dr
Length: 0.09 miles
Directions: E-W, SE-NW
Address range: 1 to 99
Directions: E-W, SE-NW
Address range: 1 to 99
Liner Ln
Length: 0.08 miles
Direction: SW-NE
Address range: 300 to 399
Direction: SW-NE
Address range: 300 to 399
Pinelawn Dr
Length: 0.07 miles
Direction: SE-NW
Direction: SE-NW