Races in Albany, Oregon (OR) Detailed Stats
Data:
Races - White alone (%)
Races - White alone (% change since 2000)
Races - Black alone (%)
Races - Black alone (% change since 2000)
Races - American Indian alone (%)
Races - American Indian alone (% change since 2000)
Races - Asian alone (%)
Races - Asian alone (% change since 2000)
Races - Hispanic (%)
Races - Hispanic (% change since 2000)
Races - Native Hawaiian and Other Pacific Islander alone (%)
Races - Native Hawaiian and Other Pacific Islander alone (% change since 2000)
Races - Two or more races(%)
Races - Two or more races(% change since 2000)
Races - Other race alone (%)
Races - Other race alone (% change since 2000)
Racial diversity
Place of birth - Born in state of residence (%)
Place of birth - Born in state of residence (%) - White
Place of birth - Born in state of residence (%) - Black or African American
Place of birth - Born in state of residence (%) - Asian
Place of birth - Born in state of residence (%) - Hispanic or Latino
Place of birth - Born in state of residence (%) - American Indian and Alaska Native
Place of birth - Born in state of residence (%) - Multirace
Place of birth - Born in state of residence (%) - Other Race
Place of birth - Born in other state (%)
Place of birth - Born in other state (%) - White
Place of birth - Born in other state (%) - Black or African American
Place of birth - Born in other state (%) - Asian
Place of birth - Born in other state (%) - Hispanic or Latino
Place of birth - Born in other state (%) - American Indian and Alaska Native
Place of birth - Born in other state (%) - Multirace
Place of birth - Born in other state (%) - Other Race
Place of birth - Native, outside of US (%)
Place of birth - Native, outside of US (%) - White
Place of birth - Native, outside of US (%) - Black or African American
Place of birth - Native, outside of US (%) - Asian
Place of birth - Native, outside of US (%) - Hispanic or Latino
Place of birth - Native, outside of US (%) - American Indian and Alaska Native
Place of birth - Native, outside of US (%) - Multirace
Place of birth - Native, outside of US (%) - Other Race
Place of birth - Foreign born (%)
Place of birth - Foreign born (%) - White
Place of birth - Foreign born (%) - Black or African American
Place of birth - Foreign born (%) - Asian
Place of birth - Foreign born (%) - Hispanic or Latino
Place of birth - Foreign born (%) - American Indian and Alaska Native
Place of birth - Foreign born (%) - Multirace
Place of birth - Foreign born (%) - Other Race
Residents speaking English at home (%)
Residents speaking English at home - Born in the United States (%)
Residents speaking English at home - Native, born elsewhere (%)
Residents speaking English at home - Foreign born (%)
Residents speaking Spanish at home (%)
Residents speaking Spanish at home - Born in the United States (%)
Residents speaking Spanish at home - Native, born elsewhere (%)
Residents speaking Spanish at home - Foreign born (%)
Residents speaking other language at home (%)
Residents speaking other language at home - Born in the United States (%)
Residents speaking other language at home - Native, born elsewhere (%)
Residents speaking other language at home - Foreign born (%)
Marital status - Never married (%)
Marital status - Now married (%)
Marital status - Separated (%)
Marital status - Widowed (%)
Marital status - Divorced (%)
Ancestries Reported - Arab (%)
Ancestries Reported - Czech (%)
Ancestries Reported - Danish (%)
Ancestries Reported - Dutch (%)
Ancestries Reported - English (%)
Ancestries Reported - French (%)
Ancestries Reported - French Canadian (%)
Ancestries Reported - German (%)
Ancestries Reported - Greek (%)
Ancestries Reported - Hungarian (%)
Ancestries Reported - Irish (%)
Ancestries Reported - Italian (%)
Ancestries Reported - Lithuanian (%)
Ancestries Reported - Norwegian (%)
Ancestries Reported - Polish (%)
Ancestries Reported - Portuguese (%)
Ancestries Reported - Russian (%)
Ancestries Reported - Scotch-Irish (%)
Ancestries Reported - Scottish (%)
Ancestries Reported - Slovak (%)
Ancestries Reported - Subsaharan African (%)
Ancestries Reported - Swedish (%)
Ancestries Reported - Swiss (%)
Ancestries Reported - Ukrainian (%)
Ancestries Reported - United States (%)
Ancestries Reported - Welsh (%)
Ancestries Reported - West Indian (%)
Ancestries Reported - Other (%)
Geographical mobility - Same house 1 year ago (%)
Geographical mobility - Same house 1 year ago (%) - White
Geographical mobility - Same house 1 year ago (%) - Black or African American
Geographical mobility - Same house 1 year ago (%) - Asian
Geographical mobility - Same house 1 year ago (%) - Hispanic or Latino
Geographical mobility - Same house 1 year ago (%) - American Indian and Alaska Native
Geographical mobility - Same house 1 year ago (%) - Multirace
Geographical mobility - Same house 1 year ago (%) - Other Race
Geographical mobility - Moved within same county (%)
Geographical mobility - Moved within same county (%) - White
Geographical mobility - Moved within same county (%) - Black or African American
Geographical mobility - Moved within same county (%) - Asian
Geographical mobility - Moved within same county (%) - Hispanic or Latino
Geographical mobility - Moved within same county (%) - American Indian and Alaska Native
Geographical mobility - Moved within same county (%) - Multirace
Geographical mobility - Moved within same county (%) - Other Race
Geographical mobility - Moved from different county within same state (%)
Geographical mobility - Moved from different county within same state (%) - White
Geographical mobility - Moved from different county within same state (%) - Black or African American
Geographical mobility - Moved from different county within same state (%) - Asian
Geographical mobility - Moved from different county within same state (%) - Hispanic or Latino
Geographical mobility - Moved from different county within same state (%) - American Indian and Alaska Native
Geographical mobility - Moved from different county within same state (%) - Multirace
Geographical mobility - Moved from different county within same state (%) - Other Race
Geographical mobility - Moved from different state (%)
Geographical mobility - Moved from different state (%) - White
Geographical mobility - Moved from different state (%) - Black or African American
Geographical mobility - Moved from different state (%) - Asian
Geographical mobility - Moved from different state (%) - Hispanic or Latino
Geographical mobility - Moved from different state (%) - American Indian and Alaska Native
Geographical mobility - Moved from different state (%) - Multirace
Geographical mobility - Moved from different state (%) - Other Race
Geographical mobility - Moved from abroad (%)
Geographical mobility - Moved from abroad (%) - White
Geographical mobility - Moved from abroad (%) - Black or African American
Geographical mobility - Moved from abroad (%) - Asian
Geographical mobility - Moved from abroad (%) - Hispanic or Latino
Geographical mobility - Moved from abroad (%) - American Indian and Alaska Native
Geographical mobility - Moved from abroad (%) - Multirace
Geographical mobility - Moved from abroad (%) - Other Race
Place of birth for the foreign-born population - Ireland (%)
Place of birth for the foreign-born population - Denmark (%)
Place of birth for the foreign-born population - Norway (%)
Place of birth for the foreign-born population - Sweden (%)
Place of birth for the foreign-born population - United Kingdom (%)
Place of birth for the foreign-born population - England (%)
Place of birth for the foreign-born population - Scotland (%)
Place of birth for the foreign-born population - Other Northern Europe (%)
Place of birth for the foreign-born population - Austria (%)
Place of birth for the foreign-born population - Belgium (%)
Place of birth for the foreign-born population - France (%)
Place of birth for the foreign-born population - Germany (%)
Place of birth for the foreign-born population - Netherlands (%)
Place of birth for the foreign-born population - Switzerland (%)
Place of birth for the foreign-born population - Other Western Europe (%)
Place of birth for the foreign-born population - Greece (%)
Place of birth for the foreign-born population - Italy (%)
Place of birth for the foreign-born population - Portugal (%)
Place of birth for the foreign-born population - Spain (%)
Place of birth for the foreign-born population - Other Southern Europe (%)
Place of birth for the foreign-born population - Albania (%)
Place of birth for the foreign-born population - Belarus (%)
Place of birth for the foreign-born population - Bosnia and Herzegovina (%)
Place of birth for the foreign-born population - Bulgaria (%)
Place of birth for the foreign-born population - Croatia (%)
Place of birth for the foreign-born population - Czechoslovakia (%)
Place of birth for the foreign-born population - Hungary (%)
Place of birth for the foreign-born population - Latvia (%)
Place of birth for the foreign-born population - Lithuania (%)
Place of birth for the foreign-born population - North Macedonia (Macedonia) (%)
Place of birth for the foreign-born population - Moldova (%)
Place of birth for the foreign-born population - Poland (%)
Place of birth for the foreign-born population - Romania (%)
Place of birth for the foreign-born population - Russia (%)
Place of birth for the foreign-born population - Serbia (%)
Place of birth for the foreign-born population - Ukraine (%)
Place of birth for the foreign-born population - Other Eastern Europe (%)
Place of birth for the foreign-born population - China (%)
Place of birth for the foreign-born population - Hong Kong (%)
Place of birth for the foreign-born population - Taiwan (%)
Place of birth for the foreign-born population - Japan (%)
Place of birth for the foreign-born population - Korea (%)
Place of birth for the foreign-born population - Other Eastern Asia (%)
Place of birth for the foreign-born population - Afghanistan (%)
Place of birth for the foreign-born population - Bangladesh (%)
Place of birth for the foreign-born population - India (%)
Place of birth for the foreign-born population - Iran (%)
Place of birth for the foreign-born population - Kazakhstan (%)
Place of birth for the foreign-born population - Nepal (%)
Place of birth for the foreign-born population - Pakistan (%)
Place of birth for the foreign-born population - Sri Lanka (%)
Place of birth for the foreign-born population - Uzbekistan (%)
Place of birth for the foreign-born population - Other South Central Asia (%)
Place of birth for the foreign-born population - Burma (%)
Place of birth for the foreign-born population - Cambodia (%)
Place of birth for the foreign-born population - Indonesia (%)
Place of birth for the foreign-born population - Laos (%)
Place of birth for the foreign-born population - Malaysia (%)
Place of birth for the foreign-born population - Philippines (%)
Place of birth for the foreign-born population - Singapore (%)
Place of birth for the foreign-born population - Thailand (%)
Place of birth for the foreign-born population - Vietnam (%)
Place of birth for the foreign-born population - Other South Eastern Asia (%)
Place of birth for the foreign-born population - Armenia (%)
Place of birth for the foreign-born population - Iraq (%)
Place of birth for the foreign-born population - Israel (%)
Place of birth for the foreign-born population - Jordan (%)
Place of birth for the foreign-born population - Kuwait (%)
Place of birth for the foreign-born population - Lebanon (%)
Place of birth for the foreign-born population - Saudi Arabia (%)
Place of birth for the foreign-born population - Syria (%)
Place of birth for the foreign-born population - Turkey (%)
Place of birth for the foreign-born population - Yemen (%)
Place of birth for the foreign-born population - Other Western Asia (%)
Place of birth for the foreign-born population - Eritrea (%)
Place of birth for the foreign-born population - Ethiopia (%)
Place of birth for the foreign-born population - Kenya (%)
Place of birth for the foreign-born population - Somalia (%)
Place of birth for the foreign-born population - Uganda (%)
Place of birth for the foreign-born population - Zimbabwe (%)
Place of birth for the foreign-born population - Other Eastern Africa (%)
Place of birth for the foreign-born population - Cameroon (%)
Place of birth for the foreign-born population - Congo (%)
Place of birth for the foreign-born population - Democratic Republic of Congo (Zaire) (%)
Place of birth for the foreign-born population - Other Middle Africa (%)
Place of birth for the foreign-born population - Egypt (%)
Place of birth for the foreign-born population - Morocco (%)
Place of birth for the foreign-born population - Sudan (%)
Place of birth for the foreign-born population - Other Northern Africa (%)
Place of birth for the foreign-born population - South Africa (%)
Place of birth for the foreign-born population - Other Southern Africa (%)
Place of birth for the foreign-born population - Cabo Verde (%)
Place of birth for the foreign-born population - Ghana (%)
Place of birth for the foreign-born population - Liberia (%)
Place of birth for the foreign-born population - Nigeria (%)
Place of birth for the foreign-born population - Senegal (%)
Place of birth for the foreign-born population - Sierra Leone (%)
Place of birth for the foreign-born population - Other Western Africa (%)
Place of birth for the foreign-born population - Australia (%)
Place of birth for the foreign-born population - New Zealand (%)
Place of birth for the foreign-born population - Fiji (%)
Place of birth for the foreign-born population - Micronesia (%)
Place of birth for the foreign-born population - Bahamas (%)
Place of birth for the foreign-born population - Barbados (%)
Place of birth for the foreign-born population - Cuba (%)
Place of birth for the foreign-born population - Dominica (%)
Place of birth for the foreign-born population - Dominican Republic (%)
Place of birth for the foreign-born population - Grenada (%)
Place of birth for the foreign-born population - Haiti (%)
Place of birth for the foreign-born population - Jamaica (%)
Place of birth for the foreign-born population - St. Vincent and the Grenadines (%)
Place of birth for the foreign-born population - Trinidad and Tobago (%)
Place of birth for the foreign-born population - West Indies (%)
Place of birth for the foreign-born population - Other Caribbean (%)
Place of birth for the foreign-born population - Belize (%)
Place of birth for the foreign-born population - Costa Rica (%)
Place of birth for the foreign-born population - El Salvador (%)
Place of birth for the foreign-born population - Guatemala (%)
Place of birth for the foreign-born population - Honduras (%)
Place of birth for the foreign-born population - Mexico (%)
Place of birth for the foreign-born population - Nicaragua (%)
Place of birth for the foreign-born population - Panama (%)
Place of birth for the foreign-born population - Other Central America (%)
Place of birth for the foreign-born population - Argentina (%)
Place of birth for the foreign-born population - Bolivia (%)
Place of birth for the foreign-born population - Brazil (%)
Place of birth for the foreign-born population - Chile (%)
Place of birth for the foreign-born population - Colombia (%)
Place of birth for the foreign-born population - Ecuador (%)
Place of birth for the foreign-born population - Guyana (%)
Place of birth for the foreign-born population - Peru (%)
Place of birth for the foreign-born population - Uruguay (%)
Place of birth for the foreign-born population - Venezuela (%)
Place of birth for the foreign-born population - Other South America (%)
Place of birth for the foreign-born population - Canada (%)
Place of birth for the foreign-born population - Other Northern America (%)
Place of birth for the foreign-born population - Other (%)
Latest news about races in Albany, OR collected exclusively by city-data.com from local newspapers, TV, and radio stations
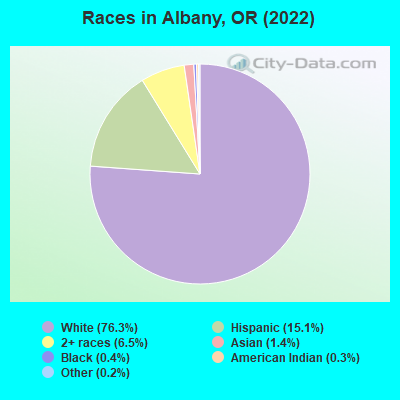
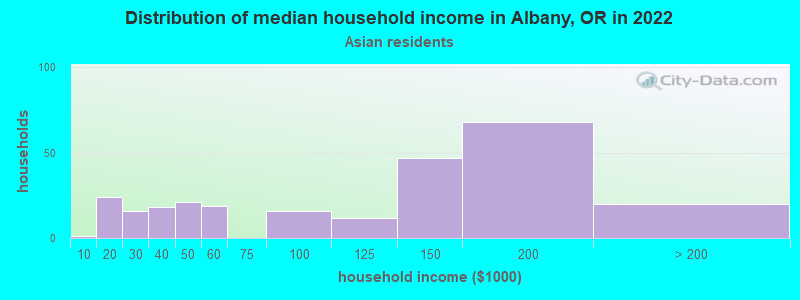
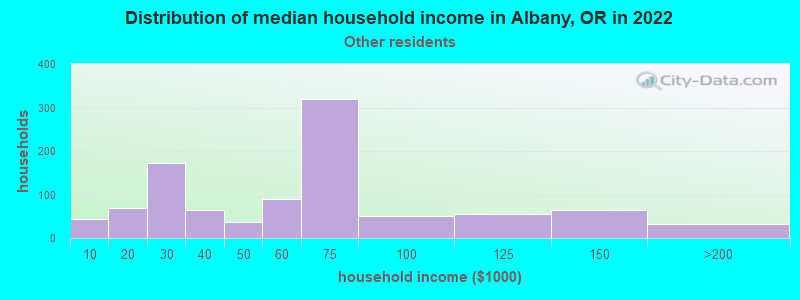
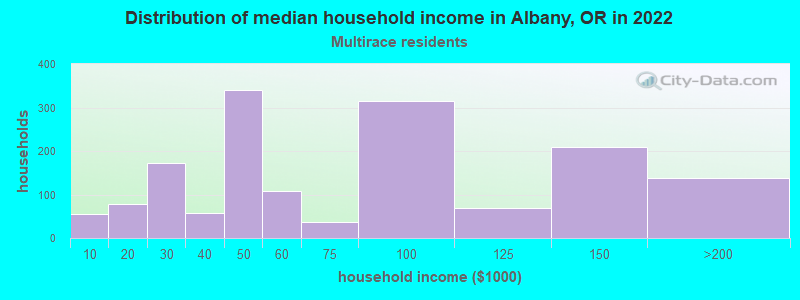
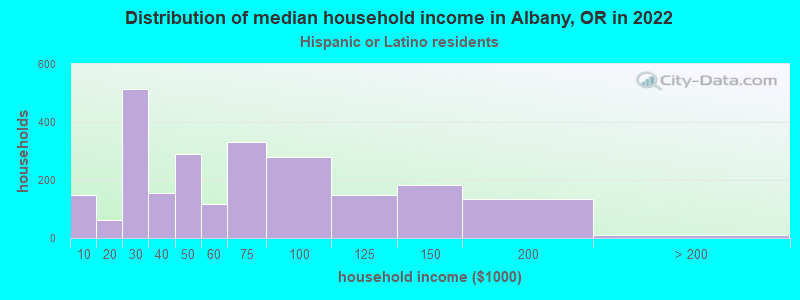
According to 2022 data, the most numerous races in Albany, OR are White alone (43,606 residents), Hispanic (8,642 residents), and Two or more races (3,718 residents). 89.1% of Albany residents speak English at home. 5.8% of Albany, OR residents are foreign-born (3.3% born in Latin America, 1.2% born in Asia, 0.9% born in Europe), which is 55.7% less than the foreign-born rate of 9.0% across the entire state of Oregon.
Race distribution in Albany
2000 2022
2,857,616 83.5% White alone 275,314 8.0% Hispanic 100,333 2.9% Asian alone 82,733 2.4% Two or more races 53,325 1.6% Black alone 40,130 1.2% American Indian alone 7,398 0.2% Native Hawaiian and Other 4,550 0.1% Other race alone
3,037,571 71.6% White alone 609,538 14.4% Hispanic 252,744 6.0% Two or more races 191,283 4.5% Asian alone 78,228 1.8% Black alone 29,399 0.7% American Indian alone 25,731 0.6% Other race alone 15,643 0.4% Native Hawaiian and Other
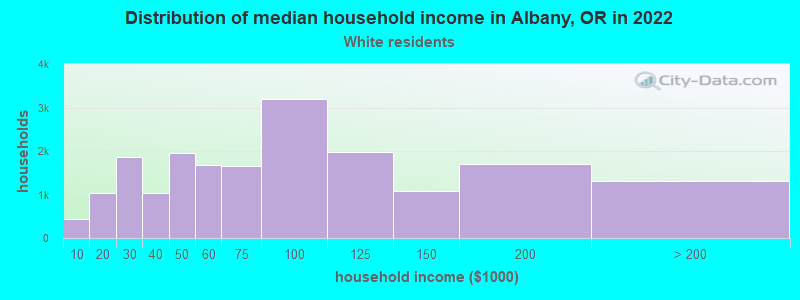
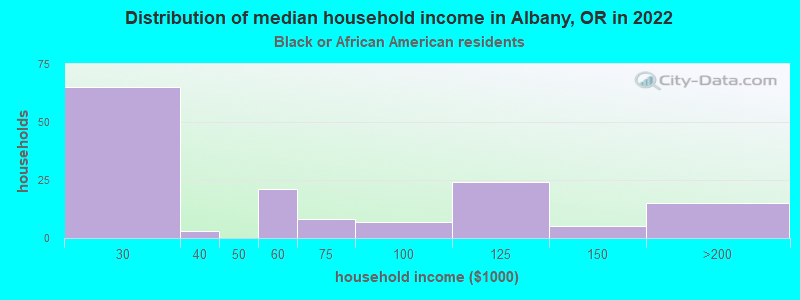
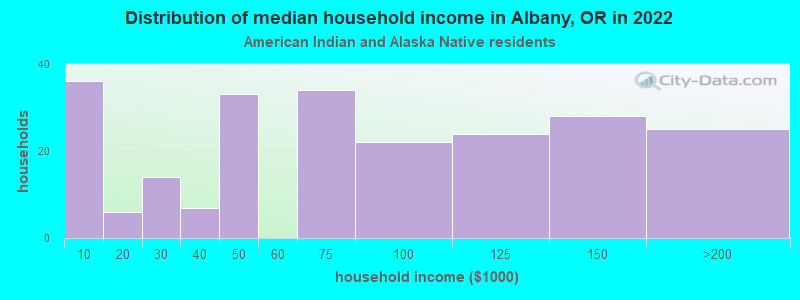
Income and house value in Albany Median household income in 2022 $74,235 White non-Hispanic householders$60,622 Black householders$69,545 American Indian and Alaska Native householders$110,410 Asian householders$146,563 Native Hawaiian and other Pacific Islander householders$45,486 Some other race householders$55,119 Two or more races householders$47,445 Hispanic or Latino race householdersMedian 2022 house value $412,978 White Non-Hispanic householders$443,142 Black or African American householders$566,290 American Indian or Alaska Native householders $391,209 Asian householders$295,428 Native Hawaiian and other Pacific Islander householders$371,929 Some other race householders$379,081 Two or more races householders$380,014 Hispanic or Latino householders
Median age by race in Albany
37.9 Median age for White residents36.5 39.8 35.8 Median age for Black or African American residents41.4 33.4 27.5 Median age for American Indian / Alaska Native residents27.6 31.4 36.6 Median age for Asian residents37.8 42.0 46.7 Median age for Native Hawaiian / Pacific Islander residents-666,666,666.0 47.7 27.4 Median age for Other race residents29.9 25.7 29.0 Median age for Two or more races residents24.7 34.2 38.4 Median age for White alone residents37.6 40.2 24.6 Median age for Hispanic or Latino residents24.9 25.5
Owner/renter occupied households by race in Albany
House owners and renters - White residents 11,706 62.9% Owner occupied6,910 37.1% Renter occupiedHouse owners and renters - Black or African American residents 19 10.7% Owner occupied160 89.3% Renter occupiedHouse owners and renters - American Indian / Alaska Native residents 100 49.6% Owner occupied102 50.4% Renter occupiedHouse owners and renters - Asian residents 182 68.9% Owner occupied82 31.1% Renter occupiedHouse owners and renters - Native Hawaiian / Pacific Islander residents 9 87.0% Owner occupied1 13.0% Renter occupiedHouse owners and renters - Other race residents 506 38.3% Owner occupied814 61.7% Renter occupiedHouse owners and renters - Two or more races residents 928 61.9% Owner occupied572 38.1% Renter occupiedHouse owners and renters - White alone residents 11,307 62.7% Owner occupied6,733 37.3% Renter occupiedHouse owners and renters - Hispanic or Latino residents 1,252 50.8% Owner occupied1,214 49.2% Renter occupied
Language usage in Albany
English speakers - Total 89.1% of residents of Albany speak English at home.
8.6% of residents speak Spanish at home 2,453 53.6% Speak English very well2,122 46.4% Speak English less than very well2.5% of residents speak other language at home 458 34.6% Speak English very well865 65.4% Speak English less than very well
English speakers - Born in the United States 95.8% of residents of Albany speak English at home.
3.6% of residents speak Spanish at home 470 66.7% Speak English very well235 33.3% Speak English less than very well0.3% of residents speak other language at home 60 100.0% Speak English very well
English speakers - Native, born elsewhere 62.7% of residents of Albany speak English at home.
8.3% of residents speak Spanish at home 48 96.0% Speak English very well2 4.0% Speak English less than very well
English speakers - Foreign-born 40.5% of residents of Albany speak English at home.
36.3% of residents speak Spanish at home 232 15.9% Speak English very well1,230 84.1% Speak English less than very well27.5% of residents speak other language at home 332 29.9% Speak English very well777 70.1% Speak English less than very well
White (Caucasian) - Speak only English Native:
97.4% (40,375)Foreign-born:
62.0% (789)
White (Caucasian) - Speak another language Native:
2.5% (1,019)Foreign-born:
39.1% (497)
Black or African American - Speak only English Native:
99.5% (279)Foreign-born:
72.4% (10)
American Indian / Alaska Native - Speak only English Native:
88.9% (544)Foreign-born:
48.0% (34)
American Indian / Alaska Native - Speak another language Native:
11.2% (68)Foreign-born:
45.0% (32)
Asian - Speak only English Native:
87.6% (267)Foreign-born:
29.4% (179)
Asian - Speak another language Native:
13.5% (41)Foreign-born:
71.3% (433)
Other race - Speak only English Native:
20.6% (495)Foreign-born:
11.8% (151)
Other race - Speak another language Native:
79.3% (1,905)Foreign-born:
65.8% (846)
Two or more races - Speak only English Native:
90.3% (4,110)Foreign-born:
26.5% (149)
Two or more races - Speak another language Native:
7.9% (361)Foreign-born:
66.8% (376)
White alone - Speak only English Native:
98.2% (39,100)Foreign-born:
63.2% (728)
White alone - Speak another language Native:
1.8% (700)Foreign-born:
37.0% (426)
Hispanic or Latino - Speak only English Native:
52.2% (2,903)Foreign-born:
11.7% (230)
Hispanic or Latino - Speak another language Native:
47.9% (2,660)Foreign-born:
72.8% (1,434)
Foreign-born residents in Albany 3,304 residents are foreign born (3.3% Latin America , 1.2% Asia , 0.9% Europe ).
This city:
5.8%Oregon:
9.8%
Marital status for residents in Albany Marital status - White (Caucasian) population 15 years and over
Males 30.3% Never married54.2% Now married1.4% Separated1.6% Widowed12.5% DivorcedFemales 28.0% Never married46.8% Now married1.6% Separated6.5% Widowed17.2% DivorcedWomen who gave birth in the past 12 months Now married:
87.8% (415)Unmarried:
12.2% (57)
Women who did not give birth in the past 12 months Now married:
43.2% (4,568)Unmarried:
56.8% (6,003)
Marital status - Black or African American population 15 years and over
Males 53.9% Never married46.1% Now married0.0% Separated0.0% Widowed0.0% DivorcedFemales 87.2% Never married7.7% Now married0.0% Separated1.3% Widowed3.8% DivorcedWomen who did not give birth in the past 12 months Now married:
0.0% (0)Unmarried:
100.0% (66)
Marital status - American Indian / Alaska Native population 15 years and over
Males 13.2% Never married75.0% Now married0.0% Separated4.1% Widowed7.6% DivorcedFemales 61.3% Never married36.2% Now married0.0% Separated2.5% Widowed0.0% DivorcedWomen who did not give birth in the past 12 months Now married:
32.6% (64)Unmarried:
67.4% (133)
Marital status - Asian population 15 years and over
Males 40.8% Never married59.2% Now married0.0% Separated0.0% Widowed0.0% DivorcedFemales 12.0% Never married73.4% Now married0.8% Separated3.7% Widowed10.1% DivorcedWomen who gave birth in the past 12 months Now married:
100.0% (6)Unmarried:
0.0% (0)
Women who did not give birth in the past 12 months Now married:
85.0% (241)Unmarried:
15.0% (43)
Marital status - Native Hawaiian / Pacific Islander population 15 years and over
Males 78.6% Never married21.4% Now married0.0% Separated0.0% Widowed0.0% DivorcedFemales 56.0% Never married44.0% Now married0.0% Separated0.0% Widowed0.0% DivorcedWomen who did not give birth in the past 12 months Now married:
0.0% (0)Unmarried:
100.0% (14)
Marital status - Other race population 15 years and over
Males 52.8% Never married39.5% Now married1.4% Separated0.0% Widowed6.3% DivorcedFemales 41.2% Never married50.8% Now married0.0% Separated2.5% Widowed5.6% DivorcedWomen who gave birth in the past 12 months Now married:
100.0% (113)Unmarried:
0.0% (0)
Women who did not give birth in the past 12 months Now married:
45.8% (460)Unmarried:
54.2% (545)
Marital status - Two or more races population 15 years and over
Males 46.0% Never married35.7% Now married0.0% Separated1.2% Widowed17.1% DivorcedFemales 31.9% Never married51.3% Now married0.0% Separated3.7% Widowed13.1% DivorcedWomen who gave birth in the past 12 months Now married:
44.6% (41)Unmarried:
55.4% (51)
Women who did not give birth in the past 12 months Now married:
56.8% (761)Unmarried:
43.2% (579)
Marital status - White alone, not Hispanic / Latino population 15 years and over
Males 29.1% Never married55.1% Now married1.4% Separated1.7% Widowed12.7% DivorcedFemales 27.0% Never married47.8% Now married1.5% Separated6.2% Widowed17.4% DivorcedWomen who gave birth in the past 12 months Now married:
87.8% (419)Unmarried:
12.2% (58)
Women who did not give birth in the past 12 months Now married:
44.1% (4,435)Unmarried:
55.9% (5,629)
Marital status - Hispanic or Latino population 15 years and over
Males 51.6% Never married40.4% Now married0.5% Separated1.3% Widowed6.2% DivorcedFemales 43.2% Never married41.3% Now married1.0% Separated6.1% Widowed8.5% DivorcedWomen who gave birth in the past 12 months Now married:
100.0% (122)Unmarried:
0.0% (0)
Women who did not give birth in the past 12 months Now married:
39.5% (769)Unmarried:
60.5% (1,178)
Ancestries in Albany
2,830 11.8% German2,468 10.3% English2,316 9.7% American1,902 8.0% European1,360 5.7% Irish608 2.5% Norwegian461 1.9% African430 1.8% Scottish372 1.6% Greek302 1.3% Swedish270 1.1% Italian205 0.9% Dutch149 0.6% French147 0.6% Scandinavian142 0.6% Eastern European135 0.6% Northern European120 0.5% British117 0.5% Scotch-Irish88 0.4% Russian79 0.3% Swiss79 0.3% Danish78 0.3% French Canadian76 0.3% Finnish72 0.3% Portuguese61 0.3% Canadian53 0.2% Ukrainian51 0.2% Polish46 0.2% Czech41 0.2% Romanian38 0.2% Austrian30 0.1% Lebanese29 0.1% Nigerian27 0.1% Czechoslovakian15 0.06% Welsh13 0.05% Slavic11 0.05% Serbian10 0.04% Jamaican8 0.03% Yugoslavian7 0.03% Pennsylvania German7 0.03% Croatian6 0.03% Slovak5 0.02% Belgian
Geographical mobility in Albany Same house 1 year ago 39,861 87.9% White (Caucasian)127 44.0% Black or African American680 95.6% American Indian / Alaska Native667 73.0% Asian41 100.0% Native Hawaiian / Pacific Islander3,150 83.1% Other race4,814 84.1% Two or more races38,238 88.2% White alone, not Hispanic / Latino6,283 76.1% Hispanic or LatinoMoved within same county 3,131 6.9% White / Caucasian28 9.8% Black or African American24 3.4% American Indian / Alaska Native60 6.6% Asian369 9.7% Other race345 6.0% Two or more races3,013 6.9% White alone, not Hispanic / Latino1,395 16.9% Hispanic or LatinoMoved within same state 1,367 3.0% White / Caucasian30 10.4% Black or African American1 0.2% American Indian / Alaska Native74 8.1% Asian132 3.5% Other race449 7.8% Two or more races1,158 2.7% White alone, not Hispanic / Latino551 6.7% Hispanic or LatinoMoved from different state 968 2.1% White / Caucasian80 27.5% Black or African American6 0.8% American Indian / Alaska Native40 4.3% Asian16 0.4% Other race71 1.2% Two or more races918 2.1% White alone, not Hispanic / Latino103 1.2% Hispanic or LatinoMoved from abroad 98 0.2% White58 6.4% Asian57 1.5% Other race29 0.5% Two or more races103 0.2% White alone, not Hispanic / Latino93 1.1% Hispanic or Latino
Children Nativity (place of birth) in Albany
Children under 6 years - Living with two parents Both parents native 2,763 100.0% NativeBoth parents foreign-born 280 100.0% NativeOne native, one foreign-born parent 171 100.0% NativeChildren under 6 years - Living with one parent Native parent 635 100.0% NativeForeign-born parent 59 100.0% NativeChildren 6 to 17 years - Living with two parents Both parents native 4,730 99.5% Native24 0.5% Foreign-bornBoth parents foreign-born 992 97.1% Native30 2.9% Foreign-bornOne native, one foreign-born parent 269 100.0% NativeChildren 6 to 17 years - Living with one parent Native parent 2,267 100.0% NativeForeign-born parent 147 50.1% Native147 49.9% Foreign-born
Grandparents responsible for own grandchildren in Albany
Grandparents (30 to 59 years) White / Caucasian 78 22.6% Responsible for grandchildren267 77.4% Not responsible for grandchildrenOther race 24 100.0% Not responsible for grandchildrenTwo or more races 16 100.0% Not responsible for grandchildrenWhite alone, not Hispanic / Latino 78 22.5% Responsible for grandchildren268 77.5% Not responsible for grandchildrenGrandparents (60 years and over) White / Caucasian 75 28.6% Responsible for grandchildren187 71.4% Not responsible for grandchildrenTwo or more races 4 15.3% Responsible for grandchildren24 84.7% Not responsible for grandchildrenWhite alone, not Hispanic / Latino 78 29.5% Responsible for grandchildren187 70.5% Not responsible for grandchildren