Races in Altamont, Oregon (OR) Detailed Stats
Ancestries, Foreign-born residents, place of birth
Settings
X


Recent posts about races in Altamont, Oregon on our local forum with over 2,400,000 registered users:
 | Just Moved 2 Portland: Need A Rental (me & 2 cats) (18 replies) |
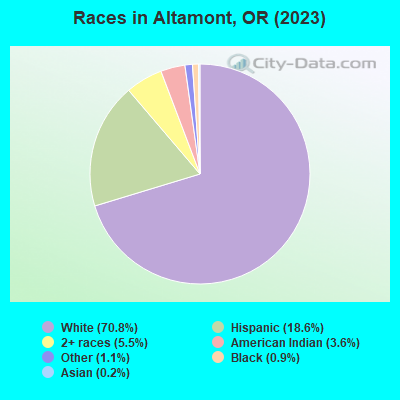
According to 2022 data, the most numerous races in Altamont, OR are White alone (14,200 residents), Hispanic (3,865 residents), and Two or more races (1,588 residents). 89.1% of Altamont residents speak English at home. 4.8% of Altamont, OR residents are foreign-born (4.0% born in Latin America, 0.6% born in Europe), which is 87.2% less than the foreign-born rate of 9.0% across the entire state of Oregon.
Race distribution in Altamont
2000
2022

- 16,83085.9%White alone
- 1,3266.8%Hispanic
- 6143.1%American Indian alone
- 5332.7%Two or more races
- 1370.7%Asian alone
- 1110.6%Black alone
- 290.1%Other race alone
- 230.1%Native Hawaiian and Other
Pacific Islander alone

-
- 14,20069.1%White alone
- 3,86518.8%Hispanic
- 1,5887.7%Two or more races
- 3311.6%American Indian alone
- 2391.2%Other race alone
- 2021.0%Black alone
- 710.3%Asian alone
- 260.1%Native Hawaiian and Other
Pacific Islander alone
2000
2022
-
- 2,857,61683.5%White alone
- 275,3148.0%Hispanic
- 100,3332.9%Asian alone
- 82,7332.4%Two or more races
- 53,3251.6%Black alone
- 40,1301.2%American Indian alone
- 7,3980.2%Native Hawaiian and Other
Pacific Islander alone - 4,5500.1%Other race alone

-
- 3,037,57171.6%White alone
- 609,53814.4%Hispanic
- 252,7446.0%Two or more races
- 191,2834.5%Asian alone
- 78,2281.8%Black alone
- 29,3990.7%American Indian alone
- 25,7310.6%Other race alone
- 15,6430.4%Native Hawaiian and Other
Pacific Islander alone

Income and house value in Altamont
- Median household income in 2022
- $52,827White non-Hispanic householders
- $38,665American Indian and Alaska Native householders
- $56,125Some other race householders
- $40,661Two or more races householders
- $78,705Hispanic or Latino race householders
- Median 2022 house value
- $259,933White Non-Hispanic householders
- $211,250Black or African American householders
- $191,545American Indian or Alaska Native householders
- $188,357Asian householders
- $217,335Native Hawaiian and other Pacific Islander householders
- $197,630Some other race householders
- $322,526Two or more races householders
- $210,380Hispanic or Latino householders
Household income for White non-Hispanic householders

Household income for Black householders

Household income for American Indian and Alaska Native householders

Household income for Some other race householders

Household income for Two or more races householders

Household income for Hispanic or Latino race householders

Median age by race in Altamont
- 40.7Median age for White residents
- 38.4Males
- 43.3Females
- 30.8Median age for Black or African American residents
- 33.8Males
- 28.8Females
- 44.9Median age for American Indian / Alaska Native residents
- 42.3Males
- 60.0Females
- 13.9Median age for Asian residents
- -696,883,852.0Males
- 15.7Females
- -764,705,881.6Median age for Native Hawaiian / Pacific Islander residents
- -764,119,600.6Males
- -774,891,774.1Females
- 25.6Median age for Other race residents
- 33.3Males
- 44.4Females
- 27.7Median age for Two or more races residents
- 30.1Males
- 27.4Females
- 41.6Median age for White alone residents
- 42.0Males
- 43.9Females
- 27.9Median age for Hispanic or Latino residents
- 25.7Males
- 24.1Females
Owner/renter occupied households by race in Altamont
- House owners and renters - White residents
- 4,81876.1%Owner occupied
- 1,51423.9%Renter occupied
- House owners and renters - Black or African American residents
- 78100.0%Renter occupied
- House owners and renters - American Indian / Alaska Native residents
- 1815.3%Owner occupied
- 9984.7%Renter occupied
- House owners and renters - Asian residents
- 18100.0%Owner occupied
- House owners and renters - Native Hawaiian / Pacific Islander residents
- 8100.0%Owner occupied
- House owners and renters - Other race residents
- 34865.2%Owner occupied
- 18534.8%Renter occupied
- House owners and renters - Two or more races residents
- 63957.9%Owner occupied
- 46542.1%Renter occupied
- House owners and renters - White alone residents
- 4,71777.0%Owner occupied
- 1,40823.0%Renter occupied
- House owners and renters - Hispanic or Latino residents
- 58561.6%Owner occupied
- 36538.4%Renter occupied
Language usage in Altamont
- English speakers - Total
- 89.1% of residents of Altamont speak English at home.
- 9.8% of residents speak Spanish at home
- 94950.3%Speak English very well
- 93949.7%Speak English less than very well
- 1.1% of residents speak other language at home
- 19090.0%Speak English very well
- 2110.0%Speak English less than very well
- English speakers - Born in the United States
- 93.9% of residents of Altamont speak English at home.
- 5.1% of residents speak Spanish at home
- 19045.6%Speak English very well
- 22754.4%Speak English less than very well
- 0.3% of residents speak other language at home
- 1881.8%Speak English very well
- 418.2%Speak English less than very well
- English speakers - Native, born elsewhere
- 53.4% of residents of Altamont speak English at home.
- 34.5% of residents speak Spanish at home
- 20100.0%Speak English very well
- 55.2% of residents speak other language at home
- 32100.0%Speak English very well
- English speakers - Foreign-born
- 11.2% of residents of Altamont speak English at home.
- 80.4% of residents speak Spanish at home
- 21626.7%Speak English very well
- 59473.3%Speak English less than very well
- 8.3% of residents speak other language at home
- 5160.7%Speak English very well
- 3339.3%Speak English less than very well
White (Caucasian) - Speak only English
| Native: | 99.7% (13,597) |
| Foreign-born: | 33.5% (90) |
White (Caucasian) - Speak another language
| Native: | 1.0% (139) |
| Foreign-born: | 64.5% (174) |
Other race - Speak another language
| Native: | 39.7% (578) |
| Foreign-born: | 100.0% (448) |
Two or more races - Speak only English
| Native: | 86.1% (2,399) |
| Foreign-born: | 19.6% (37) |
Two or more races - Speak another language
| Native: | 10.8% (300) |
| Foreign-born: | 95.7% (180) |
White alone - Speak only English
| Native: | 99.2% (13,092) |
| Foreign-born: | 80.3% (96) |
White alone - Speak another language
| Native: | 0.8% (112) |
| Foreign-born: | 21.0% (25) |
Hispanic or Latino - Speak only English
| Native: | 69.3% (1,876) |
| Foreign-born: | 5.3% (43) |
Hispanic or Latino - Speak another language
| Native: | 30.0% (812) |
| Foreign-born: | 99.3% (798) |
Foreign-born residents in Altamont
988 residents are foreign born (4.0% Latin America, 0.6% Europe).
| This city: | 4.8% |
| Oregon: | 9.8% |


Marital status for residents in Altamont
Marital status - White (Caucasian) population 15 years and over
- Males
- 26.5%Never married
- 53.1%Now married
- 1.6%Separated
- 4.0%Widowed
- 14.7%Divorced
- Females
- 20.1%Never married
- 47.9%Now married
- 0.7%Separated
- 12.8%Widowed
- 18.5%Divorced
Women who gave birth in the past 12 months
| Now married: | 86.5% (130) |
| Unmarried: | 13.5% (20) |
Women who did not give birth in the past 12 months
| Now married: | 45.9% (1,269) |
| Unmarried: | 54.1% (1,495) |
Marital status - Black or African American population 15 years and over
- Males
- 90.7%Never married
- 0.0%Now married
- 0.0%Separated
- 0.0%Widowed
- 9.3%Divorced
- Females
- 71.3%Never married
- 0.0%Now married
- 0.0%Separated
- 0.0%Widowed
- 28.7%Divorced
Women who did not give birth in the past 12 months
| Now married: | 0.0% (0) |
| Unmarried: | 100.0% (93) |
Marital status - American Indian / Alaska Native population 15 years and over
- Males
- 33.2%Never married
- 51.1%Now married
- 0.0%Separated
- 10.0%Widowed
- 5.8%Divorced
- Females
- 36.7%Never married
- 24.4%Now married
- 0.0%Separated
- 20.8%Widowed
- 18.0%Divorced
Women who did not give birth in the past 12 months
| Now married: | 5.5% (7) |
| Unmarried: | 94.5% (114) |
Marital status - Asian population 15 years and over
- Males
- 0.0%Never married
- 100.0%Now married
- 0.0%Separated
- 0.0%Widowed
- 0.0%Divorced
- Females
- 78.8%Never married
- 21.2%Now married
- 0.0%Separated
- 0.0%Widowed
- 0.0%Divorced
Women who did not give birth in the past 12 months
| Now married: | 21.3% (18) |
| Unmarried: | 78.8% (66) |
Marital status - Other race population 15 years and over
- Males
- 51.6%Never married
- 42.9%Now married
- 0.0%Separated
- 0.0%Widowed
- 5.4%Divorced
- Females
- 68.3%Never married
- 24.1%Now married
- 0.0%Separated
- 0.0%Widowed
- 7.6%Divorced
Women who did not give birth in the past 12 months
| Now married: | 19.4% (145) |
| Unmarried: | 80.6% (602) |
Marital status - Two or more races population 15 years and over
- Males
- 30.4%Never married
- 39.6%Now married
- 1.7%Separated
- 17.3%Widowed
- 11.0%Divorced
- Females
- 25.0%Never married
- 57.7%Now married
- 0.4%Separated
- 0.0%Widowed
- 17.0%Divorced
Women who did not give birth in the past 12 months
| Now married: | 50.5% (341) |
| Unmarried: | 49.5% (335) |
Marital status - White alone, not Hispanic / Latino population 15 years and over
- Males
- 25.3%Never married
- 53.1%Now married
- 1.7%Separated
- 4.2%Widowed
- 15.6%Divorced
- Females
- 20.9%Never married
- 48.0%Now married
- 0.8%Separated
- 12.6%Widowed
- 17.7%Divorced
Women who gave birth in the past 12 months
| Now married: | 84.9% (116) |
| Unmarried: | 15.1% (21) |
Women who did not give birth in the past 12 months
| Now married: | 45.0% (1,206) |
| Unmarried: | 55.0% (1,472) |
Marital status - Hispanic or Latino population 15 years and over
- Males
- 46.5%Never married
- 48.4%Now married
- 0.0%Separated
- 2.0%Widowed
- 3.1%Divorced
- Females
- 40.6%Never married
- 38.4%Now married
- 0.0%Separated
- 4.2%Widowed
- 16.8%Divorced
Women who gave birth in the past 12 months
| Now married: | 100.0% (17) |
| Unmarried: | 0.0% (0) |
Women who did not give birth in the past 12 months
| Now married: | 33.6% (290) |
| Unmarried: | 66.4% (573) |
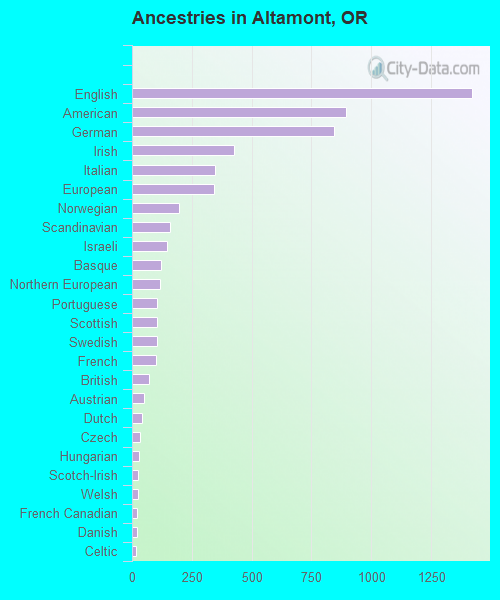
Ancestries in Altamont

- 1,42114.2%English
- 8959.0%American
- 8468.5%German
- 4254.3%Irish
- 3463.5%Italian
- 3443.4%European
- 1982.0%Norwegian
- 1601.6%Scandinavian
- 1451.5%Israeli
- 1221.2%Basque
- 1161.2%Northern European
- 1031.0%Portuguese
- 1031.0%Scottish
- 1031.0%Swedish
- 1021.0%French
- 690.7%British
- 510.5%Austrian
- 420.4%Dutch
- 330.3%Czech
- 290.3%Hungarian
- 260.3%Scotch-Irish
- 250.3%Welsh
- 210.2%French Canadian
- 190.2%Danish
- 170.2%Celtic
- 140.1%Croatian
- 130.1%Eastern European
- 100.1%Latvian
- 100.1%Polish
Geographical mobility in Altamont

- Same house 1 year ago
- 13,66792.4%White (Caucasian)
- 63.2%Black or African American
- 29680.6%American Indian / Alaska Native
- 4541.2%Asian
- 1174.9%Native Hawaiian / Pacific Islander
- 2,11197.3%Other race
- 2,94190.7%Two or more races
- 13,02892.5%White alone, not Hispanic / Latino
- 3,75695.4%Hispanic or Latino

-
- Moved within same county
- 7715.2%White / Caucasian
- 10159.1%Black or African American
- 4512.3%American Indian / Alaska Native
- 2321.3%Asian
- 110.5%Other race
- 601.9%Two or more races
- 6514.6%White alone, not Hispanic / Latino
- 1223.1%Hispanic or Latino

-
- Moved within same state
- 3532.4%White / Caucasian
- 21.4%Black or African American
- 143.9%American Indian / Alaska Native
- 3734.2%Asian
- 622.9%Other race
- 110.3%Two or more races
- 3622.6%White alone, not Hispanic / Latino
- 1032.6%Hispanic or Latino

-
- Moved from different state
- 2211.5%White / Caucasian
- 31.7%Black or African American
- 211.6%Native Hawaiian / Pacific Islander
- 331.5%Other race
- 3079.5%Two or more races
- 2311.6%White alone, not Hispanic / Latino
- 1193.0%Hispanic or Latino

Children Nativity (place of birth) in Altamont
Place of birth for residents in Altamont
![Place of birth for the foreign-born population - Regions]()
- 839Americas
- 838Latin America
- 838Central America
- 123Europe
- 65Eastern Europe
- 39Western Europe
- 25Asia
- 25South Central Asia
- 18Northern Europe
- 1Northern America

![Place of birth for the foreign-born population - Countries]()
- 837Mexico
- 26Germany
- 25India
- 18United Kingdom
- 13Netherlands
- 12Hungary
- 12Latvia
- 1Panama
- 1Canada

Grandparents responsible for own grandchildren in Altamont
Zip codes: 97603.