Races in Amherst Center, Massachusetts (MA) Detailed Stats
Data:
Races - White alone (%)
Races - White alone (% change since 2000)
Races - Black alone (%)
Races - Black alone (% change since 2000)
Races - American Indian alone (%)
Races - American Indian alone (% change since 2000)
Races - Asian alone (%)
Races - Asian alone (% change since 2000)
Races - Hispanic (%)
Races - Hispanic (% change since 2000)
Races - Native Hawaiian and Other Pacific Islander alone (%)
Races - Native Hawaiian and Other Pacific Islander alone (% change since 2000)
Races - Two or more races(%)
Races - Two or more races(% change since 2000)
Races - Other race alone (%)
Races - Other race alone (% change since 2000)
Racial diversity
Place of birth - Born in state of residence (%)
Place of birth - Born in state of residence (%) - White
Place of birth - Born in state of residence (%) - Black or African American
Place of birth - Born in state of residence (%) - Asian
Place of birth - Born in state of residence (%) - Hispanic or Latino
Place of birth - Born in state of residence (%) - American Indian and Alaska Native
Place of birth - Born in state of residence (%) - Multirace
Place of birth - Born in state of residence (%) - Other Race
Place of birth - Born in other state (%)
Place of birth - Born in other state (%) - White
Place of birth - Born in other state (%) - Black or African American
Place of birth - Born in other state (%) - Asian
Place of birth - Born in other state (%) - Hispanic or Latino
Place of birth - Born in other state (%) - American Indian and Alaska Native
Place of birth - Born in other state (%) - Multirace
Place of birth - Born in other state (%) - Other Race
Place of birth - Native, outside of US (%)
Place of birth - Native, outside of US (%) - White
Place of birth - Native, outside of US (%) - Black or African American
Place of birth - Native, outside of US (%) - Asian
Place of birth - Native, outside of US (%) - Hispanic or Latino
Place of birth - Native, outside of US (%) - American Indian and Alaska Native
Place of birth - Native, outside of US (%) - Multirace
Place of birth - Native, outside of US (%) - Other Race
Place of birth - Foreign born (%)
Place of birth - Foreign born (%) - White
Place of birth - Foreign born (%) - Black or African American
Place of birth - Foreign born (%) - Asian
Place of birth - Foreign born (%) - Hispanic or Latino
Place of birth - Foreign born (%) - American Indian and Alaska Native
Place of birth - Foreign born (%) - Multirace
Place of birth - Foreign born (%) - Other Race
Residents speaking English at home (%)
Residents speaking English at home - Born in the United States (%)
Residents speaking English at home - Native, born elsewhere (%)
Residents speaking English at home - Foreign born (%)
Residents speaking Spanish at home (%)
Residents speaking Spanish at home - Born in the United States (%)
Residents speaking Spanish at home - Native, born elsewhere (%)
Residents speaking Spanish at home - Foreign born (%)
Residents speaking other language at home (%)
Residents speaking other language at home - Born in the United States (%)
Residents speaking other language at home - Native, born elsewhere (%)
Residents speaking other language at home - Foreign born (%)
Marital status - Never married (%)
Marital status - Now married (%)
Marital status - Separated (%)
Marital status - Widowed (%)
Marital status - Divorced (%)
Ancestries Reported - Arab (%)
Ancestries Reported - Czech (%)
Ancestries Reported - Danish (%)
Ancestries Reported - Dutch (%)
Ancestries Reported - English (%)
Ancestries Reported - French (%)
Ancestries Reported - French Canadian (%)
Ancestries Reported - German (%)
Ancestries Reported - Greek (%)
Ancestries Reported - Hungarian (%)
Ancestries Reported - Irish (%)
Ancestries Reported - Italian (%)
Ancestries Reported - Lithuanian (%)
Ancestries Reported - Norwegian (%)
Ancestries Reported - Polish (%)
Ancestries Reported - Portuguese (%)
Ancestries Reported - Russian (%)
Ancestries Reported - Scotch-Irish (%)
Ancestries Reported - Scottish (%)
Ancestries Reported - Slovak (%)
Ancestries Reported - Subsaharan African (%)
Ancestries Reported - Swedish (%)
Ancestries Reported - Swiss (%)
Ancestries Reported - Ukrainian (%)
Ancestries Reported - United States (%)
Ancestries Reported - Welsh (%)
Ancestries Reported - West Indian (%)
Ancestries Reported - Other (%)
Geographical mobility - Same house 1 year ago (%)
Geographical mobility - Same house 1 year ago (%) - White
Geographical mobility - Same house 1 year ago (%) - Black or African American
Geographical mobility - Same house 1 year ago (%) - Asian
Geographical mobility - Same house 1 year ago (%) - Hispanic or Latino
Geographical mobility - Same house 1 year ago (%) - American Indian and Alaska Native
Geographical mobility - Same house 1 year ago (%) - Multirace
Geographical mobility - Same house 1 year ago (%) - Other Race
Geographical mobility - Moved within same county (%)
Geographical mobility - Moved within same county (%) - White
Geographical mobility - Moved within same county (%) - Black or African American
Geographical mobility - Moved within same county (%) - Asian
Geographical mobility - Moved within same county (%) - Hispanic or Latino
Geographical mobility - Moved within same county (%) - American Indian and Alaska Native
Geographical mobility - Moved within same county (%) - Multirace
Geographical mobility - Moved within same county (%) - Other Race
Geographical mobility - Moved from different county within same state (%)
Geographical mobility - Moved from different county within same state (%) - White
Geographical mobility - Moved from different county within same state (%) - Black or African American
Geographical mobility - Moved from different county within same state (%) - Asian
Geographical mobility - Moved from different county within same state (%) - Hispanic or Latino
Geographical mobility - Moved from different county within same state (%) - American Indian and Alaska Native
Geographical mobility - Moved from different county within same state (%) - Multirace
Geographical mobility - Moved from different county within same state (%) - Other Race
Geographical mobility - Moved from different state (%)
Geographical mobility - Moved from different state (%) - White
Geographical mobility - Moved from different state (%) - Black or African American
Geographical mobility - Moved from different state (%) - Asian
Geographical mobility - Moved from different state (%) - Hispanic or Latino
Geographical mobility - Moved from different state (%) - American Indian and Alaska Native
Geographical mobility - Moved from different state (%) - Multirace
Geographical mobility - Moved from different state (%) - Other Race
Geographical mobility - Moved from abroad (%)
Geographical mobility - Moved from abroad (%) - White
Geographical mobility - Moved from abroad (%) - Black or African American
Geographical mobility - Moved from abroad (%) - Asian
Geographical mobility - Moved from abroad (%) - Hispanic or Latino
Geographical mobility - Moved from abroad (%) - American Indian and Alaska Native
Geographical mobility - Moved from abroad (%) - Multirace
Geographical mobility - Moved from abroad (%) - Other Race
Place of birth for the foreign-born population - Ireland (%)
Place of birth for the foreign-born population - Denmark (%)
Place of birth for the foreign-born population - Norway (%)
Place of birth for the foreign-born population - Sweden (%)
Place of birth for the foreign-born population - United Kingdom (%)
Place of birth for the foreign-born population - England (%)
Place of birth for the foreign-born population - Scotland (%)
Place of birth for the foreign-born population - Other Northern Europe (%)
Place of birth for the foreign-born population - Austria (%)
Place of birth for the foreign-born population - Belgium (%)
Place of birth for the foreign-born population - France (%)
Place of birth for the foreign-born population - Germany (%)
Place of birth for the foreign-born population - Netherlands (%)
Place of birth for the foreign-born population - Switzerland (%)
Place of birth for the foreign-born population - Other Western Europe (%)
Place of birth for the foreign-born population - Greece (%)
Place of birth for the foreign-born population - Italy (%)
Place of birth for the foreign-born population - Portugal (%)
Place of birth for the foreign-born population - Spain (%)
Place of birth for the foreign-born population - Other Southern Europe (%)
Place of birth for the foreign-born population - Albania (%)
Place of birth for the foreign-born population - Belarus (%)
Place of birth for the foreign-born population - Bosnia and Herzegovina (%)
Place of birth for the foreign-born population - Bulgaria (%)
Place of birth for the foreign-born population - Croatia (%)
Place of birth for the foreign-born population - Czechoslovakia (%)
Place of birth for the foreign-born population - Hungary (%)
Place of birth for the foreign-born population - Latvia (%)
Place of birth for the foreign-born population - Lithuania (%)
Place of birth for the foreign-born population - North Macedonia (Macedonia) (%)
Place of birth for the foreign-born population - Moldova (%)
Place of birth for the foreign-born population - Poland (%)
Place of birth for the foreign-born population - Romania (%)
Place of birth for the foreign-born population - Russia (%)
Place of birth for the foreign-born population - Serbia (%)
Place of birth for the foreign-born population - Ukraine (%)
Place of birth for the foreign-born population - Other Eastern Europe (%)
Place of birth for the foreign-born population - China (%)
Place of birth for the foreign-born population - Hong Kong (%)
Place of birth for the foreign-born population - Taiwan (%)
Place of birth for the foreign-born population - Japan (%)
Place of birth for the foreign-born population - Korea (%)
Place of birth for the foreign-born population - Other Eastern Asia (%)
Place of birth for the foreign-born population - Afghanistan (%)
Place of birth for the foreign-born population - Bangladesh (%)
Place of birth for the foreign-born population - India (%)
Place of birth for the foreign-born population - Iran (%)
Place of birth for the foreign-born population - Kazakhstan (%)
Place of birth for the foreign-born population - Nepal (%)
Place of birth for the foreign-born population - Pakistan (%)
Place of birth for the foreign-born population - Sri Lanka (%)
Place of birth for the foreign-born population - Uzbekistan (%)
Place of birth for the foreign-born population - Other South Central Asia (%)
Place of birth for the foreign-born population - Burma (%)
Place of birth for the foreign-born population - Cambodia (%)
Place of birth for the foreign-born population - Indonesia (%)
Place of birth for the foreign-born population - Laos (%)
Place of birth for the foreign-born population - Malaysia (%)
Place of birth for the foreign-born population - Philippines (%)
Place of birth for the foreign-born population - Singapore (%)
Place of birth for the foreign-born population - Thailand (%)
Place of birth for the foreign-born population - Vietnam (%)
Place of birth for the foreign-born population - Other South Eastern Asia (%)
Place of birth for the foreign-born population - Armenia (%)
Place of birth for the foreign-born population - Iraq (%)
Place of birth for the foreign-born population - Israel (%)
Place of birth for the foreign-born population - Jordan (%)
Place of birth for the foreign-born population - Kuwait (%)
Place of birth for the foreign-born population - Lebanon (%)
Place of birth for the foreign-born population - Saudi Arabia (%)
Place of birth for the foreign-born population - Syria (%)
Place of birth for the foreign-born population - Turkey (%)
Place of birth for the foreign-born population - Yemen (%)
Place of birth for the foreign-born population - Other Western Asia (%)
Place of birth for the foreign-born population - Eritrea (%)
Place of birth for the foreign-born population - Ethiopia (%)
Place of birth for the foreign-born population - Kenya (%)
Place of birth for the foreign-born population - Somalia (%)
Place of birth for the foreign-born population - Uganda (%)
Place of birth for the foreign-born population - Zimbabwe (%)
Place of birth for the foreign-born population - Other Eastern Africa (%)
Place of birth for the foreign-born population - Cameroon (%)
Place of birth for the foreign-born population - Congo (%)
Place of birth for the foreign-born population - Democratic Republic of Congo (Zaire) (%)
Place of birth for the foreign-born population - Other Middle Africa (%)
Place of birth for the foreign-born population - Egypt (%)
Place of birth for the foreign-born population - Morocco (%)
Place of birth for the foreign-born population - Sudan (%)
Place of birth for the foreign-born population - Other Northern Africa (%)
Place of birth for the foreign-born population - South Africa (%)
Place of birth for the foreign-born population - Other Southern Africa (%)
Place of birth for the foreign-born population - Cabo Verde (%)
Place of birth for the foreign-born population - Ghana (%)
Place of birth for the foreign-born population - Liberia (%)
Place of birth for the foreign-born population - Nigeria (%)
Place of birth for the foreign-born population - Senegal (%)
Place of birth for the foreign-born population - Sierra Leone (%)
Place of birth for the foreign-born population - Other Western Africa (%)
Place of birth for the foreign-born population - Australia (%)
Place of birth for the foreign-born population - New Zealand (%)
Place of birth for the foreign-born population - Fiji (%)
Place of birth for the foreign-born population - Micronesia (%)
Place of birth for the foreign-born population - Bahamas (%)
Place of birth for the foreign-born population - Barbados (%)
Place of birth for the foreign-born population - Cuba (%)
Place of birth for the foreign-born population - Dominica (%)
Place of birth for the foreign-born population - Dominican Republic (%)
Place of birth for the foreign-born population - Grenada (%)
Place of birth for the foreign-born population - Haiti (%)
Place of birth for the foreign-born population - Jamaica (%)
Place of birth for the foreign-born population - St. Vincent and the Grenadines (%)
Place of birth for the foreign-born population - Trinidad and Tobago (%)
Place of birth for the foreign-born population - West Indies (%)
Place of birth for the foreign-born population - Other Caribbean (%)
Place of birth for the foreign-born population - Belize (%)
Place of birth for the foreign-born population - Costa Rica (%)
Place of birth for the foreign-born population - El Salvador (%)
Place of birth for the foreign-born population - Guatemala (%)
Place of birth for the foreign-born population - Honduras (%)
Place of birth for the foreign-born population - Mexico (%)
Place of birth for the foreign-born population - Nicaragua (%)
Place of birth for the foreign-born population - Panama (%)
Place of birth for the foreign-born population - Other Central America (%)
Place of birth for the foreign-born population - Argentina (%)
Place of birth for the foreign-born population - Bolivia (%)
Place of birth for the foreign-born population - Brazil (%)
Place of birth for the foreign-born population - Chile (%)
Place of birth for the foreign-born population - Colombia (%)
Place of birth for the foreign-born population - Ecuador (%)
Place of birth for the foreign-born population - Guyana (%)
Place of birth for the foreign-born population - Peru (%)
Place of birth for the foreign-born population - Uruguay (%)
Place of birth for the foreign-born population - Venezuela (%)
Place of birth for the foreign-born population - Other South America (%)
Place of birth for the foreign-born population - Canada (%)
Place of birth for the foreign-born population - Other Northern America (%)
Place of birth for the foreign-born population - Other (%)
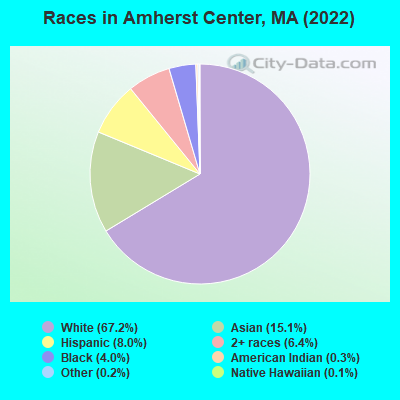
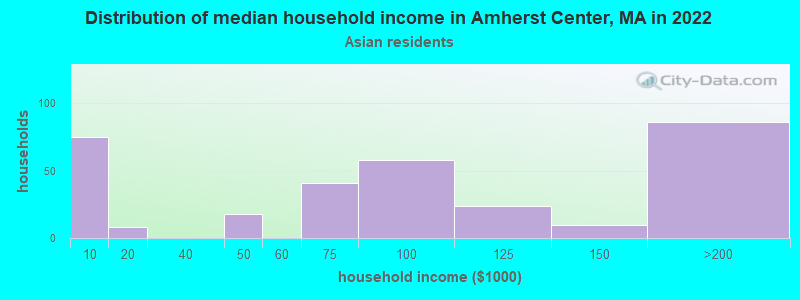
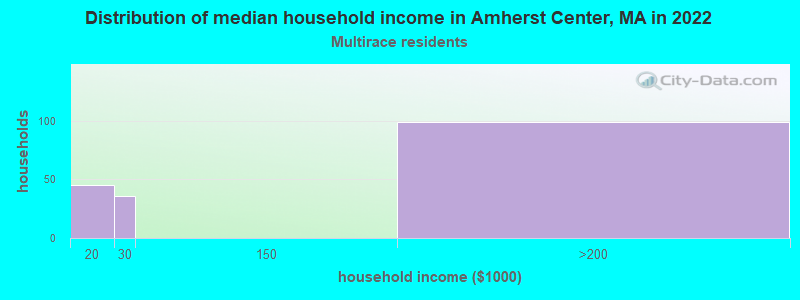
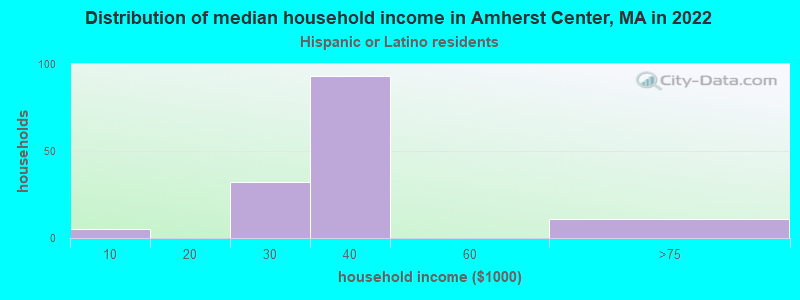
According to 2022 data, the most numerous races in Amherst Center, MA are White alone (14,069 residents), Hispanic (1,676 residents), and Asian alone (3,161 residents). 77.4% of Amherst Center residents speak English at home. 14.8% of Amherst Center, MA residents are foreign-born (7.7% born in Asia, 2.1% born in Latin America, 2.1% born in Africa, 1.7% born in Europe), which is 21.6% less than the foreign-born rate of 18.0% across the entire state of Massachusetts.
Race distribution in Amherst Center
2000 2022
5,198,359 81.9% White alone 428,729 6.8% Hispanic 318,329 5.0% Black alone 236,786 3.7% Asian alone 110,338 1.7% Two or more races 43,586 0.7% Other race alone 11,264 0.2% American Indian alone 1,706 0.03% Native Hawaiian and Other
4,676,627 67.0% White alone 911,038 13.0% Hispanic 501,463 7.2% Asian alone 459,740 6.6% Black alone 341,889 4.9% Two or more races 84,403 1.2% Other race alone 5,838 0.08% American Indian alone 976 0.01% Native Hawaiian and Other
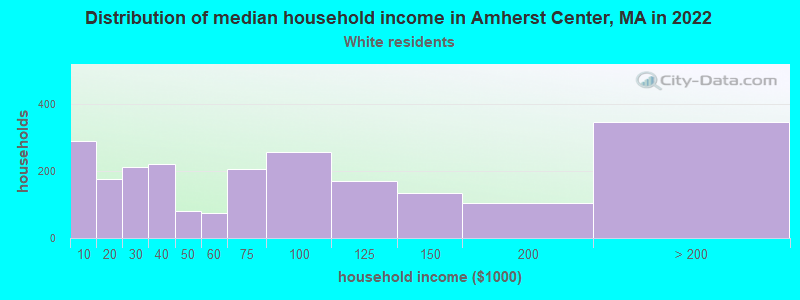
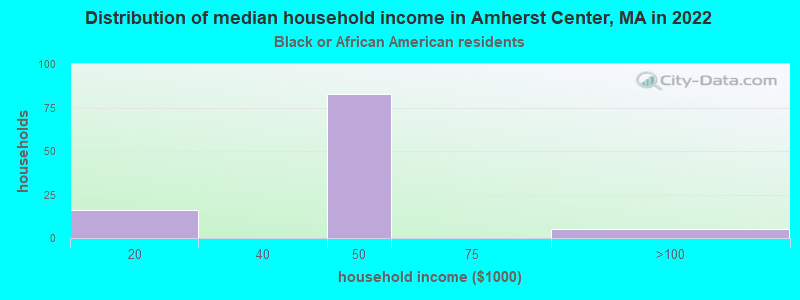
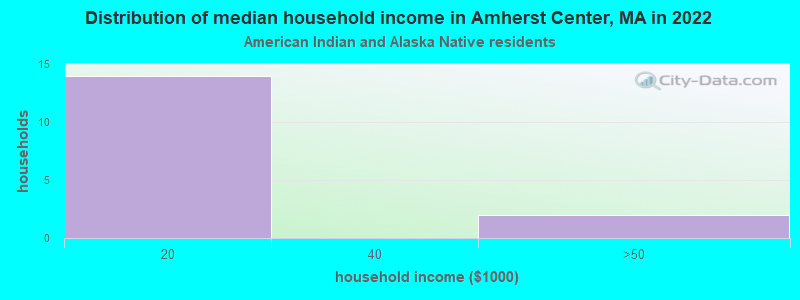
Income and house value in Amherst Center Median household income in 2022 $52,751 White non-Hispanic householders$118,080 Black householders$19,888 American Indian and Alaska Native householders$62,252 Asian householders$19,344 Some other race householders$62,206 Two or more races householders$47,092 Hispanic or Latino race householdersMedian 2022 house value $457,142 White Non-Hispanic householders$392,430 Black or African American householders $354,486 Asian householders$364,882 Two or more races householders
Median age by race in Amherst Center
21.2 Median age for White residents21.2 21.4 26.2 Median age for Black or African American residents24.2 20.1 58.3 Median age for American Indian / Alaska Native residents55.7 24.3 20.4 Median age for Asian residents19.0 21.0 26.5 Median age for Other race residents16.8 31.5 27.4 Median age for Two or more races residents23.6 35.0 20.9 Median age for White alone residents20.6 21.2 20.4 Median age for Hispanic or Latino residents21.9 19.7
Owner/renter occupied households by race in Amherst Center
House owners and renters - White residents 1,029 42.7% Owner occupied1,379 57.3% Renter occupiedHouse owners and renters - Black or African American residents 133 100.0% Renter occupiedHouse owners and renters - American Indian / Alaska Native residents 56 100.0% Renter occupiedHouse owners and renters - Asian residents 134 43.8% Owner occupied172 56.2% Renter occupiedHouse owners and renters - Other race residents 29 100.0% Renter occupiedHouse owners and renters - Two or more races residents 111 61.2% Owner occupied71 38.8% Renter occupiedHouse owners and renters - White alone residents 1,029 42.8% Owner occupied1,376 57.2% Renter occupiedHouse owners and renters - Hispanic or Latino residents 15 7.4% Owner occupied184 92.6% Renter occupied
Language usage in Amherst Center
English speakers - Total 77.4% of residents of Amherst Center speak English at home.
4.5% of residents speak Spanish at home 852 91.6% Speak English very well78 8.4% Speak English less than very well17.9% of residents speak other language at home 2,965 79.9% Speak English very well748 20.1% Speak English less than very well
English speakers - Born in the United States 89.6% of residents of Amherst Center speak English at home.
3.1% of residents speak Spanish at home 203 100.0% Speak English very well7.3% of residents speak other language at home 458 96.0% Speak English very well19 4.0% Speak English less than very well
English speakers - Native, born elsewhere 67.7% of residents of Amherst Center speak English at home.
27.1% of residents speak Spanish at home 104 93.7% Speak English very well7 6.3% Speak English less than very well5.4% of residents speak other language at home 22 100.0% Speak English very well
English speakers - Foreign-born 17.1% of residents of Amherst Center speak English at home.
6.9% of residents speak Spanish at home 161 72.9% Speak English very well60 27.1% Speak English less than very well76.0% of residents speak other language at home 1,745 71.9% Speak English very well682 28.1% Speak English less than very well
White (Caucasian) - Speak only English Native:
96.3% (13,434)Foreign-born:
36.9% (295)
White (Caucasian) - Speak another language Native:
4.2% (589)Foreign-born:
63.2% (504)
Black or African American - Speak only English Native:
71.4% (321)Foreign-born:
2.2% (9)
Black or African American - Speak another language Native:
27.3% (123)Foreign-born:
93.4% (389)
American Indian / Alaska Native - Speak only English Native:
82.2% (69)Foreign-born:
83.5% (19)
Asian - Speak only English Native:
28.5% (463)Foreign-born:
19.4% (332)
Asian - Speak another language Native:
71.3% (1,159)Foreign-born:
79.6% (1,363)
Other race - Speak only English Native:
45.7% (63)Foreign-born:
13.1% (9)
Other race - Speak another language Native:
55.9% (77)Foreign-born:
86.2% (60)
Two or more races - Speak only English Native:
65.2% (1,202)Foreign-born:
14.8% (48)
Two or more races - Speak another language Native:
34.2% (630)Foreign-born:
82.7% (271)
White alone - Speak only English Native:
97.8% (13,125)Foreign-born:
39.0% (294)
White alone - Speak another language Native:
2.3% (313)Foreign-born:
58.5% (441)
Hispanic or Latino - Speak only English Native:
47.3% (636)Foreign-born:
23.4% (63)
Hispanic or Latino - Speak another language Native:
53.1% (713)Foreign-born:
78.8% (212)
Foreign-born residents in Amherst Center 3,075 residents are foreign born (7.7% Asia , 2.1% Latin America , 2.1% Africa , 1.7% Europe ).
This city:
14.8%Massachusetts:
100.0%
Marital status for residents in Amherst Center Marital status - White (Caucasian) population 15 years and over
Males 86.7% Never married10.6% Now married0.1% Separated0.7% Widowed1.8% DivorcedFemales 83.9% Never married9.0% Now married0.8% Separated2.1% Widowed4.3% DivorcedWomen who gave birth in the past 12 months Now married:
61.1% (30)Unmarried:
38.9% (19)
Women who did not give birth in the past 12 months Now married:
3.0% (182)Unmarried:
97.0% (5,923)
Marital status - Black or African American population 15 years and over
Males 86.8% Never married0.0% Now married6.4% Separated6.8% Widowed0.0% DivorcedFemales 92.1% Never married0.0% Now married0.0% Separated0.0% Widowed7.9% DivorcedWomen who did not give birth in the past 12 months Now married:
0.0% (0)Unmarried:
100.0% (529)
Marital status - American Indian / Alaska Native population 15 years and over
Males 54.4% Never married0.0% Now married0.0% Separated22.8% Widowed22.8% DivorcedFemales 60.0% Never married40.0% Now married0.0% Separated0.0% Widowed0.0% DivorcedWomen who did not give birth in the past 12 months Now married:
0.0% (0)Unmarried:
100.0% (22)
Marital status - Asian population 15 years and over
Males 95.0% Never married5.0% Now married0.0% Separated0.0% Widowed0.0% DivorcedFemales 85.3% Never married8.9% Now married0.0% Separated5.7% Widowed0.0% DivorcedWomen who gave birth in the past 12 months Now married:
100.0% (16)Unmarried:
0.0% (0)
Women who did not give birth in the past 12 months Now married:
4.7% (64)Unmarried:
95.3% (1,297)
Marital status - Native Hawaiian / Pacific Islander population 15 years and over
Males 100.0% Never married0.0% Now married0.0% Separated0.0% Widowed0.0% DivorcedFemales 0.0% Never married100.0% Now married0.0% Separated0.0% Widowed0.0% DivorcedMarital status - Other race population 15 years and over
Males 83.5% Never married16.5% Now married0.0% Separated0.0% Widowed0.0% DivorcedFemales 100.0% Never married0.0% Now married0.0% Separated0.0% Widowed0.0% DivorcedWomen who did not give birth in the past 12 months Now married:
0.0% (0)Unmarried:
100.0% (93)
Marital status - Two or more races population 15 years and over
Males 96.2% Never married3.7% Now married0.0% Separated0.0% Widowed0.0% DivorcedFemales 91.0% Never married5.8% Now married0.0% Separated0.0% Widowed3.3% DivorcedWomen who did not give birth in the past 12 months Now married:
3.5% (40)Unmarried:
96.5% (1,109)
Marital status - White alone, not Hispanic / Latino population 15 years and over
Males 86.5% Never married10.7% Now married0.1% Separated0.8% Widowed1.9% DivorcedFemales 83.3% Never married9.0% Now married0.8% Separated2.2% Widowed4.6% DivorcedWomen who gave birth in the past 12 months Now married:
0.0% (0)Unmarried:
100.0% (20)
Women who did not give birth in the past 12 months Now married:
3.1% (184)Unmarried:
96.9% (5,672)
Marital status - Hispanic or Latino population 15 years and over
Males 93.7% Never married6.3% Now married0.0% Separated0.0% Widowed0.0% DivorcedFemales 92.3% Never married6.3% Now married0.0% Separated1.3% Widowed0.0% DivorcedWomen who gave birth in the past 12 months Now married:
100.0% (37)Unmarried:
0.0% (0)
Women who did not give birth in the past 12 months Now married:
0.9% (7)Unmarried:
99.1% (760)
Ancestries in Amherst Center
563 8.8% Irish560 8.7% Italian485 7.6% English238 3.7% Polish233 3.6% Cape Verdean147 2.3% German144 2.2% European127 2.0% Eastern European121 1.9% American98 1.5% Albanian79 1.2% Portuguese70 1.1% French Canadian57 0.9% Haitian55 0.9% Ukrainian50 0.8% Brazilian45 0.7% Kenyan40 0.6% French40 0.6% Greek38 0.6% Turkish37 0.6% Jamaican33 0.5% African31 0.5% Lithuanian30 0.5% Scottish29 0.5% Nigerian28 0.4% Syrian27 0.4% Dutch26 0.4% Swedish21 0.3% Ghanaian20 0.3% Lebanese16 0.2% Russian15 0.2% Norwegian14 0.2% New Zealander14 0.2% Australian13 0.2% British12 0.2% Swiss8 0.1% Hungarian7 0.1% Senegalese6 0.09% Scandinavian5 0.08% Ethiopian4 0.06% Scotch-Irish4 0.06% Canadian2 0.03% Finnish1 0.02% Armenian
Geographical mobility in Amherst Center Same house 1 year ago 5,070 34.5% White (Caucasian)378 42.3% Black or African American24 25.1% American Indian / Alaska Native748 23.1% Asian22 100.0% Native Hawaiian / Pacific Islander76 36.2% Other race859 43.5% Two or more races5,048 35.4% White alone, not Hispanic / Latino409 25.8% Hispanic or LatinoMoved within same county 3,969 27.0% White / Caucasian150 16.8% Black or African American12 12.9% American Indian / Alaska Native993 30.7% Asian57 27.2% Other race345 17.5% Two or more races3,887 27.3% White alone, not Hispanic / Latino522 32.9% Hispanic or LatinoMoved within same state 3,952 26.9% White / Caucasian177 19.7% Black or African American69 71.8% American Indian / Alaska Native758 23.4% Asian34 16.3% Other race586 29.7% Two or more races3,447 24.2% White alone, not Hispanic / Latino386 24.3% Hispanic or LatinoMoved from different state 1,730 11.8% White / Caucasian169 18.9% Black or African American18 18.7% American Indian / Alaska Native373 11.5% Asian15 7.0% Other race26 1.3% Two or more races1,516 10.6% White alone, not Hispanic / Latino123 7.8% Hispanic or LatinoMoved from abroad 224 1.5% White20 2.2% Black or African American3 2.9% American Indian / Alaska Native458 14.2% Asian14 6.9% Other race61 3.1% Two or more races242 1.7% White alone, not Hispanic / Latino50 3.1% Hispanic or Latino
Children Nativity (place of birth) in Amherst Center
Children under 6 years - Living with two parents Both parents native 10 100.0% NativeBoth parents foreign-born 16 100.0% NativeOne native, one foreign-born parent 56 100.0% NativeChildren under 6 years - Living with one parent Native parent 83 100.0% NativeForeign-born parent 29 100.0% Native
Children 6 to 17 years - Living with two parents Both parents native 200 100.0% NativeBoth parents foreign-born 25 100.0% NativeOne native, one foreign-born parent 68 100.0% NativeChildren 6 to 17 years - Living with one parent Native parent 228 100.0% Native