Races in Arlington, Massachusetts (MA) Detailed Stats
Data:
Races - White alone (%)
Races - White alone (% change since 2000)
Races - Black alone (%)
Races - Black alone (% change since 2000)
Races - American Indian alone (%)
Races - American Indian alone (% change since 2000)
Races - Asian alone (%)
Races - Asian alone (% change since 2000)
Races - Hispanic (%)
Races - Hispanic (% change since 2000)
Races - Native Hawaiian and Other Pacific Islander alone (%)
Races - Native Hawaiian and Other Pacific Islander alone (% change since 2000)
Races - Two or more races(%)
Races - Two or more races(% change since 2000)
Races - Other race alone (%)
Races - Other race alone (% change since 2000)
Racial diversity
Place of birth - Born in state of residence (%)
Place of birth - Born in state of residence (%) - White
Place of birth - Born in state of residence (%) - Black or African American
Place of birth - Born in state of residence (%) - Asian
Place of birth - Born in state of residence (%) - Hispanic or Latino
Place of birth - Born in state of residence (%) - American Indian and Alaska Native
Place of birth - Born in state of residence (%) - Multirace
Place of birth - Born in state of residence (%) - Other Race
Place of birth - Born in other state (%)
Place of birth - Born in other state (%) - White
Place of birth - Born in other state (%) - Black or African American
Place of birth - Born in other state (%) - Asian
Place of birth - Born in other state (%) - Hispanic or Latino
Place of birth - Born in other state (%) - American Indian and Alaska Native
Place of birth - Born in other state (%) - Multirace
Place of birth - Born in other state (%) - Other Race
Place of birth - Native, outside of US (%)
Place of birth - Native, outside of US (%) - White
Place of birth - Native, outside of US (%) - Black or African American
Place of birth - Native, outside of US (%) - Asian
Place of birth - Native, outside of US (%) - Hispanic or Latino
Place of birth - Native, outside of US (%) - American Indian and Alaska Native
Place of birth - Native, outside of US (%) - Multirace
Place of birth - Native, outside of US (%) - Other Race
Place of birth - Foreign born (%)
Place of birth - Foreign born (%) - White
Place of birth - Foreign born (%) - Black or African American
Place of birth - Foreign born (%) - Asian
Place of birth - Foreign born (%) - Hispanic or Latino
Place of birth - Foreign born (%) - American Indian and Alaska Native
Place of birth - Foreign born (%) - Multirace
Place of birth - Foreign born (%) - Other Race
Residents speaking English at home (%)
Residents speaking English at home - Born in the United States (%)
Residents speaking English at home - Native, born elsewhere (%)
Residents speaking English at home - Foreign born (%)
Residents speaking Spanish at home (%)
Residents speaking Spanish at home - Born in the United States (%)
Residents speaking Spanish at home - Native, born elsewhere (%)
Residents speaking Spanish at home - Foreign born (%)
Residents speaking other language at home (%)
Residents speaking other language at home - Born in the United States (%)
Residents speaking other language at home - Native, born elsewhere (%)
Residents speaking other language at home - Foreign born (%)
Marital status - Never married (%)
Marital status - Now married (%)
Marital status - Separated (%)
Marital status - Widowed (%)
Marital status - Divorced (%)
Ancestries Reported - Arab (%)
Ancestries Reported - Czech (%)
Ancestries Reported - Danish (%)
Ancestries Reported - Dutch (%)
Ancestries Reported - English (%)
Ancestries Reported - French (%)
Ancestries Reported - French Canadian (%)
Ancestries Reported - German (%)
Ancestries Reported - Greek (%)
Ancestries Reported - Hungarian (%)
Ancestries Reported - Irish (%)
Ancestries Reported - Italian (%)
Ancestries Reported - Lithuanian (%)
Ancestries Reported - Norwegian (%)
Ancestries Reported - Polish (%)
Ancestries Reported - Portuguese (%)
Ancestries Reported - Russian (%)
Ancestries Reported - Scotch-Irish (%)
Ancestries Reported - Scottish (%)
Ancestries Reported - Slovak (%)
Ancestries Reported - Subsaharan African (%)
Ancestries Reported - Swedish (%)
Ancestries Reported - Swiss (%)
Ancestries Reported - Ukrainian (%)
Ancestries Reported - United States (%)
Ancestries Reported - Welsh (%)
Ancestries Reported - West Indian (%)
Ancestries Reported - Other (%)
Geographical mobility - Same house 1 year ago (%)
Geographical mobility - Same house 1 year ago (%) - White
Geographical mobility - Same house 1 year ago (%) - Black or African American
Geographical mobility - Same house 1 year ago (%) - Asian
Geographical mobility - Same house 1 year ago (%) - Hispanic or Latino
Geographical mobility - Same house 1 year ago (%) - American Indian and Alaska Native
Geographical mobility - Same house 1 year ago (%) - Multirace
Geographical mobility - Same house 1 year ago (%) - Other Race
Geographical mobility - Moved within same county (%)
Geographical mobility - Moved within same county (%) - White
Geographical mobility - Moved within same county (%) - Black or African American
Geographical mobility - Moved within same county (%) - Asian
Geographical mobility - Moved within same county (%) - Hispanic or Latino
Geographical mobility - Moved within same county (%) - American Indian and Alaska Native
Geographical mobility - Moved within same county (%) - Multirace
Geographical mobility - Moved within same county (%) - Other Race
Geographical mobility - Moved from different county within same state (%)
Geographical mobility - Moved from different county within same state (%) - White
Geographical mobility - Moved from different county within same state (%) - Black or African American
Geographical mobility - Moved from different county within same state (%) - Asian
Geographical mobility - Moved from different county within same state (%) - Hispanic or Latino
Geographical mobility - Moved from different county within same state (%) - American Indian and Alaska Native
Geographical mobility - Moved from different county within same state (%) - Multirace
Geographical mobility - Moved from different county within same state (%) - Other Race
Geographical mobility - Moved from different state (%)
Geographical mobility - Moved from different state (%) - White
Geographical mobility - Moved from different state (%) - Black or African American
Geographical mobility - Moved from different state (%) - Asian
Geographical mobility - Moved from different state (%) - Hispanic or Latino
Geographical mobility - Moved from different state (%) - American Indian and Alaska Native
Geographical mobility - Moved from different state (%) - Multirace
Geographical mobility - Moved from different state (%) - Other Race
Geographical mobility - Moved from abroad (%)
Geographical mobility - Moved from abroad (%) - White
Geographical mobility - Moved from abroad (%) - Black or African American
Geographical mobility - Moved from abroad (%) - Asian
Geographical mobility - Moved from abroad (%) - Hispanic or Latino
Geographical mobility - Moved from abroad (%) - American Indian and Alaska Native
Geographical mobility - Moved from abroad (%) - Multirace
Geographical mobility - Moved from abroad (%) - Other Race
Place of birth for the foreign-born population - Ireland (%)
Place of birth for the foreign-born population - Denmark (%)
Place of birth for the foreign-born population - Norway (%)
Place of birth for the foreign-born population - Sweden (%)
Place of birth for the foreign-born population - United Kingdom (%)
Place of birth for the foreign-born population - England (%)
Place of birth for the foreign-born population - Scotland (%)
Place of birth for the foreign-born population - Other Northern Europe (%)
Place of birth for the foreign-born population - Austria (%)
Place of birth for the foreign-born population - Belgium (%)
Place of birth for the foreign-born population - France (%)
Place of birth for the foreign-born population - Germany (%)
Place of birth for the foreign-born population - Netherlands (%)
Place of birth for the foreign-born population - Switzerland (%)
Place of birth for the foreign-born population - Other Western Europe (%)
Place of birth for the foreign-born population - Greece (%)
Place of birth for the foreign-born population - Italy (%)
Place of birth for the foreign-born population - Portugal (%)
Place of birth for the foreign-born population - Spain (%)
Place of birth for the foreign-born population - Other Southern Europe (%)
Place of birth for the foreign-born population - Albania (%)
Place of birth for the foreign-born population - Belarus (%)
Place of birth for the foreign-born population - Bosnia and Herzegovina (%)
Place of birth for the foreign-born population - Bulgaria (%)
Place of birth for the foreign-born population - Croatia (%)
Place of birth for the foreign-born population - Czechoslovakia (%)
Place of birth for the foreign-born population - Hungary (%)
Place of birth for the foreign-born population - Latvia (%)
Place of birth for the foreign-born population - Lithuania (%)
Place of birth for the foreign-born population - North Macedonia (Macedonia) (%)
Place of birth for the foreign-born population - Moldova (%)
Place of birth for the foreign-born population - Poland (%)
Place of birth for the foreign-born population - Romania (%)
Place of birth for the foreign-born population - Russia (%)
Place of birth for the foreign-born population - Serbia (%)
Place of birth for the foreign-born population - Ukraine (%)
Place of birth for the foreign-born population - Other Eastern Europe (%)
Place of birth for the foreign-born population - China (%)
Place of birth for the foreign-born population - Hong Kong (%)
Place of birth for the foreign-born population - Taiwan (%)
Place of birth for the foreign-born population - Japan (%)
Place of birth for the foreign-born population - Korea (%)
Place of birth for the foreign-born population - Other Eastern Asia (%)
Place of birth for the foreign-born population - Afghanistan (%)
Place of birth for the foreign-born population - Bangladesh (%)
Place of birth for the foreign-born population - India (%)
Place of birth for the foreign-born population - Iran (%)
Place of birth for the foreign-born population - Kazakhstan (%)
Place of birth for the foreign-born population - Nepal (%)
Place of birth for the foreign-born population - Pakistan (%)
Place of birth for the foreign-born population - Sri Lanka (%)
Place of birth for the foreign-born population - Uzbekistan (%)
Place of birth for the foreign-born population - Other South Central Asia (%)
Place of birth for the foreign-born population - Burma (%)
Place of birth for the foreign-born population - Cambodia (%)
Place of birth for the foreign-born population - Indonesia (%)
Place of birth for the foreign-born population - Laos (%)
Place of birth for the foreign-born population - Malaysia (%)
Place of birth for the foreign-born population - Philippines (%)
Place of birth for the foreign-born population - Singapore (%)
Place of birth for the foreign-born population - Thailand (%)
Place of birth for the foreign-born population - Vietnam (%)
Place of birth for the foreign-born population - Other South Eastern Asia (%)
Place of birth for the foreign-born population - Armenia (%)
Place of birth for the foreign-born population - Iraq (%)
Place of birth for the foreign-born population - Israel (%)
Place of birth for the foreign-born population - Jordan (%)
Place of birth for the foreign-born population - Kuwait (%)
Place of birth for the foreign-born population - Lebanon (%)
Place of birth for the foreign-born population - Saudi Arabia (%)
Place of birth for the foreign-born population - Syria (%)
Place of birth for the foreign-born population - Turkey (%)
Place of birth for the foreign-born population - Yemen (%)
Place of birth for the foreign-born population - Other Western Asia (%)
Place of birth for the foreign-born population - Eritrea (%)
Place of birth for the foreign-born population - Ethiopia (%)
Place of birth for the foreign-born population - Kenya (%)
Place of birth for the foreign-born population - Somalia (%)
Place of birth for the foreign-born population - Uganda (%)
Place of birth for the foreign-born population - Zimbabwe (%)
Place of birth for the foreign-born population - Other Eastern Africa (%)
Place of birth for the foreign-born population - Cameroon (%)
Place of birth for the foreign-born population - Congo (%)
Place of birth for the foreign-born population - Democratic Republic of Congo (Zaire) (%)
Place of birth for the foreign-born population - Other Middle Africa (%)
Place of birth for the foreign-born population - Egypt (%)
Place of birth for the foreign-born population - Morocco (%)
Place of birth for the foreign-born population - Sudan (%)
Place of birth for the foreign-born population - Other Northern Africa (%)
Place of birth for the foreign-born population - South Africa (%)
Place of birth for the foreign-born population - Other Southern Africa (%)
Place of birth for the foreign-born population - Cabo Verde (%)
Place of birth for the foreign-born population - Ghana (%)
Place of birth for the foreign-born population - Liberia (%)
Place of birth for the foreign-born population - Nigeria (%)
Place of birth for the foreign-born population - Senegal (%)
Place of birth for the foreign-born population - Sierra Leone (%)
Place of birth for the foreign-born population - Other Western Africa (%)
Place of birth for the foreign-born population - Australia (%)
Place of birth for the foreign-born population - New Zealand (%)
Place of birth for the foreign-born population - Fiji (%)
Place of birth for the foreign-born population - Micronesia (%)
Place of birth for the foreign-born population - Bahamas (%)
Place of birth for the foreign-born population - Barbados (%)
Place of birth for the foreign-born population - Cuba (%)
Place of birth for the foreign-born population - Dominica (%)
Place of birth for the foreign-born population - Dominican Republic (%)
Place of birth for the foreign-born population - Grenada (%)
Place of birth for the foreign-born population - Haiti (%)
Place of birth for the foreign-born population - Jamaica (%)
Place of birth for the foreign-born population - St. Vincent and the Grenadines (%)
Place of birth for the foreign-born population - Trinidad and Tobago (%)
Place of birth for the foreign-born population - West Indies (%)
Place of birth for the foreign-born population - Other Caribbean (%)
Place of birth for the foreign-born population - Belize (%)
Place of birth for the foreign-born population - Costa Rica (%)
Place of birth for the foreign-born population - El Salvador (%)
Place of birth for the foreign-born population - Guatemala (%)
Place of birth for the foreign-born population - Honduras (%)
Place of birth for the foreign-born population - Mexico (%)
Place of birth for the foreign-born population - Nicaragua (%)
Place of birth for the foreign-born population - Panama (%)
Place of birth for the foreign-born population - Other Central America (%)
Place of birth for the foreign-born population - Argentina (%)
Place of birth for the foreign-born population - Bolivia (%)
Place of birth for the foreign-born population - Brazil (%)
Place of birth for the foreign-born population - Chile (%)
Place of birth for the foreign-born population - Colombia (%)
Place of birth for the foreign-born population - Ecuador (%)
Place of birth for the foreign-born population - Guyana (%)
Place of birth for the foreign-born population - Peru (%)
Place of birth for the foreign-born population - Uruguay (%)
Place of birth for the foreign-born population - Venezuela (%)
Place of birth for the foreign-born population - Other South America (%)
Place of birth for the foreign-born population - Canada (%)
Place of birth for the foreign-born population - Other Northern America (%)
Place of birth for the foreign-born population - Other (%)
Latest news about races in Arlington, MA collected exclusively by city-data.com from local newspapers, TV, and radio stations
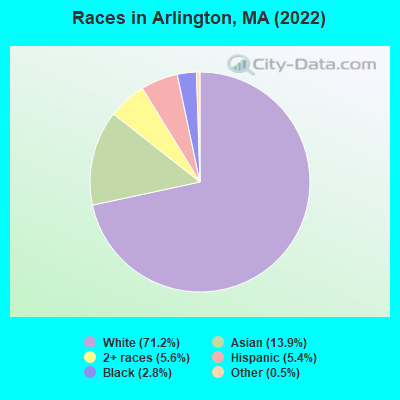
According to 2022 data, the most numerous races in Arlington, MA are White alone (32,565 residents), Hispanic (2,460 residents), and Asian alone (6,349 residents). 76.5% of Arlington residents speak English at home. 19.2% of Arlington, MA residents are foreign-born (10.3% born in Asia, 4.7% born in Europe, 2.0% born in Latin America), which is 6.2% greater than the foreign-born rate of 18.0% across the entire state of Massachusetts.
Race distribution in Arlington
2000 2022
5,198,359 81.9% White alone 428,729 6.8% Hispanic 318,329 5.0% Black alone 236,786 3.7% Asian alone 110,338 1.7% Two or more races 43,586 0.7% Other race alone 11,264 0.2% American Indian alone 1,706 0.03% Native Hawaiian and Other
4,676,627 67.0% White alone 911,038 13.0% Hispanic 501,463 7.2% Asian alone 459,740 6.6% Black alone 341,889 4.9% Two or more races 84,403 1.2% Other race alone 5,838 0.08% American Indian alone 976 0.01% Native Hawaiian and Other
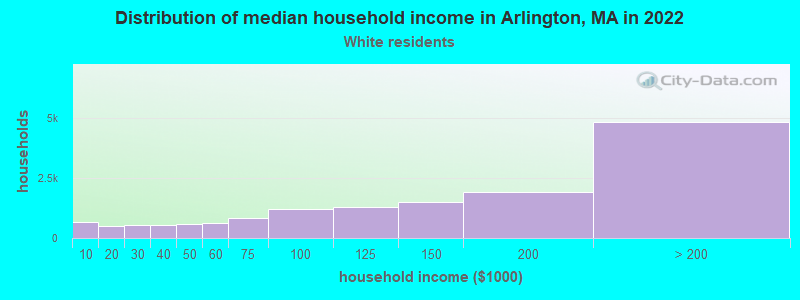
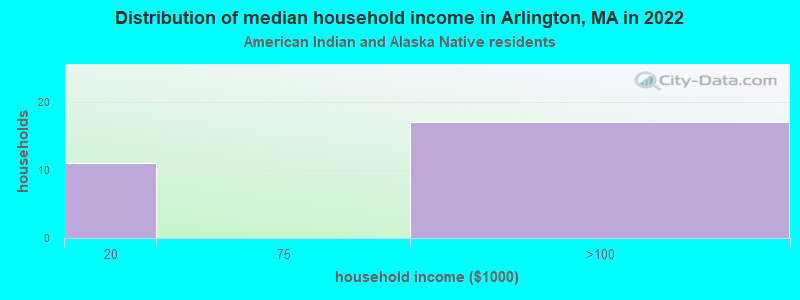
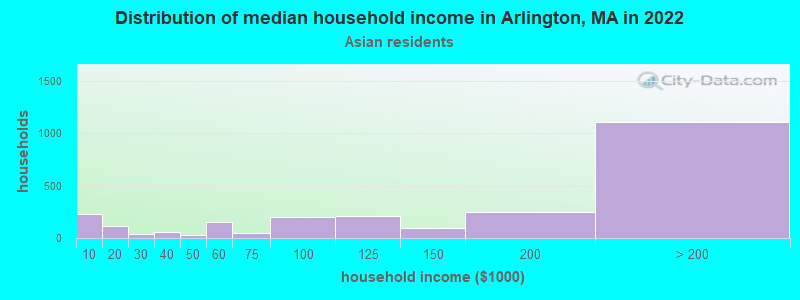
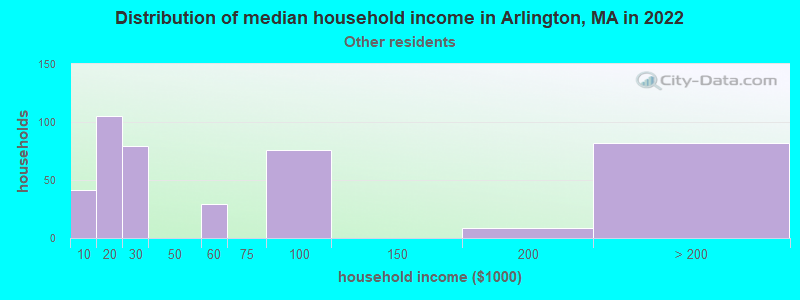
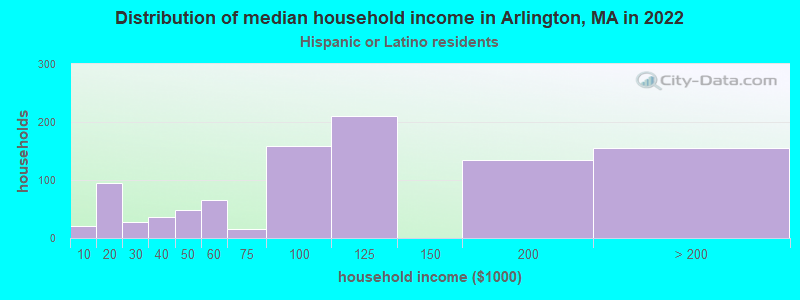
Income and house value in Arlington Median household income in 2022 $136,039 White non-Hispanic householders$77,969 Black householders$151,109 Asian householders$104,216 Two or more races householders$88,573 Hispanic or Latino race householdersMedian 2022 house value $884,770 White Non-Hispanic householders$710,304 Black or African American householders$349,865 American Indian or Alaska Native householders $859,580 Asian householders$889,746 Some other race householders$881,038 Two or more races householders$995,172 Hispanic or Latino householders
Median age by race in Arlington
45.1 Median age for White residents45.1 45.3 45.8 Median age for Black or African American residents47.2 43.5 61.2 Median age for American Indian / Alaska Native residents-751,004,015.3 86.7 37.5 Median age for Asian residents36.0 38.8 -514,227,641.8 Median age for Native Hawaiian / Pacific Islander residents-513,131,312.6 -508,717,948.2 43.1 Median age for Other race residents27.1 48.2 24.2 Median age for Two or more races residents22.6 26.7 45.2 Median age for White alone residents45.1 45.4 35.2 Median age for Hispanic or Latino residents32.6 35.6
Owner/renter occupied households by race in Arlington
House owners and renters - White residents 9,681 64.8% Owner occupied5,256 35.2% Renter occupiedHouse owners and renters - Black or African American residents 204 37.1% Owner occupied347 62.9% Renter occupiedHouse owners and renters - American Indian / Alaska Native residents 17 54.0% Owner occupied15 46.0% Renter occupiedHouse owners and renters - Asian residents 1,530 60.4% Owner occupied1,003 39.6% Renter occupiedHouse owners and renters - Native Hawaiian / Pacific Islander residents 7 100.0% Renter occupiedHouse owners and renters - Other race residents 87 23.8% Owner occupied280 76.2% Renter occupiedHouse owners and renters - Two or more races residents 352 30.1% Owner occupied819 69.9% Renter occupiedHouse owners and renters - White alone residents 9,621 64.7% Owner occupied5,241 35.3% Renter occupiedHouse owners and renters - Hispanic or Latino residents 215 21.8% Owner occupied771 78.2% Renter occupied
Language usage in Arlington
English speakers - Total 76.5% of residents of Arlington speak English at home.
2.9% of residents speak Spanish at home 974 78.7% Speak English very well264 21.3% Speak English less than very well20.3% of residents speak other language at home 6,243 71.1% Speak English very well2,541 28.9% Speak English less than very well
English speakers - Born in the United States 91.1% of residents of Arlington speak English at home.
2.0% of residents speak Spanish at home 234 87.0% Speak English very well35 13.0% Speak English less than very well6.9% of residents speak other language at home 892 97.1% Speak English very well27 2.9% Speak English less than very well
English speakers - Native, born elsewhere 43.3% of residents of Arlington speak English at home.
31.9% of residents speak Spanish at home 216 79.1% Speak English very well57 20.9% Speak English less than very well24.0% of residents speak other language at home 171 83.4% Speak English very well34 16.6% Speak English less than very well
English speakers - Foreign-born 20.3% of residents of Arlington speak English at home.
6.2% of residents speak Spanish at home 391 72.5% Speak English very well148 27.5% Speak English less than very well72.8% of residents speak other language at home 4,007 63.1% Speak English very well2,346 36.9% Speak English less than very well
White (Caucasian) - Speak only English Native:
95.6% (27,325)Foreign-born:
27.0% (789)
White (Caucasian) - Speak another language Native:
4.5% (1,289)Foreign-born:
72.9% (2,128)
Black or African American - Speak only English Native:
88.9% (848)Foreign-born:
56.1% (158)
Black or African American - Speak another language Native:
8.7% (83)Foreign-born:
45.1% (127)
American Indian / Alaska Native - Speak only English Native:
26.9% (8)Foreign-born:
76.4% (12)
Asian - Speak only English Native:
47.3% (756)Foreign-born:
11.2% (484)
Asian - Speak another language Native:
52.7% (844)Foreign-born:
88.7% (3,830)
Native Hawaiian / Pacific Islander - Speak only English Native:
99.5% (8)Foreign-born:
96.3% (6)
Other race - Speak only English Native:
59.4% (334)Foreign-born:
32.8% (88)
Other race - Speak another language Native:
45.1% (254)Foreign-born:
69.9% (188)
Two or more races - Speak only English Native:
78.6% (2,127)Foreign-born:
50.0% (315)
Two or more races - Speak another language Native:
20.0% (541)Foreign-born:
47.9% (302)
White alone - Speak only English Native:
95.7% (27,105)Foreign-born:
27.7% (779)
White alone - Speak another language Native:
4.3% (1,227)Foreign-born:
72.2% (2,033)
Hispanic or Latino - Speak only English Native:
66.2% (1,094)Foreign-born:
14.9% (94)
Hispanic or Latino - Speak another language Native:
35.9% (593)Foreign-born:
85.1% (539)
Foreign-born residents in Arlington 8,775 residents are foreign born (10.3% Asia , 4.7% Europe , 2.0% Latin America ).
This city:
19.2%Massachusetts:
17.6%
Marital status for residents in Arlington Marital status - White (Caucasian) population 15 years and over
Males 31.1% Never married58.2% Now married1.7% Separated2.4% Widowed6.5% DivorcedFemales 31.1% Never married50.5% Now married1.3% Separated6.4% Widowed10.7% DivorcedWomen who gave birth in the past 12 months Now married:
91.2% (305)Unmarried:
8.8% (29)
Women who did not give birth in the past 12 months Now married:
50.2% (3,498)Unmarried:
49.8% (3,470)
Marital status - Black or African American population 15 years and over
Males 45.5% Never married39.0% Now married0.0% Separated3.3% Widowed12.2% DivorcedFemales 73.3% Never married21.5% Now married1.8% Separated0.0% Widowed3.5% DivorcedWomen who did not give birth in the past 12 months Now married:
13.5% (45)Unmarried:
86.5% (286)
Marital status - Asian population 15 years and over
Males 29.8% Never married68.5% Now married0.0% Separated0.8% Widowed0.9% DivorcedFemales 19.7% Never married67.3% Now married4.4% Separated2.7% Widowed5.9% DivorcedWomen who gave birth in the past 12 months Now married:
100.0% (75)Unmarried:
0.0% (0)
Women who did not give birth in the past 12 months Now married:
70.7% (1,341)Unmarried:
29.3% (556)
Marital status - Native Hawaiian / Pacific Islander population 15 years and over
Males 100.0% Never married0.0% Now married0.0% Separated0.0% Widowed0.0% DivorcedFemales 100.0% Never married0.0% Now married0.0% Separated0.0% Widowed0.0% DivorcedMarital status - Other race population 15 years and over
Males 57.8% Never married42.2% Now married0.0% Separated0.0% Widowed0.0% DivorcedFemales 55.6% Never married35.6% Now married0.0% Separated0.0% Widowed8.8% DivorcedWomen who gave birth in the past 12 months Now married:
100.0% (23)Unmarried:
0.0% (0)
Women who did not give birth in the past 12 months Now married:
25.0% (51)Unmarried:
75.0% (154)
Marital status - Two or more races population 15 years and over
Males 45.1% Never married39.6% Now married0.0% Separated1.4% Widowed13.9% DivorcedFemales 63.9% Never married33.6% Now married0.0% Separated0.0% Widowed2.6% DivorcedWomen who gave birth in the past 12 months Now married:
56.2% (49)Unmarried:
43.8% (38)
Women who did not give birth in the past 12 months Now married:
31.4% (296)Unmarried:
68.6% (646)
Marital status - White alone, not Hispanic / Latino population 15 years and over
Males 30.9% Never married58.5% Now married1.5% Separated2.5% Widowed6.7% DivorcedFemales 31.0% Never married50.7% Now married1.1% Separated6.5% Widowed10.7% DivorcedWomen who gave birth in the past 12 months Now married:
91.0% (302)Unmarried:
9.0% (30)
Women who did not give birth in the past 12 months Now married:
50.2% (3,432)Unmarried:
49.8% (3,412)
Marital status - Hispanic or Latino population 15 years and over
Males 38.1% Never married46.2% Now married3.6% Separated0.0% Widowed12.1% DivorcedFemales 49.2% Never married37.0% Now married4.1% Separated2.0% Widowed7.8% DivorcedWomen who gave birth in the past 12 months Now married:
100.0% (32)Unmarried:
0.0% (0)
Women who did not give birth in the past 12 months Now married:
37.4% (252)Unmarried:
62.6% (423)
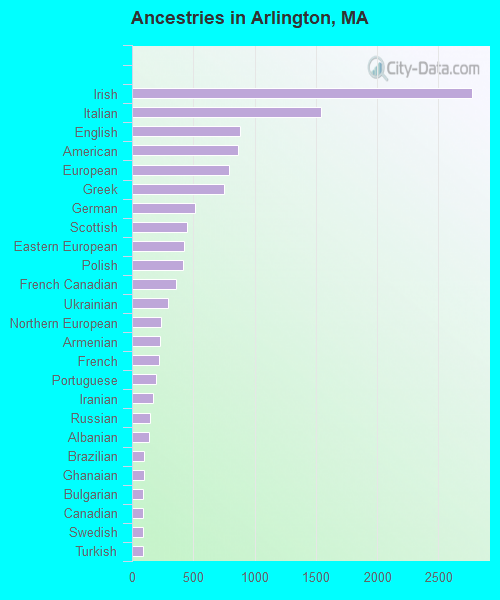
Ancestries in Arlington
2,774 12.8% Irish1,545 7.1% Italian883 4.1% English862 4.0% American789 3.6% European753 3.5% Greek516 2.4% German446 2.1% Scottish426 2.0% Eastern European414 1.9% Polish355 1.6% French Canadian295 1.4% Ukrainian236 1.1% Northern European225 1.0% Armenian217 1.0% French193 0.9% Portuguese173 0.8% Iranian147 0.7% Russian140 0.6% Albanian101 0.5% Brazilian94 0.4% Ghanaian92 0.4% Bulgarian91 0.4% Canadian88 0.4% Swedish86 0.4% Turkish77 0.4% Dutch77 0.4% Haitian69 0.3% British69 0.3% Jamaican65 0.3% Finnish65 0.3% Scotch-Irish59 0.3% Lithuanian57 0.3% African52 0.2% Norwegian51 0.2% Welsh43 0.2% Syrian41 0.2% Lebanese30 0.1% Czechoslovakian27 0.1% Jordanian24 0.1% Egyptian23 0.1% Danish23 0.1% Celtic21 0.10% Ethiopian21 0.10% Czech20 0.09% Slovene19 0.09% West Indian19 0.09% Yugoslavian18 0.08% Assyrian17 0.08% Icelander17 0.08% Swiss15 0.07% British West Indian14 0.06% Israeli13 0.06% Cape Verdean13 0.06% Romanian9 0.04% New Zealander8 0.04% Slovak2 0.01% Hungarian
Geographical mobility in Arlington Same house 1 year ago 28,772 88.1% White (Caucasian)1,105 87.7% Black or African American62 100.0% American Indian / Alaska Native5,422 86.3% Asian6 46.6% Native Hawaiian / Pacific Islander738 85.1% Other race3,072 80.3% Two or more races28,537 88.3% White alone, not Hispanic / Latino1,844 75.9% Hispanic or LatinoMoved within same county 2,188 6.7% White / Caucasian26 2.1% Black or African American377 6.0% Asian64 7.4% Other race280 7.3% Two or more races2,123 6.6% White alone, not Hispanic / Latino276 11.4% Hispanic or LatinoMoved within same state 896 2.7% White / Caucasian159 12.6% Black or African American279 4.4% Asian8 56.4% Native Hawaiian / Pacific Islander145 3.8% Two or more races879 2.7% White alone, not Hispanic / Latino151 6.2% Hispanic or LatinoMoved from different state 485 1.5% White / Caucasian63 1.0% Asian51 5.9% Other race82 2.1% Two or more races466 1.4% White alone, not Hispanic / Latino138 5.7% Hispanic or LatinoMoved from abroad 319 1.0% White116 1.8% Asian290 7.6% Two or more races318 1.0% White alone, not Hispanic / Latino23 0.9% Hispanic or Latino
Children Nativity (place of birth) in Arlington
Children under 6 years - Living with two parents Both parents native 1,661 100.0% NativeBoth parents foreign-born 568 98.4% Native9 1.6% Foreign-bornOne native, one foreign-born parent 358 100.0% NativeChildren under 6 years - Living with one parent Native parent 199 100.0% NativeForeign-born parent 50 56.5% Native39 43.5% Foreign-bornChildren 6 to 17 years - Living with two parents Both parents native 3,438 98.4% Native57 1.6% Foreign-bornBoth parents foreign-born 690 70.4% Native291 29.6% Foreign-bornOne native, one foreign-born parent 817 98.9% Native9 1.1% Foreign-bornChildren 6 to 17 years - Living with one parent Native parent 514 79.8% Native130 20.2% Foreign-bornForeign-born parent 395 67.8% Native188 32.2% Foreign-born
Place of birth for residents in Arlington
Grandparents responsible for own grandchildren in Arlington
Grandparents (30 to 59 years) White / Caucasian 15 100.0% Responsible for grandchildrenBlack or African American 1 77.0% Responsible for grandchildrenAsian 56 100.0% Not responsible for grandchildrenWhite alone, not Hispanic / Latino 17 100.0% Responsible for grandchildrenHispanic or Latino 2 100.0% Responsible for grandchildren
Grandparents (60 years and over) White / Caucasian 14 3.9% Responsible for grandchildren340 96.1% Not responsible for grandchildrenBlack or African American 12 100.0% Not responsible for grandchildrenAsian 99 100.0% Not responsible for grandchildrenWhite alone, not Hispanic / Latino 14 4.0% Responsible for grandchildren337 96.0% Not responsible for grandchildren