Races in Bartlett, Tennessee (TN) Detailed Stats
Data:
Races - White alone (%)
Races - White alone (% change since 2000)
Races - Black alone (%)
Races - Black alone (% change since 2000)
Races - American Indian alone (%)
Races - American Indian alone (% change since 2000)
Races - Asian alone (%)
Races - Asian alone (% change since 2000)
Races - Hispanic (%)
Races - Hispanic (% change since 2000)
Races - Native Hawaiian and Other Pacific Islander alone (%)
Races - Native Hawaiian and Other Pacific Islander alone (% change since 2000)
Races - Two or more races(%)
Races - Two or more races(% change since 2000)
Races - Other race alone (%)
Races - Other race alone (% change since 2000)
Racial diversity
Place of birth - Born in state of residence (%)
Place of birth - Born in state of residence (%) - White
Place of birth - Born in state of residence (%) - Black or African American
Place of birth - Born in state of residence (%) - Asian
Place of birth - Born in state of residence (%) - Hispanic or Latino
Place of birth - Born in state of residence (%) - American Indian and Alaska Native
Place of birth - Born in state of residence (%) - Multirace
Place of birth - Born in state of residence (%) - Other Race
Place of birth - Born in other state (%)
Place of birth - Born in other state (%) - White
Place of birth - Born in other state (%) - Black or African American
Place of birth - Born in other state (%) - Asian
Place of birth - Born in other state (%) - Hispanic or Latino
Place of birth - Born in other state (%) - American Indian and Alaska Native
Place of birth - Born in other state (%) - Multirace
Place of birth - Born in other state (%) - Other Race
Place of birth - Native, outside of US (%)
Place of birth - Native, outside of US (%) - White
Place of birth - Native, outside of US (%) - Black or African American
Place of birth - Native, outside of US (%) - Asian
Place of birth - Native, outside of US (%) - Hispanic or Latino
Place of birth - Native, outside of US (%) - American Indian and Alaska Native
Place of birth - Native, outside of US (%) - Multirace
Place of birth - Native, outside of US (%) - Other Race
Place of birth - Foreign born (%)
Place of birth - Foreign born (%) - White
Place of birth - Foreign born (%) - Black or African American
Place of birth - Foreign born (%) - Asian
Place of birth - Foreign born (%) - Hispanic or Latino
Place of birth - Foreign born (%) - American Indian and Alaska Native
Place of birth - Foreign born (%) - Multirace
Place of birth - Foreign born (%) - Other Race
Residents speaking English at home (%)
Residents speaking English at home - Born in the United States (%)
Residents speaking English at home - Native, born elsewhere (%)
Residents speaking English at home - Foreign born (%)
Residents speaking Spanish at home (%)
Residents speaking Spanish at home - Born in the United States (%)
Residents speaking Spanish at home - Native, born elsewhere (%)
Residents speaking Spanish at home - Foreign born (%)
Residents speaking other language at home (%)
Residents speaking other language at home - Born in the United States (%)
Residents speaking other language at home - Native, born elsewhere (%)
Residents speaking other language at home - Foreign born (%)
Marital status - Never married (%)
Marital status - Now married (%)
Marital status - Separated (%)
Marital status - Widowed (%)
Marital status - Divorced (%)
Ancestries Reported - Arab (%)
Ancestries Reported - Czech (%)
Ancestries Reported - Danish (%)
Ancestries Reported - Dutch (%)
Ancestries Reported - English (%)
Ancestries Reported - French (%)
Ancestries Reported - French Canadian (%)
Ancestries Reported - German (%)
Ancestries Reported - Greek (%)
Ancestries Reported - Hungarian (%)
Ancestries Reported - Irish (%)
Ancestries Reported - Italian (%)
Ancestries Reported - Lithuanian (%)
Ancestries Reported - Norwegian (%)
Ancestries Reported - Polish (%)
Ancestries Reported - Portuguese (%)
Ancestries Reported - Russian (%)
Ancestries Reported - Scotch-Irish (%)
Ancestries Reported - Scottish (%)
Ancestries Reported - Slovak (%)
Ancestries Reported - Subsaharan African (%)
Ancestries Reported - Swedish (%)
Ancestries Reported - Swiss (%)
Ancestries Reported - Ukrainian (%)
Ancestries Reported - United States (%)
Ancestries Reported - Welsh (%)
Ancestries Reported - West Indian (%)
Ancestries Reported - Other (%)
Geographical mobility - Same house 1 year ago (%)
Geographical mobility - Same house 1 year ago (%) - White
Geographical mobility - Same house 1 year ago (%) - Black or African American
Geographical mobility - Same house 1 year ago (%) - Asian
Geographical mobility - Same house 1 year ago (%) - Hispanic or Latino
Geographical mobility - Same house 1 year ago (%) - American Indian and Alaska Native
Geographical mobility - Same house 1 year ago (%) - Multirace
Geographical mobility - Same house 1 year ago (%) - Other Race
Geographical mobility - Moved within same county (%)
Geographical mobility - Moved within same county (%) - White
Geographical mobility - Moved within same county (%) - Black or African American
Geographical mobility - Moved within same county (%) - Asian
Geographical mobility - Moved within same county (%) - Hispanic or Latino
Geographical mobility - Moved within same county (%) - American Indian and Alaska Native
Geographical mobility - Moved within same county (%) - Multirace
Geographical mobility - Moved within same county (%) - Other Race
Geographical mobility - Moved from different county within same state (%)
Geographical mobility - Moved from different county within same state (%) - White
Geographical mobility - Moved from different county within same state (%) - Black or African American
Geographical mobility - Moved from different county within same state (%) - Asian
Geographical mobility - Moved from different county within same state (%) - Hispanic or Latino
Geographical mobility - Moved from different county within same state (%) - American Indian and Alaska Native
Geographical mobility - Moved from different county within same state (%) - Multirace
Geographical mobility - Moved from different county within same state (%) - Other Race
Geographical mobility - Moved from different state (%)
Geographical mobility - Moved from different state (%) - White
Geographical mobility - Moved from different state (%) - Black or African American
Geographical mobility - Moved from different state (%) - Asian
Geographical mobility - Moved from different state (%) - Hispanic or Latino
Geographical mobility - Moved from different state (%) - American Indian and Alaska Native
Geographical mobility - Moved from different state (%) - Multirace
Geographical mobility - Moved from different state (%) - Other Race
Geographical mobility - Moved from abroad (%)
Geographical mobility - Moved from abroad (%) - White
Geographical mobility - Moved from abroad (%) - Black or African American
Geographical mobility - Moved from abroad (%) - Asian
Geographical mobility - Moved from abroad (%) - Hispanic or Latino
Geographical mobility - Moved from abroad (%) - American Indian and Alaska Native
Geographical mobility - Moved from abroad (%) - Multirace
Geographical mobility - Moved from abroad (%) - Other Race
Place of birth for the foreign-born population - Ireland (%)
Place of birth for the foreign-born population - Denmark (%)
Place of birth for the foreign-born population - Norway (%)
Place of birth for the foreign-born population - Sweden (%)
Place of birth for the foreign-born population - United Kingdom (%)
Place of birth for the foreign-born population - England (%)
Place of birth for the foreign-born population - Scotland (%)
Place of birth for the foreign-born population - Other Northern Europe (%)
Place of birth for the foreign-born population - Austria (%)
Place of birth for the foreign-born population - Belgium (%)
Place of birth for the foreign-born population - France (%)
Place of birth for the foreign-born population - Germany (%)
Place of birth for the foreign-born population - Netherlands (%)
Place of birth for the foreign-born population - Switzerland (%)
Place of birth for the foreign-born population - Other Western Europe (%)
Place of birth for the foreign-born population - Greece (%)
Place of birth for the foreign-born population - Italy (%)
Place of birth for the foreign-born population - Portugal (%)
Place of birth for the foreign-born population - Spain (%)
Place of birth for the foreign-born population - Other Southern Europe (%)
Place of birth for the foreign-born population - Albania (%)
Place of birth for the foreign-born population - Belarus (%)
Place of birth for the foreign-born population - Bosnia and Herzegovina (%)
Place of birth for the foreign-born population - Bulgaria (%)
Place of birth for the foreign-born population - Croatia (%)
Place of birth for the foreign-born population - Czechoslovakia (%)
Place of birth for the foreign-born population - Hungary (%)
Place of birth for the foreign-born population - Latvia (%)
Place of birth for the foreign-born population - Lithuania (%)
Place of birth for the foreign-born population - North Macedonia (Macedonia) (%)
Place of birth for the foreign-born population - Moldova (%)
Place of birth for the foreign-born population - Poland (%)
Place of birth for the foreign-born population - Romania (%)
Place of birth for the foreign-born population - Russia (%)
Place of birth for the foreign-born population - Serbia (%)
Place of birth for the foreign-born population - Ukraine (%)
Place of birth for the foreign-born population - Other Eastern Europe (%)
Place of birth for the foreign-born population - China (%)
Place of birth for the foreign-born population - Hong Kong (%)
Place of birth for the foreign-born population - Taiwan (%)
Place of birth for the foreign-born population - Japan (%)
Place of birth for the foreign-born population - Korea (%)
Place of birth for the foreign-born population - Other Eastern Asia (%)
Place of birth for the foreign-born population - Afghanistan (%)
Place of birth for the foreign-born population - Bangladesh (%)
Place of birth for the foreign-born population - India (%)
Place of birth for the foreign-born population - Iran (%)
Place of birth for the foreign-born population - Kazakhstan (%)
Place of birth for the foreign-born population - Nepal (%)
Place of birth for the foreign-born population - Pakistan (%)
Place of birth for the foreign-born population - Sri Lanka (%)
Place of birth for the foreign-born population - Uzbekistan (%)
Place of birth for the foreign-born population - Other South Central Asia (%)
Place of birth for the foreign-born population - Burma (%)
Place of birth for the foreign-born population - Cambodia (%)
Place of birth for the foreign-born population - Indonesia (%)
Place of birth for the foreign-born population - Laos (%)
Place of birth for the foreign-born population - Malaysia (%)
Place of birth for the foreign-born population - Philippines (%)
Place of birth for the foreign-born population - Singapore (%)
Place of birth for the foreign-born population - Thailand (%)
Place of birth for the foreign-born population - Vietnam (%)
Place of birth for the foreign-born population - Other South Eastern Asia (%)
Place of birth for the foreign-born population - Armenia (%)
Place of birth for the foreign-born population - Iraq (%)
Place of birth for the foreign-born population - Israel (%)
Place of birth for the foreign-born population - Jordan (%)
Place of birth for the foreign-born population - Kuwait (%)
Place of birth for the foreign-born population - Lebanon (%)
Place of birth for the foreign-born population - Saudi Arabia (%)
Place of birth for the foreign-born population - Syria (%)
Place of birth for the foreign-born population - Turkey (%)
Place of birth for the foreign-born population - Yemen (%)
Place of birth for the foreign-born population - Other Western Asia (%)
Place of birth for the foreign-born population - Eritrea (%)
Place of birth for the foreign-born population - Ethiopia (%)
Place of birth for the foreign-born population - Kenya (%)
Place of birth for the foreign-born population - Somalia (%)
Place of birth for the foreign-born population - Uganda (%)
Place of birth for the foreign-born population - Zimbabwe (%)
Place of birth for the foreign-born population - Other Eastern Africa (%)
Place of birth for the foreign-born population - Cameroon (%)
Place of birth for the foreign-born population - Congo (%)
Place of birth for the foreign-born population - Democratic Republic of Congo (Zaire) (%)
Place of birth for the foreign-born population - Other Middle Africa (%)
Place of birth for the foreign-born population - Egypt (%)
Place of birth for the foreign-born population - Morocco (%)
Place of birth for the foreign-born population - Sudan (%)
Place of birth for the foreign-born population - Other Northern Africa (%)
Place of birth for the foreign-born population - South Africa (%)
Place of birth for the foreign-born population - Other Southern Africa (%)
Place of birth for the foreign-born population - Cabo Verde (%)
Place of birth for the foreign-born population - Ghana (%)
Place of birth for the foreign-born population - Liberia (%)
Place of birth for the foreign-born population - Nigeria (%)
Place of birth for the foreign-born population - Senegal (%)
Place of birth for the foreign-born population - Sierra Leone (%)
Place of birth for the foreign-born population - Other Western Africa (%)
Place of birth for the foreign-born population - Australia (%)
Place of birth for the foreign-born population - New Zealand (%)
Place of birth for the foreign-born population - Fiji (%)
Place of birth for the foreign-born population - Micronesia (%)
Place of birth for the foreign-born population - Bahamas (%)
Place of birth for the foreign-born population - Barbados (%)
Place of birth for the foreign-born population - Cuba (%)
Place of birth for the foreign-born population - Dominica (%)
Place of birth for the foreign-born population - Dominican Republic (%)
Place of birth for the foreign-born population - Grenada (%)
Place of birth for the foreign-born population - Haiti (%)
Place of birth for the foreign-born population - Jamaica (%)
Place of birth for the foreign-born population - St. Vincent and the Grenadines (%)
Place of birth for the foreign-born population - Trinidad and Tobago (%)
Place of birth for the foreign-born population - West Indies (%)
Place of birth for the foreign-born population - Other Caribbean (%)
Place of birth for the foreign-born population - Belize (%)
Place of birth for the foreign-born population - Costa Rica (%)
Place of birth for the foreign-born population - El Salvador (%)
Place of birth for the foreign-born population - Guatemala (%)
Place of birth for the foreign-born population - Honduras (%)
Place of birth for the foreign-born population - Mexico (%)
Place of birth for the foreign-born population - Nicaragua (%)
Place of birth for the foreign-born population - Panama (%)
Place of birth for the foreign-born population - Other Central America (%)
Place of birth for the foreign-born population - Argentina (%)
Place of birth for the foreign-born population - Bolivia (%)
Place of birth for the foreign-born population - Brazil (%)
Place of birth for the foreign-born population - Chile (%)
Place of birth for the foreign-born population - Colombia (%)
Place of birth for the foreign-born population - Ecuador (%)
Place of birth for the foreign-born population - Guyana (%)
Place of birth for the foreign-born population - Peru (%)
Place of birth for the foreign-born population - Uruguay (%)
Place of birth for the foreign-born population - Venezuela (%)
Place of birth for the foreign-born population - Other South America (%)
Place of birth for the foreign-born population - Canada (%)
Place of birth for the foreign-born population - Other Northern America (%)
Place of birth for the foreign-born population - Other (%)
Latest news about races in Bartlett, TN collected exclusively by city-data.com from local newspapers, TV, and radio stations
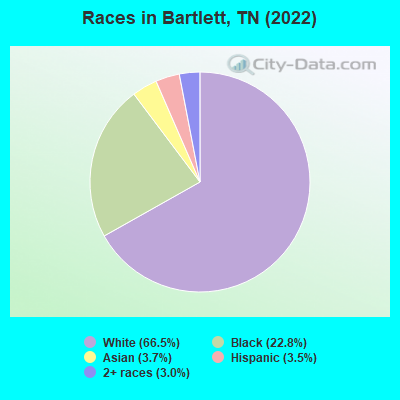
According to 2022 data, the most numerous races in Bartlett, TN are White alone (37,797 residents), Black alone (12,946 residents), and Hispanic (1,991 residents). 92.0% of Bartlett residents speak English at home. 7.1% of Bartlett, TN residents are foreign-born (4.1% born in Asia, 1.1% born in Latin America), which is 29.4% greater than the foreign-born rate of 5.0% across the entire state of Tennessee.
Race distribution in Bartlett
2000 2022
4,505,930 79.2% White alone 928,204 16.3% Black alone 123,838 2.2% Hispanic 54,824 1.0% Two or more races 56,077 1.0% Asian alone 13,820 0.2% American Indian alone 4,780 0.08% Other race alone 1,810 0.03% Native Hawaiian and Other
5,070,026 71.9% White alone 1,089,738 15.5% Black alone 442,629 6.3% Hispanic 279,381 4.0% Two or more races 131,817 1.9% Asian alone 26,972 0.4% Other race alone 6,387 0.09% American Indian alone 4,389 0.06% Native Hawaiian and Other
Income and house value in Bartlett Median household income in 2022 $94,119 White non-Hispanic householders$106,199 Black householders$57,979 Asian householders$115,533 Hispanic or Latino race householdersMedian 2022 house value $305,490 White Non-Hispanic householders$354,332 Black or African American householders$275,079 American Indian or Alaska Native householders $298,348 Asian householders$118,187 Some other race householders$206,655 Two or more races householders$319,083 Hispanic or Latino householders
Median age by race in Bartlett
44.3 Median age for White residents43.4 44.5 40.9 Median age for Black or African American residents41.2 41.6 85.8 Median age for American Indian / Alaska Native residents75.4 -801,477,376.9 38.1 Median age for Asian residents44.3 28.1 -480,757,844.4 Median age for Native Hawaiian / Pacific Islander residents-951,707,890.7 -671,105,192.4 43.6 Median age for Other race residents15.1 56.8 20.8 Median age for Two or more races residents18.4 21.5 44.7 Median age for White alone residents44.4 44.4 21.6 Median age for Hispanic or Latino residents18.5 22.6
Owner/renter occupied households by race in Bartlett
House owners and renters - White residents 12,418 87.4% Owner occupied1,790 12.6% Renter occupiedHouse owners and renters - Black or African American residents 3,320 76.0% Owner occupied1,051 24.0% Renter occupiedHouse owners and renters - American Indian / Alaska Native residents 16 100.0% Owner occupiedHouse owners and renters - Asian residents 492 83.6% Owner occupied96 16.4% Renter occupiedHouse owners and renters - Other race residents 96 89.7% Owner occupied11 10.3% Renter occupiedHouse owners and renters - Two or more races residents 397 86.0% Owner occupied65 14.0% Renter occupiedHouse owners and renters - White alone residents 12,449 87.6% Owner occupied1,757 12.4% Renter occupiedHouse owners and renters - Hispanic or Latino residents 282 70.0% Owner occupied121 30.0% Renter occupied
Language usage in Bartlett
English speakers - Total 92.0% of residents of Bartlett speak English at home.
2.3% of residents speak Spanish at home 889 72.2% Speak English very well342 27.8% Speak English less than very well5.5% of residents speak other language at home 1,917 65.4% Speak English very well1,014 34.6% Speak English less than very well
English speakers - Born in the United States 97.9% of residents of Bartlett speak English at home.
1.3% of residents speak Spanish at home 257 91.8% Speak English very well23 8.2% Speak English less than very well0.9% of residents speak other language at home 175 90.7% Speak English very well18 9.3% Speak English less than very well
English speakers - Native, born elsewhere 88.9% of residents of Bartlett speak English at home.
2.4% of residents speak Spanish at home 18 100.0% Speak English very well13.4% of residents speak other language at home 83 83.8% Speak English very well16 16.2% Speak English less than very well
English speakers - Foreign-born 28.8% of residents of Bartlett speak English at home.
16.4% of residents speak Spanish at home 327 49.6% Speak English very well332 50.4% Speak English less than very well51.3% of residents speak other language at home 1,141 55.3% Speak English very well924 44.7% Speak English less than very well
White (Caucasian) - Speak only English Native:
99.0% (33,960)Foreign-born:
44.3% (688)
White (Caucasian) - Speak another language Native:
1.6% (532)Foreign-born:
54.0% (840)
Black or African American - Speak only English Native:
97.3% (11,427)Foreign-born:
20.1% (66)
Black or African American - Speak another language Native:
2.7% (321)Foreign-born:
74.5% (243)
American Indian / Alaska Native - Speak only English Native:
87.7% (35)Foreign-born:
79.1% (17)
Asian - Speak only English Native:
64.4% (353)Foreign-born:
12.4% (156)
Asian - Speak another language Native:
36.3% (199)Foreign-born:
85.7% (1,078)
Other race - Speak only English Native:
56.3% (158)Foreign-born:
3.2% (8)
Other race - Speak another language Native:
43.3% (121)Foreign-born:
97.2% (247)
Two or more races - Speak only English Native:
95.7% (1,700)Foreign-born:
17.1% (19)
Two or more races - Speak another language Native:
5.0% (88)Foreign-born:
84.2% (95)
White alone - Speak only English Native:
98.6% (33,975)Foreign-born:
45.0% (666)
White alone - Speak another language Native:
1.3% (459)Foreign-born:
48.1% (712)
Hispanic or Latino - Speak only English Native:
59.3% (574)Foreign-born:
6.7% (47)
Hispanic or Latino - Speak another language Native:
43.1% (417)Foreign-born:
93.1% (658)
Foreign-born residents in Bartlett 4,025 residents are foreign born (4.1% Asia , 1.1% Latin America ).
This city:
7.1%Tennessee:
5.4%
Marital status for residents in Bartlett Marital status - White (Caucasian) population 15 years and over
Males 23.0% Never married66.5% Now married0.7% Separated2.9% Widowed6.8% DivorcedFemales 21.2% Never married60.6% Now married1.0% Separated8.0% Widowed9.2% DivorcedWomen who gave birth in the past 12 months Now married:
77.9% (332)Unmarried:
22.1% (94)
Women who did not give birth in the past 12 months Now married:
51.8% (3,852)Unmarried:
48.2% (3,580)
Marital status - Black or African American population 15 years and over
Males 40.4% Never married53.4% Now married1.7% Separated2.8% Widowed1.7% DivorcedFemales 37.0% Never married45.3% Now married2.2% Separated4.6% Widowed10.9% DivorcedWomen who gave birth in the past 12 months Now married:
100.0% (81)Unmarried:
0.0% (0)
Women who did not give birth in the past 12 months Now married:
42.0% (1,374)Unmarried:
58.0% (1,895)
Marital status - Asian population 15 years and over
Males 10.5% Never married87.1% Now married0.0% Separated2.4% Widowed0.0% DivorcedFemales 29.0% Never married67.3% Now married1.2% Separated1.3% Widowed1.2% DivorcedWomen who gave birth in the past 12 months Now married:
100.0% (31)Unmarried:
0.0% (0)
Women who did not give birth in the past 12 months Now married:
54.0% (286)Unmarried:
46.0% (243)
Marital status - Other race population 15 years and over
Males 18.6% Never married81.4% Now married0.0% Separated0.0% Widowed0.0% DivorcedFemales 16.1% Never married33.9% Now married0.0% Separated30.6% Widowed19.4% DivorcedWomen who did not give birth in the past 12 months Now married:
25.8% (32)Unmarried:
74.2% (91)
Marital status - Two or more races population 15 years and over
Males 22.5% Never married65.9% Now married2.2% Separated0.3% Widowed9.2% DivorcedFemales 36.4% Never married49.8% Now married0.0% Separated0.0% Widowed13.8% DivorcedWomen who gave birth in the past 12 months Now married:
100.0% (19)Unmarried:
0.0% (0)
Women who did not give birth in the past 12 months Now married:
32.9% (166)Unmarried:
67.1% (338)
Marital status - White alone, not Hispanic / Latino population 15 years and over
Males 23.0% Never married66.6% Now married0.4% Separated3.0% Widowed7.0% DivorcedFemales 21.4% Never married60.1% Now married1.1% Separated8.1% Widowed9.4% DivorcedWomen who gave birth in the past 12 months Now married:
77.9% (346)Unmarried:
22.1% (98)
Women who did not give birth in the past 12 months Now married:
50.8% (3,792)Unmarried:
49.2% (3,676)
Marital status - Hispanic or Latino population 15 years and over
Males 26.6% Never married63.8% Now married9.3% Separated0.0% Widowed0.2% DivorcedFemales 23.9% Never married59.5% Now married0.0% Separated11.0% Widowed5.6% DivorcedWomen who gave birth in the past 12 months Now married:
100.0% (12)Unmarried:
0.0% (0)
Women who did not give birth in the past 12 months Now married:
56.8% (271)Unmarried:
43.2% (206)
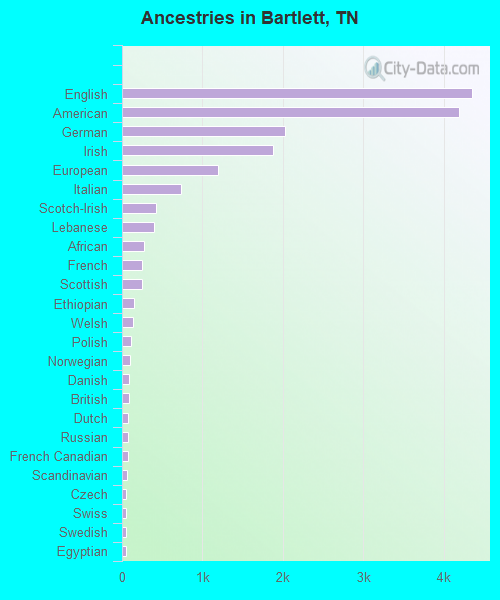
Ancestries in Bartlett
4,346 13.2% English4,196 12.8% American2,025 6.2% German1,880 5.7% Irish1,191 3.6% European738 2.2% Italian424 1.3% Scotch-Irish395 1.2% Lebanese273 0.8% African253 0.8% French252 0.8% Scottish153 0.5% Ethiopian131 0.4% Welsh118 0.4% Polish104 0.3% Norwegian93 0.3% Danish90 0.3% British80 0.2% Dutch69 0.2% Russian69 0.2% French Canadian66 0.2% Scandinavian54 0.2% Czech52 0.2% Swiss51 0.2% Swedish47 0.1% Egyptian44 0.1% Jordanian43 0.1% Iranian37 0.1% Greek35 0.1% Eastern European27 0.08% Yugoslavian20 0.06% Syrian20 0.06% Canadian18 0.05% Hungarian13 0.04% Palestinian11 0.03% Austrian10 0.03% Croatian10 0.03% Bahamian9 0.03% Northern European7 0.02% Romanian6 0.02% South African5 0.02% Finnish
Geographical mobility in Bartlett Same house 1 year ago 33,878 90.5% White (Caucasian)11,115 87.2% Black or African American62 100.0% American Indian / Alaska Native1,955 95.1% Asian486 88.1% Other race1,988 95.1% Two or more races34,048 91.0% White alone, not Hispanic / Latino1,591 81.1% Hispanic or LatinoMoved within same county 2,289 6.1% White / Caucasian1,109 8.7% Black or African American20 1.0% Asian77 3.7% Two or more races2,162 5.8% White alone, not Hispanic / Latino181 9.2% Hispanic or LatinoMoved within same state 832 2.2% White / Caucasian329 2.6% Black or African American770 2.1% White alone, not Hispanic / Latino74 3.8% Hispanic or LatinoMoved from different state 523 1.4% White / Caucasian119 0.9% Black or African American43 7.7% Other race3 0.1% Two or more races524 1.4% White alone, not Hispanic / Latino48 2.5% Hispanic or LatinoMoved from abroad 31 0.1% White67 0.5% Black or African American161 7.8% Asian21 3.7% Other race48 0.1% White alone, not Hispanic / Latino
Children Nativity (place of birth) in Bartlett
Children under 6 years - Living with two parents Both parents native 2,765 100.0% NativeBoth parents foreign-born 329 100.0% NativeOne native, one foreign-born parent 316 100.0% NativeChildren under 6 years - Living with one parent Native parent 482 100.0% NativeChildren 6 to 17 years - Living with two parents Both parents native 4,691 99.8% Native9 0.2% Foreign-bornBoth parents foreign-born 445 57.0% Native336 43.0% Foreign-bornOne native, one foreign-born parent 366 100.0% NativeChildren 6 to 17 years - Living with one parent Native parent 1,843 100.0% NativeForeign-born parent 162 48.3% Native174 51.7% Foreign-born
Grandparents responsible for own grandchildren in Bartlett
Grandparents (30 to 59 years) White / Caucasian 123 59.2% Responsible for grandchildren85 40.8% Not responsible for grandchildrenBlack or African American 56 100.0% Not responsible for grandchildrenAsian 18 100.0% Responsible for grandchildrenOther race 32 100.0% Not responsible for grandchildrenWhite alone, not Hispanic / Latino 114 62.4% Responsible for grandchildren69 37.6% Not responsible for grandchildrenHispanic or Latino 38 100.0% Not responsible for grandchildrenGrandparents (60 years and over) White / Caucasian 516 72.8% Responsible for grandchildren193 27.2% Not responsible for grandchildrenBlack or African American 13 6.0% Responsible for grandchildren201 94.0% Not responsible for grandchildrenAsian 207 100.0% Not responsible for grandchildrenOther race 31 100.0% Not responsible for grandchildrenWhite alone, not Hispanic / Latino 527 72.8% Responsible for grandchildren197 27.2% Not responsible for grandchildrenHispanic or Latino 34 100.0% Not responsible for grandchildren