Races in Bridgewater, Massachusetts (MA) Detailed Stats
Ancestries, Foreign-born residents, place of birth
Settings
X


Recent posts about races in Bridgewater, Massachusetts on our local forum with over 2,400,000 registered users:
 | Proposed new maps for Massachusetts House and Senate districts focus on strengthening minority communities (51 replies) |
| Mother in Duxbury murders her two kids (347 replies) |
| 2023 Real Estate Observations (5278 replies) |
| towns that offer the most jobs per dollar of house (58 replies) |
| MA 2022 Question 1 (258 replies) |
| 2021 Real Estate Observations (1729 replies) |
Latest news about races in Bridgewater, MA collected exclusively by city-data.com from local newspapers, TV, and radio stations
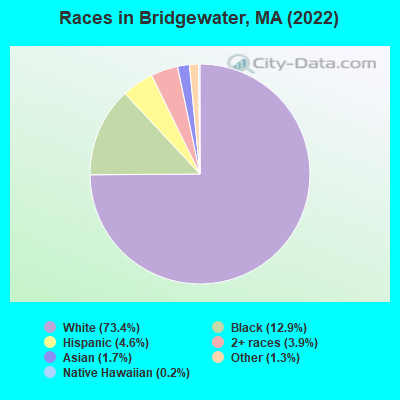
According to 2022 data, the most numerous races in Bridgewater, MA are White alone (7,015 residents), Hispanic (436 residents), and Asian alone (167 residents). 87.8% of Bridgewater residents speak English at home. 4.5% of Bridgewater, MA residents are foreign-born (1.6% born in Latin America, 1.2% born in Asia, 0.9% born in Africa, 0.5% born in Europe), which is 300.8% less than the foreign-born rate of 18.0% across the entire state of Massachusetts.
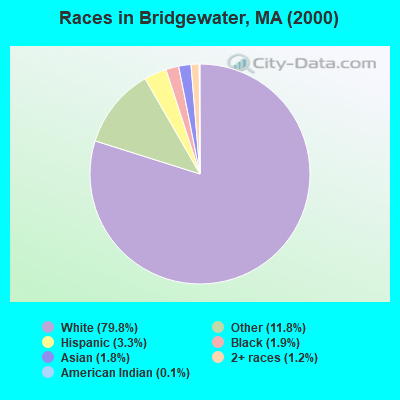
Race distribution in Bridgewater
2000
2022

- 5,31679.8%White alone
- 78911.8%Other race alone
- 2173.3%Hispanic
- 1271.9%Black alone
- 1211.8%Asian alone
- 821.2%Two or more races
- 80.1%American Indian alone
- 40.06%Native Hawaiian and Other
Pacific Islander alone
-
- 7,01573.4%White alone
- 1,23412.9%Black alone
- 4364.6%Hispanic
- 3773.9%Two or more races
- 1671.7%Asian alone
- 1241.3%Other race alone
- 230.2%Native Hawaiian and Other
Pacific Islander alone
2000
2022
-
- 5,198,35981.9%White alone
- 428,7296.8%Hispanic
- 318,3295.0%Black alone
- 236,7863.7%Asian alone
- 110,3381.7%Two or more races
- 43,5860.7%Other race alone
- 11,2640.2%American Indian alone
- 1,7060.03%Native Hawaiian and Other
Pacific Islander alone

-
- 4,676,62767.0%White alone
- 911,03813.0%Hispanic
- 501,4637.2%Asian alone
- 459,7406.6%Black alone
- 341,8894.9%Two or more races
- 84,4031.2%Other race alone
- 5,8380.08%American Indian alone
- 9760.01%Native Hawaiian and Other
Pacific Islander alone

Income and house value in Bridgewater
- Median household income in 2022
- $91,442White non-Hispanic householders
- $82,108Black householders
- $140,393American Indian and Alaska Native householders
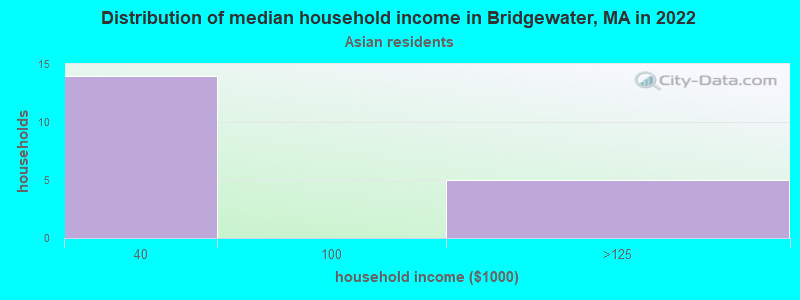
- $156,428Asian householders
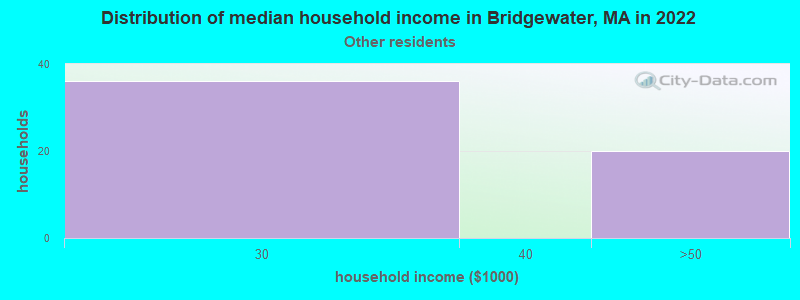
- $79,624Some other race householders
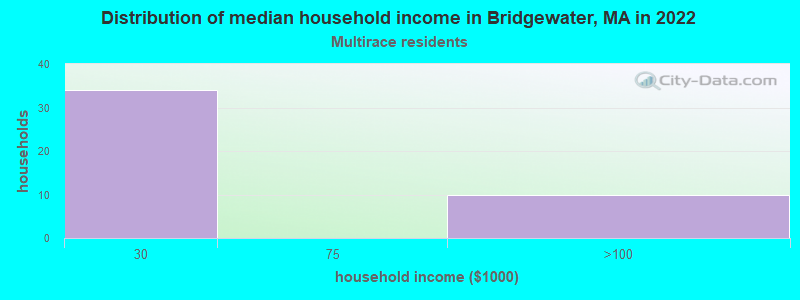
- $38,530Two or more races householders
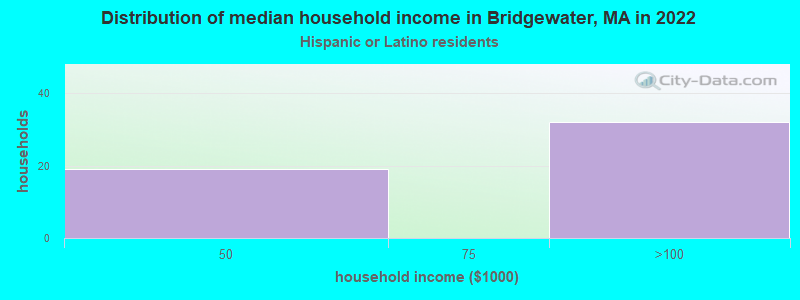
- over $200,000Hispanic or Latino race householders
- Median 2022 house value
- $506,686White Non-Hispanic householders
- $856,415American Indian or Alaska Native householders
- $295,852Asian householders
- $350,351Some other race householders
- $350,351Hispanic or Latino householders
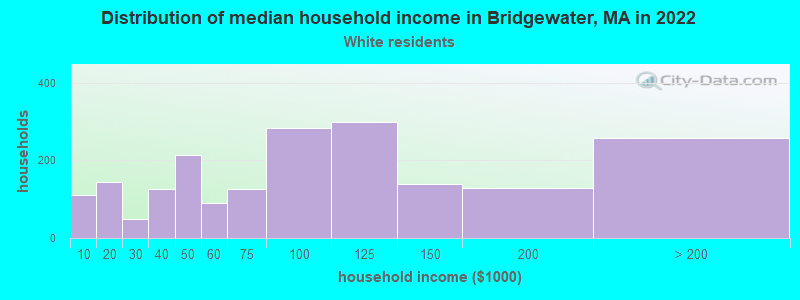
Household income for White non-Hispanic householders
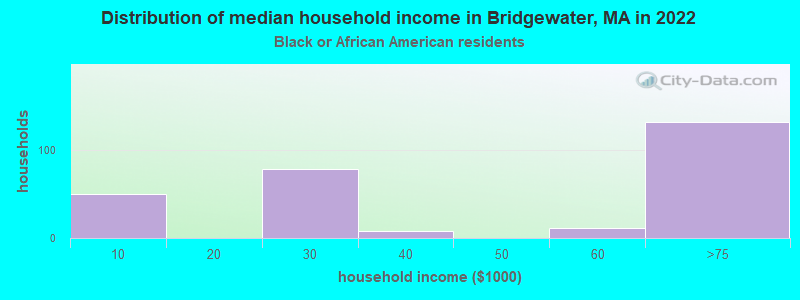
Household income for Black householders
Household income for Asian householders
Household income for Some other race householders
Household income for Two or more races householders
Household income for Hispanic or Latino race householders
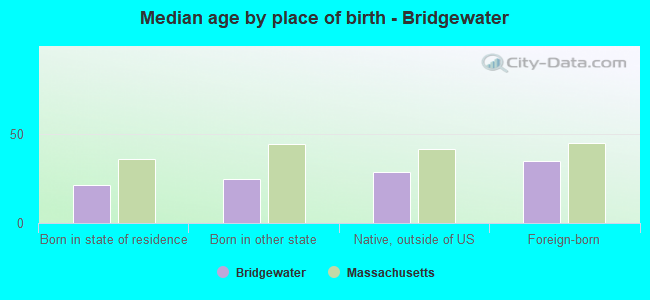
Median age by race in Bridgewater
- 23.0Median age for White residents
- 23.2Males
- 22.5Females
- 21.2Median age for Black or African American residents
- 23.6Males
- 19.2Females
- 52.7Median age for Asian residents
- 24.2Males
- 53.1Females
- 26.0Median age for Other race residents
- 24.0Males
- 27.3Females
- 30.9Median age for Two or more races residents
- 30.5Males
- 29.5Females
- 22.8Median age for White alone residents
- 23.2Males
- 22.4Females
- 21.0Median age for Hispanic or Latino residents
- 19.8Males
- 22.4Females
Owner/renter occupied households by race in Bridgewater
- House owners and renters - White residents
- 86841.4%Owner occupied
- 1,23158.6%Renter occupied
- House owners and renters - Black or African American residents
- 265100.0%Renter occupied
- House owners and renters - Asian residents
- 511.4%Owner occupied
- 3688.6%Renter occupied
- House owners and renters - Other race residents
- 35100.0%Renter occupied
- House owners and renters - Two or more races residents
- 1218.1%Owner occupied
- 5581.9%Renter occupied
- House owners and renters - White alone residents
- 87540.7%Owner occupied
- 1,27659.3%Renter occupied
- House owners and renters - Hispanic or Latino residents
- 40100.0%Renter occupied
Language usage in Bridgewater
- English speakers - Total
- 87.8% of residents of Bridgewater speak English at home.
- 3.0% of residents speak Spanish at home
- 19871.7%Speak English very well
- 7828.3%Speak English less than very well
- 7.9% of residents speak other language at home
- 54875.0%Speak English very well
- 18325.0%Speak English less than very well
- English speakers - Born in the United States
- 88.6% of residents of Bridgewater speak English at home.
- 6.9% of residents speak Spanish at home
- 6064.5%Speak English very well
- 3335.5%Speak English less than very well
- 4.7% of residents speak other language at home
- 64100.0%Speak English very well
- English speakers - Native, born elsewhere
- 42.3% of residents of Bridgewater speak English at home.
- 68.6% of residents speak other language at home
- 94100.0%Speak English very well
- English speakers - Foreign-born
- 19.5% of residents of Bridgewater speak English at home.
- 6.0% of residents speak Spanish at home
- 29100.0%Speak English very well
- 71.8% of residents speak other language at home
- 16948.7%Speak English very well
- 17851.3%Speak English less than very well
White (Caucasian) - Speak only English
| Native: | 97.9% (6,615) |
| Foreign-born: | 79.6% (67) |
White (Caucasian) - Speak another language
| Native: | 2.9% (198) |
| Foreign-born: | 34.9% (29) |
Black or African American - Speak another language
| Native: | 23.2% (220) |
| Foreign-born: | 96.4% (216) |
Asian - Speak only English
| Native: | 76.3% (64) |
| Foreign-born: | 25.8% (33) |
Asian - Speak another language
| Native: | 24.9% (21) |
| Foreign-born: | 73.1% (93) |
Two or more races - Speak another language
| Native: | 5.9% (34) |
| Foreign-born: | 100.0% (78) |
White alone - Speak only English
| Native: | 97.2% (6,598) |
| Foreign-born: | 100.0% (68) |
White alone - Speak another language
| Native: | 2.9% (199) |
| Foreign-born: | 14.5% (10) |
Hispanic or Latino - Speak another language
| Native: | 47.6% (167) |
| Foreign-born: | 100.0% (39) |
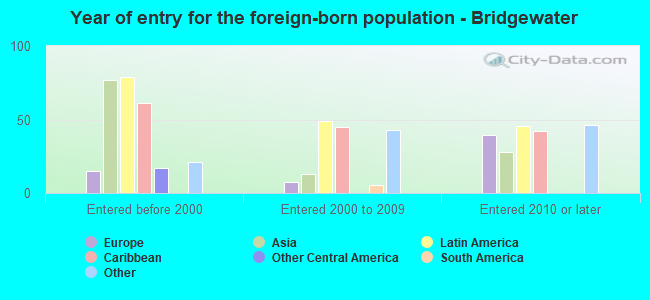
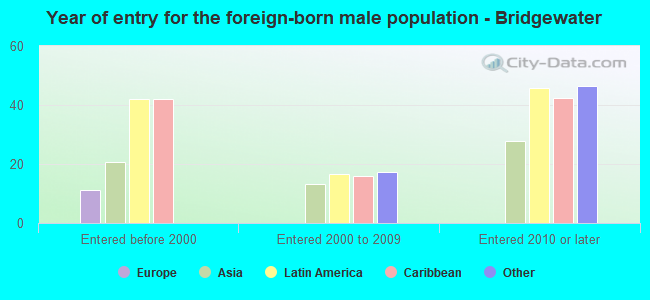
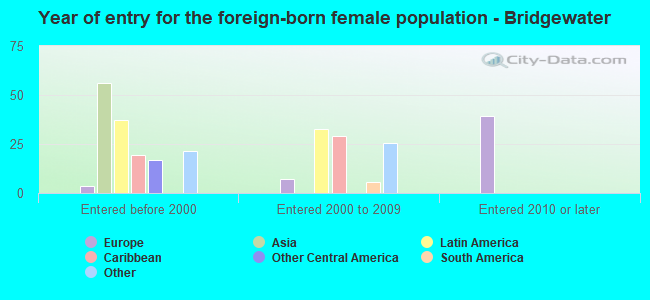
Foreign-born residents in Bridgewater
430 residents are foreign born (1.6% Latin America, 1.2% Asia, 0.9% Africa, 0.5% Europe).
| This city: | 4.5% |
| Massachusetts: | 100.0% |


Marital status for residents in Bridgewater
Marital status - White (Caucasian) population 15 years and over
- Males
- 65.6%Never married
- 23.7%Now married
- 2.3%Separated
- 1.3%Widowed
- 7.1%Divorced
- Females
- 65.6%Never married
- 21.2%Now married
- 0.0%Separated
- 6.3%Widowed
- 6.9%Divorced
Women who gave birth in the past 12 months
| Now married: | 0.0% (0) |
| Unmarried: | 100.0% (6) |
Women who did not give birth in the past 12 months
| Now married: | 15.9% (381) |
| Unmarried: | 84.1% (2,021) |
Marital status - Black or African American population 15 years and over
- Males
- 86.0%Never married
- 14.0%Now married
- 0.0%Separated
- 0.0%Widowed
- 0.0%Divorced
- Females
- 72.1%Never married
- 15.5%Now married
- 0.0%Separated
- 12.4%Widowed
- 0.0%Divorced
Women who gave birth in the past 12 months
| Now married: | 100.0% (28) |
| Unmarried: | 0.0% (0) |
Women who did not give birth in the past 12 months
| Now married: | 10.8% (37) |
| Unmarried: | 89.2% (302) |
Marital status - Asian population 15 years and over
- Males
- 70.2%Never married
- 29.8%Now married
- 0.0%Separated
- 0.0%Widowed
- 0.0%Divorced
- Females
- 16.7%Never married
- 83.3%Now married
- 0.0%Separated
- 0.0%Widowed
- 0.0%Divorced
Women who did not give birth in the past 12 months
| Now married: | 78.6% (50) |
| Unmarried: | 21.4% (14) |
Marital status - Other race population 15 years and over
- Males
- 82.1%Never married
- 17.9%Now married
- 0.0%Separated
- 0.0%Widowed
- 0.0%Divorced
- Females
- 100.0%Never married
- 0.0%Now married
- 0.0%Separated
- 0.0%Widowed
- 0.0%Divorced
Women who did not give birth in the past 12 months
| Now married: | 0.0% (0) |
| Unmarried: | 100.0% (110) |
Marital status - Two or more races population 15 years and over
- Males
- 80.5%Never married
- 3.4%Now married
- 0.0%Separated
- 0.0%Widowed
- 16.1%Divorced
- Females
- 100.0%Never married
- 0.0%Now married
- 0.0%Separated
- 0.0%Widowed
- 0.0%Divorced
Women who did not give birth in the past 12 months
| Now married: | 0.0% (0) |
| Unmarried: | 100.0% (386) |
Marital status - White alone, not Hispanic / Latino population 15 years and over
- Males
- 64.9%Never married
- 24.2%Now married
- 2.4%Separated
- 1.3%Widowed
- 7.3%Divorced
- Females
- 65.0%Never married
- 21.5%Now married
- 0.0%Separated
- 6.4%Widowed
- 7.0%Divorced
Women who gave birth in the past 12 months
| Now married: | 0.0% (0) |
| Unmarried: | 100.0% (6) |
Women who did not give birth in the past 12 months
| Now married: | 16.2% (392) |
| Unmarried: | 83.8% (2,024) |
Marital status - Hispanic or Latino population 15 years and over
- Males
- 91.7%Never married
- 8.3%Now married
- 0.0%Separated
- 0.0%Widowed
- 0.0%Divorced
- Females
- 100.0%Never married
- 0.0%Now married
- 0.0%Separated
- 0.0%Widowed
- 0.0%Divorced
Women who did not give birth in the past 12 months
| Now married: | 0.0% (0) |
| Unmarried: | 100.0% (170) |
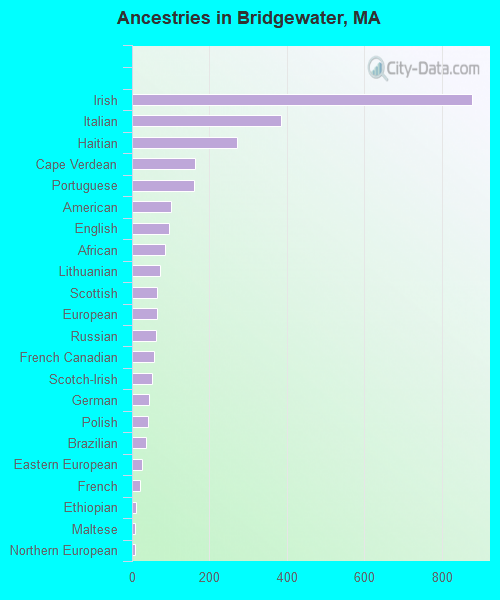
Ancestries in Bridgewater

- 87823.3%Irish
- 38610.2%Italian
- 2717.2%Haitian
- 1634.3%Cape Verdean
- 1594.2%Portuguese
- 1002.7%American
- 962.5%English
- 842.2%African
- 731.9%Lithuanian
- 651.7%Scottish
- 641.7%European
- 611.6%Russian
- 581.5%French Canadian
- 511.4%Scotch-Irish
- 441.2%German
- 411.1%Polish
- 350.9%Brazilian
- 270.7%Eastern European
- 210.6%French
- 100.3%Ethiopian
- 90.2%Maltese
- 90.2%Northern European
- 40.1%Armenian
- 30.08%Lebanese
- 30.08%Greek
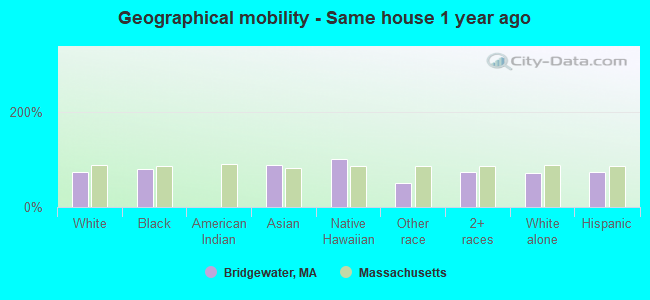
Geographical mobility in Bridgewater

- Same house 1 year ago
- 5,11572.8%White (Caucasian)
- 1,02280.0%Black or African American
- 16187.5%Asian
- 18100.0%Native Hawaiian / Pacific Islander
- 12850.4%Other race
- 53073.0%Two or more races
- 5,15172.5%White alone, not Hispanic / Latino
- 31972.9%Hispanic or Latino
-
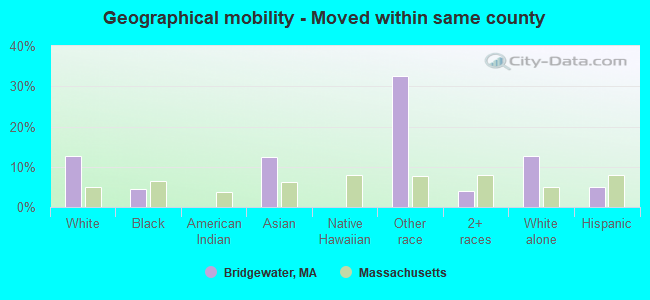
- Moved within same county
- 89312.7%White / Caucasian
- 574.5%Black or African American
- 2312.4%Asian
- 8232.4%Other race
- 304.1%Two or more races
- 89812.6%White alone, not Hispanic / Latino
- 225.0%Hispanic or Latino
-
- Moved within same state
- 92113.1%White / Caucasian
- 18114.1%Black or African American
- 15100.0%American Indian / Alaska Native
- 83.3%Other race
- 17424.0%Two or more races
- 93013.1%White alone, not Hispanic / Latino
- 7316.7%Hispanic or Latino

-
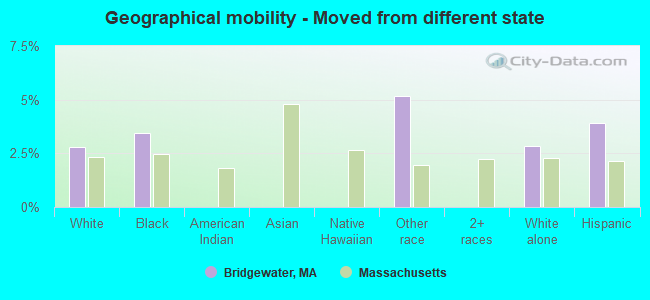
- Moved from different state
- 1972.8%White / Caucasian
- 443.5%Black or African American
- 135.2%Other race
- 2012.8%White alone, not Hispanic / Latino
- 173.9%Hispanic or Latino
-
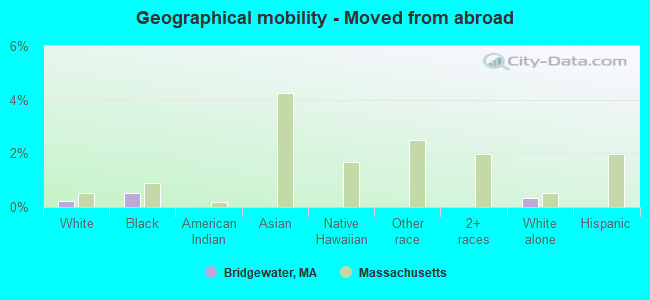
- Moved from abroad
- 160.2%White
- 60.5%Black or African American
- 230.3%White alone, not Hispanic / Latino
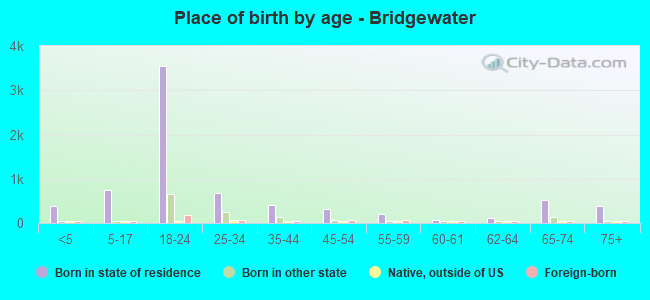
Children Nativity (place of birth) in Bridgewater
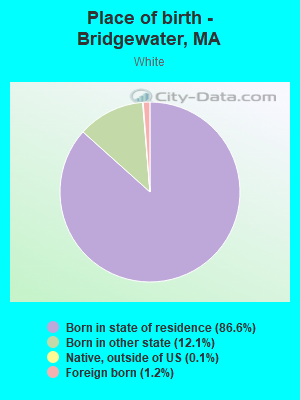
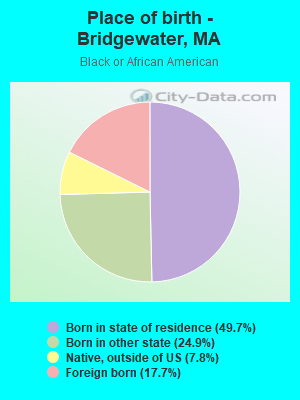
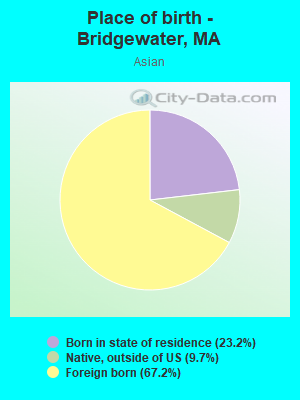
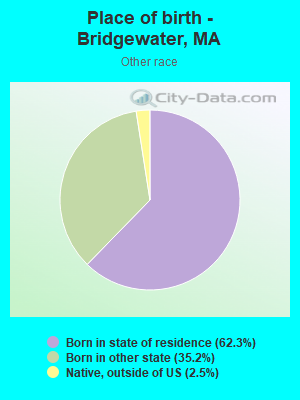
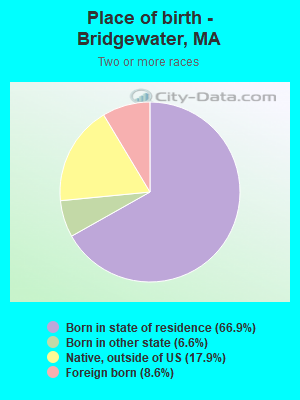
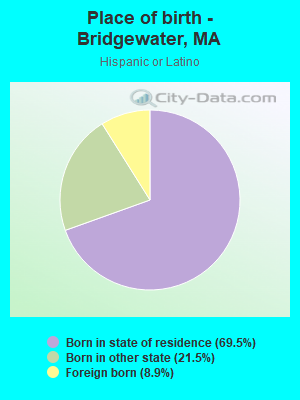
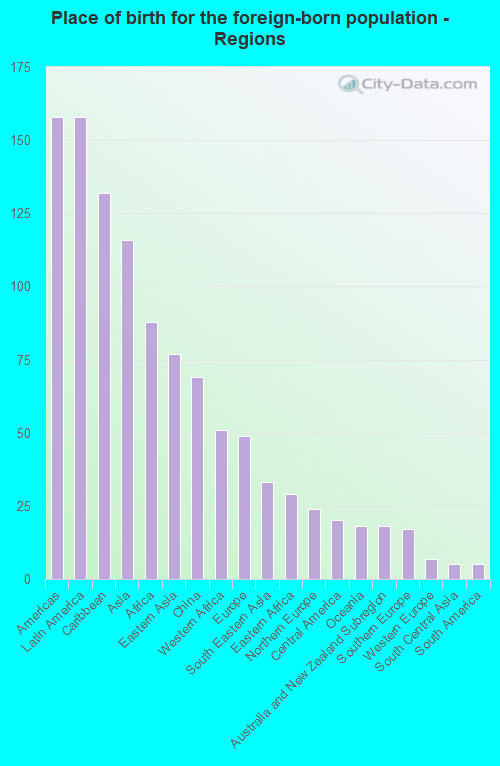
Place of birth for residents in Bridgewater
![Place of birth for the foreign-born population - Regions]()
- 158Americas
- 158Latin America
- 132Caribbean
- 116Asia
- 88Africa
- 77Eastern Asia
- 69China
- 51Western Africa
- 49Europe
- 33South Eastern Asia
- 29Eastern Africa
- 24Northern Europe
- 20Central America
- 18Oceania
- 18Australia and New Zealand Subregion
- 17Southern Europe
- 7Western Europe
- 5South Central Asia
- 5South America
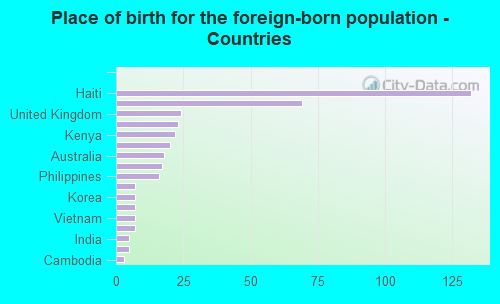
![Place of birth for the foreign-born population - Countries]()
- 132Haiti
- 69China
- 24United Kingdom
- 23Cabo Verde
- 22Kenya
- 20Guatemala
- 18Australia
- 17Portugal
- 16Philippines
- 7France
- 7Korea
- 7Thailand
- 7Vietnam
- 7Ethiopia
- 5India
- 5Venezuela
- 3Cambodia
Zip codes: 02324.