Races in Brockton, Massachusetts (MA) Detailed Stats
Data:
Races - White alone (%)
Races - White alone (% change since 2000)
Races - Black alone (%)
Races - Black alone (% change since 2000)
Races - American Indian alone (%)
Races - American Indian alone (% change since 2000)
Races - Asian alone (%)
Races - Asian alone (% change since 2000)
Races - Hispanic (%)
Races - Hispanic (% change since 2000)
Races - Native Hawaiian and Other Pacific Islander alone (%)
Races - Native Hawaiian and Other Pacific Islander alone (% change since 2000)
Races - Two or more races(%)
Races - Two or more races(% change since 2000)
Races - Other race alone (%)
Races - Other race alone (% change since 2000)
Racial diversity
Place of birth - Born in state of residence (%)
Place of birth - Born in state of residence (%) - White
Place of birth - Born in state of residence (%) - Black or African American
Place of birth - Born in state of residence (%) - Asian
Place of birth - Born in state of residence (%) - Hispanic or Latino
Place of birth - Born in state of residence (%) - American Indian and Alaska Native
Place of birth - Born in state of residence (%) - Multirace
Place of birth - Born in state of residence (%) - Other Race
Place of birth - Born in other state (%)
Place of birth - Born in other state (%) - White
Place of birth - Born in other state (%) - Black or African American
Place of birth - Born in other state (%) - Asian
Place of birth - Born in other state (%) - Hispanic or Latino
Place of birth - Born in other state (%) - American Indian and Alaska Native
Place of birth - Born in other state (%) - Multirace
Place of birth - Born in other state (%) - Other Race
Place of birth - Native, outside of US (%)
Place of birth - Native, outside of US (%) - White
Place of birth - Native, outside of US (%) - Black or African American
Place of birth - Native, outside of US (%) - Asian
Place of birth - Native, outside of US (%) - Hispanic or Latino
Place of birth - Native, outside of US (%) - American Indian and Alaska Native
Place of birth - Native, outside of US (%) - Multirace
Place of birth - Native, outside of US (%) - Other Race
Place of birth - Foreign born (%)
Place of birth - Foreign born (%) - White
Place of birth - Foreign born (%) - Black or African American
Place of birth - Foreign born (%) - Asian
Place of birth - Foreign born (%) - Hispanic or Latino
Place of birth - Foreign born (%) - American Indian and Alaska Native
Place of birth - Foreign born (%) - Multirace
Place of birth - Foreign born (%) - Other Race
Residents speaking English at home (%)
Residents speaking English at home - Born in the United States (%)
Residents speaking English at home - Native, born elsewhere (%)
Residents speaking English at home - Foreign born (%)
Residents speaking Spanish at home (%)
Residents speaking Spanish at home - Born in the United States (%)
Residents speaking Spanish at home - Native, born elsewhere (%)
Residents speaking Spanish at home - Foreign born (%)
Residents speaking other language at home (%)
Residents speaking other language at home - Born in the United States (%)
Residents speaking other language at home - Native, born elsewhere (%)
Residents speaking other language at home - Foreign born (%)
Marital status - Never married (%)
Marital status - Now married (%)
Marital status - Separated (%)
Marital status - Widowed (%)
Marital status - Divorced (%)
Ancestries Reported - Arab (%)
Ancestries Reported - Czech (%)
Ancestries Reported - Danish (%)
Ancestries Reported - Dutch (%)
Ancestries Reported - English (%)
Ancestries Reported - French (%)
Ancestries Reported - French Canadian (%)
Ancestries Reported - German (%)
Ancestries Reported - Greek (%)
Ancestries Reported - Hungarian (%)
Ancestries Reported - Irish (%)
Ancestries Reported - Italian (%)
Ancestries Reported - Lithuanian (%)
Ancestries Reported - Norwegian (%)
Ancestries Reported - Polish (%)
Ancestries Reported - Portuguese (%)
Ancestries Reported - Russian (%)
Ancestries Reported - Scotch-Irish (%)
Ancestries Reported - Scottish (%)
Ancestries Reported - Slovak (%)
Ancestries Reported - Subsaharan African (%)
Ancestries Reported - Swedish (%)
Ancestries Reported - Swiss (%)
Ancestries Reported - Ukrainian (%)
Ancestries Reported - United States (%)
Ancestries Reported - Welsh (%)
Ancestries Reported - West Indian (%)
Ancestries Reported - Other (%)
Geographical mobility - Same house 1 year ago (%)
Geographical mobility - Same house 1 year ago (%) - White
Geographical mobility - Same house 1 year ago (%) - Black or African American
Geographical mobility - Same house 1 year ago (%) - Asian
Geographical mobility - Same house 1 year ago (%) - Hispanic or Latino
Geographical mobility - Same house 1 year ago (%) - American Indian and Alaska Native
Geographical mobility - Same house 1 year ago (%) - Multirace
Geographical mobility - Same house 1 year ago (%) - Other Race
Geographical mobility - Moved within same county (%)
Geographical mobility - Moved within same county (%) - White
Geographical mobility - Moved within same county (%) - Black or African American
Geographical mobility - Moved within same county (%) - Asian
Geographical mobility - Moved within same county (%) - Hispanic or Latino
Geographical mobility - Moved within same county (%) - American Indian and Alaska Native
Geographical mobility - Moved within same county (%) - Multirace
Geographical mobility - Moved within same county (%) - Other Race
Geographical mobility - Moved from different county within same state (%)
Geographical mobility - Moved from different county within same state (%) - White
Geographical mobility - Moved from different county within same state (%) - Black or African American
Geographical mobility - Moved from different county within same state (%) - Asian
Geographical mobility - Moved from different county within same state (%) - Hispanic or Latino
Geographical mobility - Moved from different county within same state (%) - American Indian and Alaska Native
Geographical mobility - Moved from different county within same state (%) - Multirace
Geographical mobility - Moved from different county within same state (%) - Other Race
Geographical mobility - Moved from different state (%)
Geographical mobility - Moved from different state (%) - White
Geographical mobility - Moved from different state (%) - Black or African American
Geographical mobility - Moved from different state (%) - Asian
Geographical mobility - Moved from different state (%) - Hispanic or Latino
Geographical mobility - Moved from different state (%) - American Indian and Alaska Native
Geographical mobility - Moved from different state (%) - Multirace
Geographical mobility - Moved from different state (%) - Other Race
Geographical mobility - Moved from abroad (%)
Geographical mobility - Moved from abroad (%) - White
Geographical mobility - Moved from abroad (%) - Black or African American
Geographical mobility - Moved from abroad (%) - Asian
Geographical mobility - Moved from abroad (%) - Hispanic or Latino
Geographical mobility - Moved from abroad (%) - American Indian and Alaska Native
Geographical mobility - Moved from abroad (%) - Multirace
Geographical mobility - Moved from abroad (%) - Other Race
Place of birth for the foreign-born population - Ireland (%)
Place of birth for the foreign-born population - Denmark (%)
Place of birth for the foreign-born population - Norway (%)
Place of birth for the foreign-born population - Sweden (%)
Place of birth for the foreign-born population - United Kingdom (%)
Place of birth for the foreign-born population - England (%)
Place of birth for the foreign-born population - Scotland (%)
Place of birth for the foreign-born population - Other Northern Europe (%)
Place of birth for the foreign-born population - Austria (%)
Place of birth for the foreign-born population - Belgium (%)
Place of birth for the foreign-born population - France (%)
Place of birth for the foreign-born population - Germany (%)
Place of birth for the foreign-born population - Netherlands (%)
Place of birth for the foreign-born population - Switzerland (%)
Place of birth for the foreign-born population - Other Western Europe (%)
Place of birth for the foreign-born population - Greece (%)
Place of birth for the foreign-born population - Italy (%)
Place of birth for the foreign-born population - Portugal (%)
Place of birth for the foreign-born population - Spain (%)
Place of birth for the foreign-born population - Other Southern Europe (%)
Place of birth for the foreign-born population - Albania (%)
Place of birth for the foreign-born population - Belarus (%)
Place of birth for the foreign-born population - Bosnia and Herzegovina (%)
Place of birth for the foreign-born population - Bulgaria (%)
Place of birth for the foreign-born population - Croatia (%)
Place of birth for the foreign-born population - Czechoslovakia (%)
Place of birth for the foreign-born population - Hungary (%)
Place of birth for the foreign-born population - Latvia (%)
Place of birth for the foreign-born population - Lithuania (%)
Place of birth for the foreign-born population - North Macedonia (Macedonia) (%)
Place of birth for the foreign-born population - Moldova (%)
Place of birth for the foreign-born population - Poland (%)
Place of birth for the foreign-born population - Romania (%)
Place of birth for the foreign-born population - Russia (%)
Place of birth for the foreign-born population - Serbia (%)
Place of birth for the foreign-born population - Ukraine (%)
Place of birth for the foreign-born population - Other Eastern Europe (%)
Place of birth for the foreign-born population - China (%)
Place of birth for the foreign-born population - Hong Kong (%)
Place of birth for the foreign-born population - Taiwan (%)
Place of birth for the foreign-born population - Japan (%)
Place of birth for the foreign-born population - Korea (%)
Place of birth for the foreign-born population - Other Eastern Asia (%)
Place of birth for the foreign-born population - Afghanistan (%)
Place of birth for the foreign-born population - Bangladesh (%)
Place of birth for the foreign-born population - India (%)
Place of birth for the foreign-born population - Iran (%)
Place of birth for the foreign-born population - Kazakhstan (%)
Place of birth for the foreign-born population - Nepal (%)
Place of birth for the foreign-born population - Pakistan (%)
Place of birth for the foreign-born population - Sri Lanka (%)
Place of birth for the foreign-born population - Uzbekistan (%)
Place of birth for the foreign-born population - Other South Central Asia (%)
Place of birth for the foreign-born population - Burma (%)
Place of birth for the foreign-born population - Cambodia (%)
Place of birth for the foreign-born population - Indonesia (%)
Place of birth for the foreign-born population - Laos (%)
Place of birth for the foreign-born population - Malaysia (%)
Place of birth for the foreign-born population - Philippines (%)
Place of birth for the foreign-born population - Singapore (%)
Place of birth for the foreign-born population - Thailand (%)
Place of birth for the foreign-born population - Vietnam (%)
Place of birth for the foreign-born population - Other South Eastern Asia (%)
Place of birth for the foreign-born population - Armenia (%)
Place of birth for the foreign-born population - Iraq (%)
Place of birth for the foreign-born population - Israel (%)
Place of birth for the foreign-born population - Jordan (%)
Place of birth for the foreign-born population - Kuwait (%)
Place of birth for the foreign-born population - Lebanon (%)
Place of birth for the foreign-born population - Saudi Arabia (%)
Place of birth for the foreign-born population - Syria (%)
Place of birth for the foreign-born population - Turkey (%)
Place of birth for the foreign-born population - Yemen (%)
Place of birth for the foreign-born population - Other Western Asia (%)
Place of birth for the foreign-born population - Eritrea (%)
Place of birth for the foreign-born population - Ethiopia (%)
Place of birth for the foreign-born population - Kenya (%)
Place of birth for the foreign-born population - Somalia (%)
Place of birth for the foreign-born population - Uganda (%)
Place of birth for the foreign-born population - Zimbabwe (%)
Place of birth for the foreign-born population - Other Eastern Africa (%)
Place of birth for the foreign-born population - Cameroon (%)
Place of birth for the foreign-born population - Congo (%)
Place of birth for the foreign-born population - Democratic Republic of Congo (Zaire) (%)
Place of birth for the foreign-born population - Other Middle Africa (%)
Place of birth for the foreign-born population - Egypt (%)
Place of birth for the foreign-born population - Morocco (%)
Place of birth for the foreign-born population - Sudan (%)
Place of birth for the foreign-born population - Other Northern Africa (%)
Place of birth for the foreign-born population - South Africa (%)
Place of birth for the foreign-born population - Other Southern Africa (%)
Place of birth for the foreign-born population - Cabo Verde (%)
Place of birth for the foreign-born population - Ghana (%)
Place of birth for the foreign-born population - Liberia (%)
Place of birth for the foreign-born population - Nigeria (%)
Place of birth for the foreign-born population - Senegal (%)
Place of birth for the foreign-born population - Sierra Leone (%)
Place of birth for the foreign-born population - Other Western Africa (%)
Place of birth for the foreign-born population - Australia (%)
Place of birth for the foreign-born population - New Zealand (%)
Place of birth for the foreign-born population - Fiji (%)
Place of birth for the foreign-born population - Micronesia (%)
Place of birth for the foreign-born population - Bahamas (%)
Place of birth for the foreign-born population - Barbados (%)
Place of birth for the foreign-born population - Cuba (%)
Place of birth for the foreign-born population - Dominica (%)
Place of birth for the foreign-born population - Dominican Republic (%)
Place of birth for the foreign-born population - Grenada (%)
Place of birth for the foreign-born population - Haiti (%)
Place of birth for the foreign-born population - Jamaica (%)
Place of birth for the foreign-born population - St. Vincent and the Grenadines (%)
Place of birth for the foreign-born population - Trinidad and Tobago (%)
Place of birth for the foreign-born population - West Indies (%)
Place of birth for the foreign-born population - Other Caribbean (%)
Place of birth for the foreign-born population - Belize (%)
Place of birth for the foreign-born population - Costa Rica (%)
Place of birth for the foreign-born population - El Salvador (%)
Place of birth for the foreign-born population - Guatemala (%)
Place of birth for the foreign-born population - Honduras (%)
Place of birth for the foreign-born population - Mexico (%)
Place of birth for the foreign-born population - Nicaragua (%)
Place of birth for the foreign-born population - Panama (%)
Place of birth for the foreign-born population - Other Central America (%)
Place of birth for the foreign-born population - Argentina (%)
Place of birth for the foreign-born population - Bolivia (%)
Place of birth for the foreign-born population - Brazil (%)
Place of birth for the foreign-born population - Chile (%)
Place of birth for the foreign-born population - Colombia (%)
Place of birth for the foreign-born population - Ecuador (%)
Place of birth for the foreign-born population - Guyana (%)
Place of birth for the foreign-born population - Peru (%)
Place of birth for the foreign-born population - Uruguay (%)
Place of birth for the foreign-born population - Venezuela (%)
Place of birth for the foreign-born population - Other South America (%)
Place of birth for the foreign-born population - Canada (%)
Place of birth for the foreign-born population - Other Northern America (%)
Place of birth for the foreign-born population - Other (%)
Latest news about races in Brockton, MA collected exclusively by city-data.com from local newspapers, TV, and radio stations
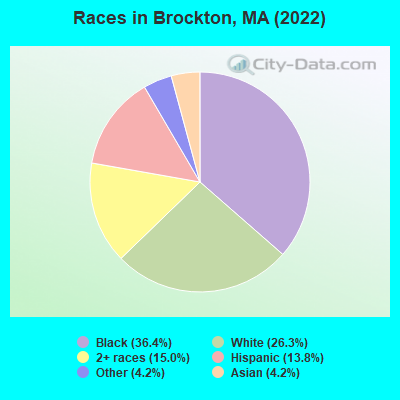
According to 2022 data, the most numerous races in Brockton, MA are White alone (27,596 residents), Hispanic (14,442 residents), and Asian alone (4,413 residents). 53.9% of Brockton residents speak English at home. 32.9% of Brockton, MA residents are foreign-born (16.6% born in Latin America, 13.0% born in Africa), which is 45.3% greater than the foreign-born rate of 18.0% across the entire state of Massachusetts.
Race distribution in Brockton
2000 2022
54,902 58.2% White alone 15,913 16.9% Black alone 7,552 8.0% Hispanic 6,971 7.4% Other race alone 6,619 7.0% Two or more races 2,044 2.2% Asian alone 276 0.3% American Indian alone 27 0.03% Native Hawaiian and Other
38,163 36.4% Black alone 27,596 26.3% White alone 15,704 15.0% Two or more races 14,442 13.8% Hispanic 4,413 4.2% Asian alone 4,424 4.2% Other race alone 59 0.06% Native Hawaiian and Other 32 0.03% American Indian alone
2000 2022
5,198,359 81.9% White alone 428,729 6.8% Hispanic 318,329 5.0% Black alone 236,786 3.7% Asian alone 110,338 1.7% Two or more races 43,586 0.7% Other race alone 11,264 0.2% American Indian alone 1,706 0.03% Native Hawaiian and Other
4,676,627 67.0% White alone 911,038 13.0% Hispanic 501,463 7.2% Asian alone 459,740 6.6% Black alone 341,889 4.9% Two or more races 84,403 1.2% Other race alone 5,838 0.08% American Indian alone 976 0.01% Native Hawaiian and Other
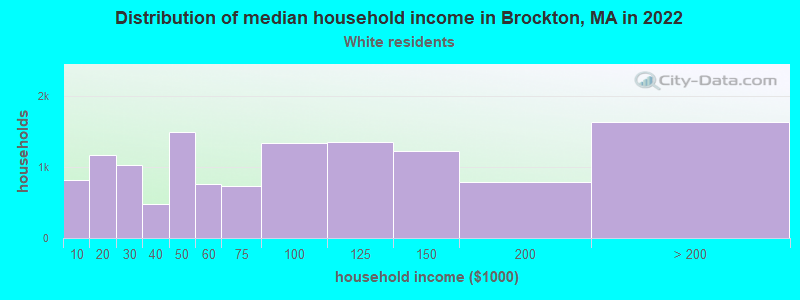
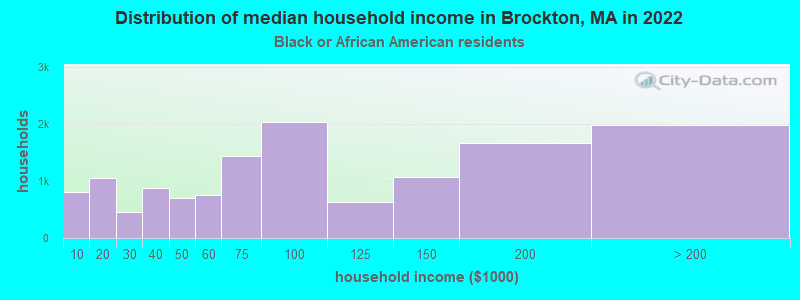
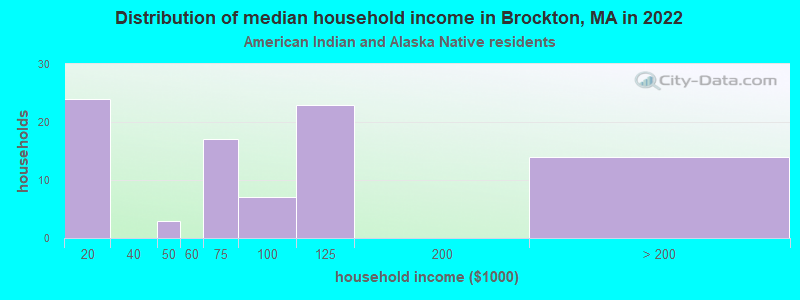
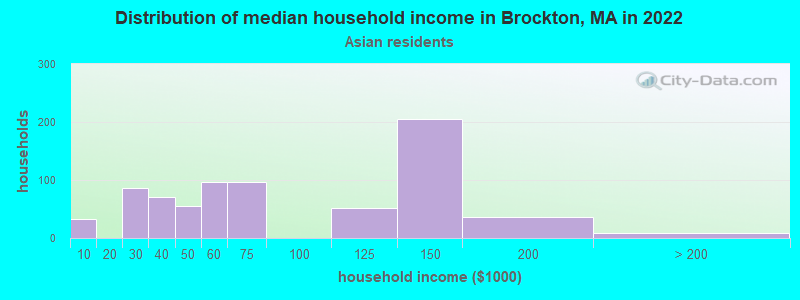
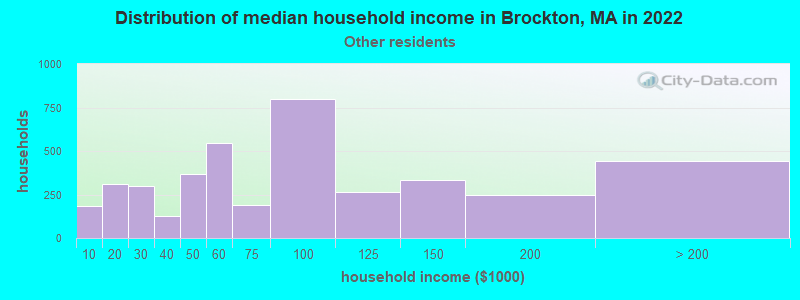
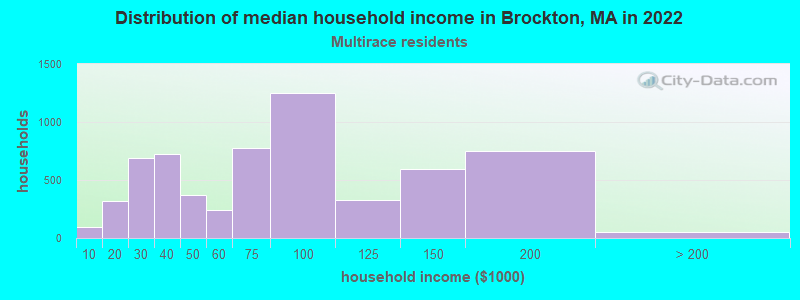
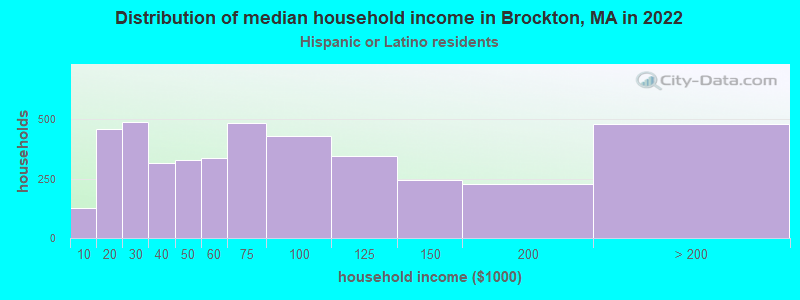
Income and house value in Brockton Median household income in 2022 $74,000 White non-Hispanic householders$83,332 Black householders$61,300 Asian householders$56,806 Some other race householders$73,171 Two or more races householders$59,811 Hispanic or Latino race householdersMedian 2022 house value $426,497 White Non-Hispanic householders$455,875 Black or African American householders$455,875 American Indian or Alaska Native householders $482,215 Asian householders$464,317 Native Hawaiian and other Pacific Islander householders$474,786 Some other race householders$450,135 Two or more races householders$441,017 Hispanic or Latino householders
Median age by race in Brockton
56.0 Median age for White residents54.8 56.5 35.6 Median age for Black or African American residents36.2 35.3 -666,666,666.0 Median age for American Indian / Alaska Native residents-666,666,666.0 -666,666,666.0 40.2 Median age for Asian residents40.7 39.0 -666,666,666.0 Median age for Native Hawaiian / Pacific Islander residents-666,666,666.0 -666,666,666.0 38.4 Median age for Other race residents32.3 41.2 26.6 Median age for Two or more races residents25.0 29.9 56.2 Median age for White alone residents55.0 56.6 29.7 Median age for Hispanic or Latino residents27.2 29.9
Owner/renter occupied households by race in Brockton
House owners and renters - White residents 9,316 72.7% Owner occupied3,490 27.3% Renter occupiedHouse owners and renters - Black or African American residents 6,483 48.1% Owner occupied6,994 51.9% Renter occupiedHouse owners and renters - American Indian / Alaska Native residents 30 32.7% Owner occupied63 67.3% Renter occupiedHouse owners and renters - Asian residents 1,277 86.7% Owner occupied196 13.3% Renter occupiedHouse owners and renters - Other race residents 1,712 38.1% Owner occupied2,777 61.9% Renter occupiedHouse owners and renters - Two or more races residents 2,560 41.4% Owner occupied3,622 58.6% Renter occupiedHouse owners and renters - White alone residents 9,316 73.7% Owner occupied3,316 26.3% Renter occupiedHouse owners and renters - Hispanic or Latino residents 1,978 47.3% Owner occupied2,200 52.7% Renter occupied
Language usage in Brockton
English speakers - Total 53.9% of residents of Brockton speak English at home.
9.7% of residents speak Spanish at home 6,118 63.7% Speak English very well3,489 36.3% Speak English less than very well36.4% of residents speak other language at home 18,853 52.6% Speak English very well16,970 47.4% Speak English less than very well
English speakers - Born in the United States 81.5% of residents of Brockton speak English at home.
10.7% of residents speak Spanish at home 897 87.9% Speak English very well124 12.1% Speak English less than very well7.8% of residents speak other language at home 426 57.1% Speak English very well320 42.9% Speak English less than very well
English speakers - Native, born elsewhere 16.4% of residents of Brockton speak English at home.
55.8% of residents speak Spanish at home 1,314 59.8% Speak English very well882 40.2% Speak English less than very well27.8% of residents speak other language at home 450 41.1% Speak English very well644 58.9% Speak English less than very well
English speakers - Foreign-born 11.9% of residents of Brockton speak English at home.
10.6% of residents speak Spanish at home 1,223 34.0% Speak English very well2,379 66.0% Speak English less than very well77.5% of residents speak other language at home 12,899 48.8% Speak English very well13,526 51.2% Speak English less than very well
White (Caucasian) - Speak only English Native:
95.9% (25,346)Foreign-born:
22.9% (288)
White (Caucasian) - Speak another language Native:
4.1% (1,097)Foreign-born:
77.1% (967)
Black or African American - Speak only English Native:
78.8% (16,193)Foreign-born:
12.9% (2,046)
Black or African American - Speak another language Native:
21.2% (4,364)Foreign-born:
87.1% (13,815)
American Indian / Alaska Native - Speak another language Native:
56.6% (80)Foreign-born:
100.0% (11)
Asian - Speak only English Native:
32.5% (606)Foreign-born:
18.9% (482)
Asian - Speak another language Native:
67.5% (1,256)Foreign-born:
81.1% (2,069)
Other race - Speak only English Native:
26.4% (1,429)Foreign-born:
11.4% (540)
Other race - Speak another language Native:
73.6% (3,978)Foreign-born:
88.6% (4,208)
Two or more races - Speak only English Native:
54.3% (5,486)Foreign-born:
7.2% (699)
Two or more races - Speak another language Native:
45.7% (4,619)Foreign-born:
92.8% (8,944)
White alone - Speak only English Native:
96.8% (25,306)Foreign-born:
25.3% (288)
White alone - Speak another language Native:
3.2% (842)Foreign-born:
74.7% (850)
Hispanic or Latino - Speak only English Native:
33.8% (2,894)Foreign-born:
3.6% (149)
Hispanic or Latino - Speak another language Native:
66.2% (5,666)Foreign-born:
96.4% (3,982)
Foreign-born residents in Brockton 34,667 residents are foreign born (16.6% Latin America , 13.0% Africa ).
This city:
32.9%Massachusetts:
17.6%
Marital status for residents in Brockton Marital status - White (Caucasian) population 15 years and over
Males 34.9% Never married47.3% Now married3.5% Separated2.2% Widowed12.0% DivorcedFemales 41.5% Never married37.1% Now married0.3% Separated7.5% Widowed13.7% DivorcedWomen who gave birth in the past 12 months Now married:
63.1% (201)Unmarried:
36.9% (117)
Women who did not give birth in the past 12 months Now married:
32.3% (2,163)Unmarried:
67.7% (4,535)
Marital status - Black or African American population 15 years and over
Males 42.3% Never married44.9% Now married8.4% Separated0.1% Widowed4.3% DivorcedFemales 44.1% Never married35.3% Now married3.5% Separated8.3% Widowed8.7% DivorcedWomen who gave birth in the past 12 months Now married:
55.8% (322)Unmarried:
44.2% (255)
Women who did not give birth in the past 12 months Now married:
34.6% (3,126)Unmarried:
65.4% (5,918)
Marital status - American Indian / Alaska Native population 15 years and over
Males 40.3% Never married0.0% Now married38.8% Separated9.0% Widowed11.9% DivorcedFemales 50.0% Never married0.0% Now married26.0% Separated0.0% Widowed24.0% DivorcedWomen who did not give birth in the past 12 months Now married:
0.0% (0)Unmarried:
100.0% (12)
Marital status - Asian population 15 years and over
Males 42.8% Never married52.1% Now married1.5% Separated1.4% Widowed2.2% DivorcedFemales 25.1% Never married68.5% Now married2.1% Separated3.2% Widowed1.1% DivorcedWomen who gave birth in the past 12 months Now married:
0.0% (0)Unmarried:
100.0% (2)
Women who did not give birth in the past 12 months Now married:
60.7% (320)Unmarried:
39.3% (207)
Marital status - Other race population 15 years and over
Males 38.4% Never married46.7% Now married0.0% Separated3.8% Widowed11.2% DivorcedFemales 36.4% Never married31.4% Now married7.8% Separated5.7% Widowed18.8% DivorcedWomen who gave birth in the past 12 months Now married:
100.0% (157)Unmarried:
0.0% (0)
Women who did not give birth in the past 12 months Now married:
21.8% (594)Unmarried:
78.2% (2,129)
Marital status - Two or more races population 15 years and over
Males 50.3% Never married39.7% Now married3.9% Separated0.8% Widowed5.3% DivorcedFemales 49.1% Never married36.6% Now married1.0% Separated4.5% Widowed8.8% DivorcedWomen who gave birth in the past 12 months Now married:
80.3% (173)Unmarried:
19.7% (43)
Women who did not give birth in the past 12 months Now married:
35.5% (2,132)Unmarried:
64.5% (3,873)
Marital status - White alone, not Hispanic / Latino population 15 years and over
Males 34.6% Never married47.5% Now married3.6% Separated2.2% Widowed12.1% DivorcedFemales 41.3% Never married37.0% Now married0.3% Separated7.6% Widowed13.9% DivorcedWomen who gave birth in the past 12 months Now married:
79.0% (160)Unmarried:
21.0% (42)
Women who did not give birth in the past 12 months Now married:
31.8% (1,902)Unmarried:
68.2% (4,085)
Marital status - Hispanic or Latino population 15 years and over
Males 47.8% Never married42.7% Now married0.0% Separated2.8% Widowed6.7% DivorcedFemales 47.0% Never married34.9% Now married1.1% Separated1.8% Widowed15.2% DivorcedWomen who gave birth in the past 12 months Now married:
28.8% (95)Unmarried:
71.2% (234)
Women who did not give birth in the past 12 months Now married:
33.3% (1,183)Unmarried:
66.7% (2,367)
Ancestries in Brockton
14,375 22.0% Cape Verdean12,579 19.3% Haitian3,875 5.9% Irish2,081 3.2% Italian1,697 2.6% American1,062 1.6% Portuguese946 1.5% English754 1.2% Kenyan731 1.1% Brazilian700 1.1% Jamaican654 1.0% African392 0.6% French Canadian358 0.5% Swedish355 0.5% Trinidadian and Tobagonian323 0.5% German308 0.5% Nigerian294 0.5% Greek285 0.4% Polish273 0.4% French229 0.4% Scottish213 0.3% Barbadian207 0.3% European173 0.3% Guyanese143 0.2% Lithuanian107 0.2% British West Indian97 0.1% Armenian79 0.1% Scotch-Irish68 0.1% Finnish63 0.10% Canadian63 0.10% Russian52 0.08% Moroccan51 0.08% Albanian41 0.06% Hungarian36 0.06% Syrian33 0.05% Ghanaian30 0.05% Liberian30 0.05% Lebanese25 0.04% West Indian24 0.04% Austrian24 0.04% Eastern European24 0.04% British17 0.03% Ethiopian17 0.03% Celtic16 0.02% Ukrainian15 0.02% Ugandan12 0.02% Sierra Leonean11 0.02% Somali9 0.01% Northern European
Geographical mobility in Brockton Same house 1 year ago 26,209 93.6% White (Caucasian)34,191 86.6% Black or African American162 92.6% American Indian / Alaska Native1,926 96.6% Asian91 100.0% Native Hawaiian / Pacific Islander9,281 81.3% Other race18,488 87.3% Two or more races25,840 93.6% White alone, not Hispanic / Latino12,467 88.3% Hispanic or LatinoMoved within same county 766 2.7% White / Caucasian2,966 7.5% Black or African American26 1.3% Asian565 5.0% Other race1,129 5.3% Two or more races766 2.8% White alone, not Hispanic / Latino1,031 7.3% Hispanic or LatinoMoved within same state 884 3.2% White / Caucasian2,091 5.3% Black or African American27 1.3% Asian367 3.2% Other race849 4.0% Two or more races841 3.0% White alone, not Hispanic / Latino131 0.9% Hispanic or LatinoMoved from different state 149 0.5% White / Caucasian2 0.0% Other race149 0.5% White alone, not Hispanic / LatinoMoved from abroad 215 0.5% Black or African American19 10.9% American Indian / Alaska Native127 1.1% Other race704 3.3% Two or more races495 3.5% Hispanic or Latino
Children Nativity (place of birth) in Brockton
Children under 6 years - Living with two parents Both parents native 497 100.0% NativeBoth parents foreign-born 2,042 100.0% NativeOne native, one foreign-born parent 1,269 100.0% NativeChildren under 6 years - Living with one parent Native parent 1,890 100.0% NativeForeign-born parent 913 67.3% Native443 32.7% Foreign-bornChildren 6 to 17 years - Living with two parents Both parents native 1,420 100.0% NativeBoth parents foreign-born 3,552 86.7% Native543 13.3% Foreign-bornOne native, one foreign-born parent 1,217 94.9% Native65 5.1% Foreign-bornChildren 6 to 17 years - Living with one parent Native parent 2,357 100.0% NativeForeign-born parent 3,545 61.5% Native2,221 38.5% Foreign-born
Place of birth for residents in Brockton 17,938 Americas17,797 Latin America13,966 Caribbean13,919 Africa12,925 Western Africa2,727 South America1,450 Asia1,357 Europe1,104 Central America897 South Eastern Asia780 Southern Europe493 Eastern Africa417 Middle Africa403 Eastern Asia360 Northern Europe339 China141 Northern America125 South Central Asia112 Western Europe103 Eastern Europe32 Northern Africa27 Southern Africa24 Western Asia12,261 Cabo Verde11,582 Haiti1,073 Ecuador872 Brazil863 Jamaica687 Dominican Republic594 Vietnam497 Nigeria480 Honduras439 Portugal400 Colombia397 Kenya277 Trinidad and Tobago269 Hong Kong255 Guatemala215 Ireland203 Cameroon189 Barbados175 El Salvador173 Peru150 Greece141 Canada123 Cambodia120 Spain92 Venezuela84 Philippines76 United Kingdom73 Mexico71 Chile71 Thailand70 India70 Italy69 Germany66 Costa Rica64 Dominica58 Senegal54 Uganda52 Cuba49 England42 Nicaragua41 China35 Russia34 Korea33 Albania33 Azores Islands32 Morocco32 Liberia32 Lithuania30 Sierra Leone28 Japan28 Taiwan27 South Africa27 Nepal26 Pakistan25 Guyana24 United Arab Emirates24 Laos22 Austria20 France18 Scotland16 West Indies14 Ethiopia14 Ivory Coast10 Panama9 Zimbabwe5 Ghana1 Poland
Grandparents responsible for own grandchildren in Brockton
Grandparents (30 to 59 years) White / Caucasian 46 9.7% Responsible for grandchildren433 90.3% Not responsible for grandchildrenBlack or African American 136 30.7% Responsible for grandchildren308 69.3% Not responsible for grandchildrenOther race 9 3.3% Responsible for grandchildren257 96.7% Not responsible for grandchildrenTwo or more races 49 74.4% Responsible for grandchildren17 25.6% Not responsible for grandchildrenWhite alone, not Hispanic / Latino 35 8.5% Responsible for grandchildren376 91.5% Not responsible for grandchildrenHispanic or Latino 28 17.7% Responsible for grandchildren129 82.3% Not responsible for grandchildrenGrandparents (60 years and over) White / Caucasian 93 28.2% Responsible for grandchildren236 71.8% Not responsible for grandchildrenBlack or African American 296 36.9% Responsible for grandchildren506 63.1% Not responsible for grandchildrenOther race 82 25.6% Responsible for grandchildren238 74.4% Not responsible for grandchildrenTwo or more races 92 28.7% Responsible for grandchildren228 71.3% Not responsible for grandchildrenWhite alone, not Hispanic / Latino 93 34.2% Responsible for grandchildren178 65.8% Not responsible for grandchildrenHispanic or Latino 195 100.0% Not responsible for grandchildren