Races in Easthampton, Massachusetts (MA) Detailed Stats
Ancestries, Foreign-born residents, place of birth

Recent posts about races in Easthampton, Massachusetts on our local forum with over 2,400,000 registered users:
 | 2024 Real Estate Observations (909 replies) |
| Oklahoma to (likely Western) Massachusetts - Beginning Research (274 replies) |
| Am I crazy for excluding MA homes in my home search because they don't have air conditioning? (80 replies) |
| Coronavirus in Massachusetts (18048 replies) |
| Good and affordable Western Mass school districts? Where should we live? (37 replies) |
| Nice Neighborhoods Near Springfield (108 replies) |
Latest news about races in Easthampton, MA collected exclusively by city-data.com from local newspapers, TV, and radio stations
4.1% of Easthampton, MA residents are foreign-born (1.6% born in Europe, 1.0% born in Asia, 0.8% born in North America, 0.7% born in Latin America), which is 336.2% less than the foreign-born rate of 18.0% across the entire state of Massachusetts.
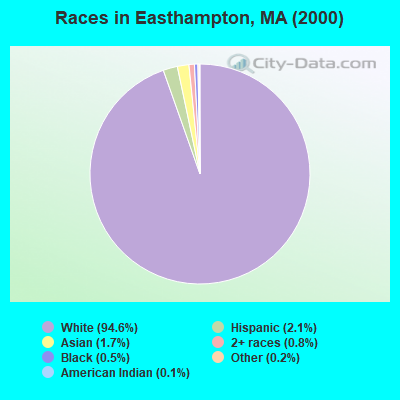
Race distribution in Easthampton

- 15,12594.6%White alone
- 3362.1%Hispanic
- 2751.7%Asian alone
- 1270.8%Two or more races
- 860.5%Black alone
- 250.2%Other race alone
- 190.1%American Indian alone
- 10.01%Native Hawaiian and Other
Pacific Islander alone
2000
2022
-
- 5,198,35981.9%White alone
- 428,7296.8%Hispanic
- 318,3295.0%Black alone
- 236,7863.7%Asian alone
- 110,3381.7%Two or more races
- 43,5860.7%Other race alone
- 11,2640.2%American Indian alone
- 1,7060.03%Native Hawaiian and Other
Pacific Islander alone

-
- 4,676,62767.0%White alone
- 911,03813.0%Hispanic
- 501,4637.2%Asian alone
- 459,7406.6%Black alone
- 341,8894.9%Two or more races
- 84,4031.2%Other race alone
- 5,8380.08%American Indian alone
- 9760.01%Native Hawaiian and Other
Pacific Islander alone

Income and house value in Easthampton
- Median household income in 2022
- $82,761White non-Hispanic householders
- $45,857Black householders
- $84,035Asian householders
- $95,629Some other race householders
- $45,025Two or more races householders
- $79,950Hispanic or Latino race householders
- Median 2022 house value
- $320,961White Non-Hispanic householders
- $292,373American Indian or Alaska Native householders
- $357,345Asian householders
- $258,068Some other race householders
- $273,921Two or more races householders
- $255,469Hispanic or Latino householders
Household income for White non-Hispanic householders

Household income for Black householders

Household income for American Indian and Alaska Native householders

Household income for Asian householders

Household income for Two or more races householders

Household income for Hispanic or Latino race householders

Foreign-born residents in Easthampton
660 residents are foreign born (1.6% Europe, 1.0% Asia, 0.8% North America, 0.7% Latin America).
| This city: | 4.1% |
| Massachusetts: | 12.2% |
Ancestries in Easthampton

- 3,59117.9%Polish
- 3,09615.4%French
- 2,91714.5%Irish
- 2,01310.0%French Canadian
- 1,5417.7%Other
- 1,5067.5%German
- 1,5047.5%English
- 1,1225.6%Italian
- 8554.3%United States
- 3741.9%Scottish
- 2671.3%Scotch-Irish
- 2281.1%Swedish
- 2121.1%Dutch
- 1830.9%Lithuanian
- 1120.6%Russian
- 1090.5%Ukrainian
- 1040.5%Czech
- 630.3%Portuguese
- 540.3%Welsh
- 530.3%Danish
- 340.2%West Indian
- 320.2%Hungarian
- 320.2%Norwegian
- 300.1%Greek
- 250.1%Swiss
- 180.09%Arab
- 110.05%Slovak
- 60.03%Subsaharan African

Zip codes: 01027.