Races in Everett, Massachusetts (MA) Detailed Stats
Data:
Races - White alone (%)
Races - White alone (% change since 2000)
Races - Black alone (%)
Races - Black alone (% change since 2000)
Races - American Indian alone (%)
Races - American Indian alone (% change since 2000)
Races - Asian alone (%)
Races - Asian alone (% change since 2000)
Races - Hispanic (%)
Races - Hispanic (% change since 2000)
Races - Native Hawaiian and Other Pacific Islander alone (%)
Races - Native Hawaiian and Other Pacific Islander alone (% change since 2000)
Races - Two or more races(%)
Races - Two or more races(% change since 2000)
Races - Other race alone (%)
Races - Other race alone (% change since 2000)
Racial diversity
Place of birth - Born in state of residence (%)
Place of birth - Born in state of residence (%) - White
Place of birth - Born in state of residence (%) - Black or African American
Place of birth - Born in state of residence (%) - Asian
Place of birth - Born in state of residence (%) - Hispanic or Latino
Place of birth - Born in state of residence (%) - American Indian and Alaska Native
Place of birth - Born in state of residence (%) - Multirace
Place of birth - Born in state of residence (%) - Other Race
Place of birth - Born in other state (%)
Place of birth - Born in other state (%) - White
Place of birth - Born in other state (%) - Black or African American
Place of birth - Born in other state (%) - Asian
Place of birth - Born in other state (%) - Hispanic or Latino
Place of birth - Born in other state (%) - American Indian and Alaska Native
Place of birth - Born in other state (%) - Multirace
Place of birth - Born in other state (%) - Other Race
Place of birth - Native, outside of US (%)
Place of birth - Native, outside of US (%) - White
Place of birth - Native, outside of US (%) - Black or African American
Place of birth - Native, outside of US (%) - Asian
Place of birth - Native, outside of US (%) - Hispanic or Latino
Place of birth - Native, outside of US (%) - American Indian and Alaska Native
Place of birth - Native, outside of US (%) - Multirace
Place of birth - Native, outside of US (%) - Other Race
Place of birth - Foreign born (%)
Place of birth - Foreign born (%) - White
Place of birth - Foreign born (%) - Black or African American
Place of birth - Foreign born (%) - Asian
Place of birth - Foreign born (%) - Hispanic or Latino
Place of birth - Foreign born (%) - American Indian and Alaska Native
Place of birth - Foreign born (%) - Multirace
Place of birth - Foreign born (%) - Other Race
Residents speaking English at home (%)
Residents speaking English at home - Born in the United States (%)
Residents speaking English at home - Native, born elsewhere (%)
Residents speaking English at home - Foreign born (%)
Residents speaking Spanish at home (%)
Residents speaking Spanish at home - Born in the United States (%)
Residents speaking Spanish at home - Native, born elsewhere (%)
Residents speaking Spanish at home - Foreign born (%)
Residents speaking other language at home (%)
Residents speaking other language at home - Born in the United States (%)
Residents speaking other language at home - Native, born elsewhere (%)
Residents speaking other language at home - Foreign born (%)
Marital status - Never married (%)
Marital status - Now married (%)
Marital status - Separated (%)
Marital status - Widowed (%)
Marital status - Divorced (%)
Ancestries Reported - Arab (%)
Ancestries Reported - Czech (%)
Ancestries Reported - Danish (%)
Ancestries Reported - Dutch (%)
Ancestries Reported - English (%)
Ancestries Reported - French (%)
Ancestries Reported - French Canadian (%)
Ancestries Reported - German (%)
Ancestries Reported - Greek (%)
Ancestries Reported - Hungarian (%)
Ancestries Reported - Irish (%)
Ancestries Reported - Italian (%)
Ancestries Reported - Lithuanian (%)
Ancestries Reported - Norwegian (%)
Ancestries Reported - Polish (%)
Ancestries Reported - Portuguese (%)
Ancestries Reported - Russian (%)
Ancestries Reported - Scotch-Irish (%)
Ancestries Reported - Scottish (%)
Ancestries Reported - Slovak (%)
Ancestries Reported - Subsaharan African (%)
Ancestries Reported - Swedish (%)
Ancestries Reported - Swiss (%)
Ancestries Reported - Ukrainian (%)
Ancestries Reported - United States (%)
Ancestries Reported - Welsh (%)
Ancestries Reported - West Indian (%)
Ancestries Reported - Other (%)
Geographical mobility - Same house 1 year ago (%)
Geographical mobility - Same house 1 year ago (%) - White
Geographical mobility - Same house 1 year ago (%) - Black or African American
Geographical mobility - Same house 1 year ago (%) - Asian
Geographical mobility - Same house 1 year ago (%) - Hispanic or Latino
Geographical mobility - Same house 1 year ago (%) - American Indian and Alaska Native
Geographical mobility - Same house 1 year ago (%) - Multirace
Geographical mobility - Same house 1 year ago (%) - Other Race
Geographical mobility - Moved within same county (%)
Geographical mobility - Moved within same county (%) - White
Geographical mobility - Moved within same county (%) - Black or African American
Geographical mobility - Moved within same county (%) - Asian
Geographical mobility - Moved within same county (%) - Hispanic or Latino
Geographical mobility - Moved within same county (%) - American Indian and Alaska Native
Geographical mobility - Moved within same county (%) - Multirace
Geographical mobility - Moved within same county (%) - Other Race
Geographical mobility - Moved from different county within same state (%)
Geographical mobility - Moved from different county within same state (%) - White
Geographical mobility - Moved from different county within same state (%) - Black or African American
Geographical mobility - Moved from different county within same state (%) - Asian
Geographical mobility - Moved from different county within same state (%) - Hispanic or Latino
Geographical mobility - Moved from different county within same state (%) - American Indian and Alaska Native
Geographical mobility - Moved from different county within same state (%) - Multirace
Geographical mobility - Moved from different county within same state (%) - Other Race
Geographical mobility - Moved from different state (%)
Geographical mobility - Moved from different state (%) - White
Geographical mobility - Moved from different state (%) - Black or African American
Geographical mobility - Moved from different state (%) - Asian
Geographical mobility - Moved from different state (%) - Hispanic or Latino
Geographical mobility - Moved from different state (%) - American Indian and Alaska Native
Geographical mobility - Moved from different state (%) - Multirace
Geographical mobility - Moved from different state (%) - Other Race
Geographical mobility - Moved from abroad (%)
Geographical mobility - Moved from abroad (%) - White
Geographical mobility - Moved from abroad (%) - Black or African American
Geographical mobility - Moved from abroad (%) - Asian
Geographical mobility - Moved from abroad (%) - Hispanic or Latino
Geographical mobility - Moved from abroad (%) - American Indian and Alaska Native
Geographical mobility - Moved from abroad (%) - Multirace
Geographical mobility - Moved from abroad (%) - Other Race
Place of birth for the foreign-born population - Ireland (%)
Place of birth for the foreign-born population - Denmark (%)
Place of birth for the foreign-born population - Norway (%)
Place of birth for the foreign-born population - Sweden (%)
Place of birth for the foreign-born population - United Kingdom (%)
Place of birth for the foreign-born population - England (%)
Place of birth for the foreign-born population - Scotland (%)
Place of birth for the foreign-born population - Other Northern Europe (%)
Place of birth for the foreign-born population - Austria (%)
Place of birth for the foreign-born population - Belgium (%)
Place of birth for the foreign-born population - France (%)
Place of birth for the foreign-born population - Germany (%)
Place of birth for the foreign-born population - Netherlands (%)
Place of birth for the foreign-born population - Switzerland (%)
Place of birth for the foreign-born population - Other Western Europe (%)
Place of birth for the foreign-born population - Greece (%)
Place of birth for the foreign-born population - Italy (%)
Place of birth for the foreign-born population - Portugal (%)
Place of birth for the foreign-born population - Spain (%)
Place of birth for the foreign-born population - Other Southern Europe (%)
Place of birth for the foreign-born population - Albania (%)
Place of birth for the foreign-born population - Belarus (%)
Place of birth for the foreign-born population - Bosnia and Herzegovina (%)
Place of birth for the foreign-born population - Bulgaria (%)
Place of birth for the foreign-born population - Croatia (%)
Place of birth for the foreign-born population - Czechoslovakia (%)
Place of birth for the foreign-born population - Hungary (%)
Place of birth for the foreign-born population - Latvia (%)
Place of birth for the foreign-born population - Lithuania (%)
Place of birth for the foreign-born population - North Macedonia (Macedonia) (%)
Place of birth for the foreign-born population - Moldova (%)
Place of birth for the foreign-born population - Poland (%)
Place of birth for the foreign-born population - Romania (%)
Place of birth for the foreign-born population - Russia (%)
Place of birth for the foreign-born population - Serbia (%)
Place of birth for the foreign-born population - Ukraine (%)
Place of birth for the foreign-born population - Other Eastern Europe (%)
Place of birth for the foreign-born population - China (%)
Place of birth for the foreign-born population - Hong Kong (%)
Place of birth for the foreign-born population - Taiwan (%)
Place of birth for the foreign-born population - Japan (%)
Place of birth for the foreign-born population - Korea (%)
Place of birth for the foreign-born population - Other Eastern Asia (%)
Place of birth for the foreign-born population - Afghanistan (%)
Place of birth for the foreign-born population - Bangladesh (%)
Place of birth for the foreign-born population - India (%)
Place of birth for the foreign-born population - Iran (%)
Place of birth for the foreign-born population - Kazakhstan (%)
Place of birth for the foreign-born population - Nepal (%)
Place of birth for the foreign-born population - Pakistan (%)
Place of birth for the foreign-born population - Sri Lanka (%)
Place of birth for the foreign-born population - Uzbekistan (%)
Place of birth for the foreign-born population - Other South Central Asia (%)
Place of birth for the foreign-born population - Burma (%)
Place of birth for the foreign-born population - Cambodia (%)
Place of birth for the foreign-born population - Indonesia (%)
Place of birth for the foreign-born population - Laos (%)
Place of birth for the foreign-born population - Malaysia (%)
Place of birth for the foreign-born population - Philippines (%)
Place of birth for the foreign-born population - Singapore (%)
Place of birth for the foreign-born population - Thailand (%)
Place of birth for the foreign-born population - Vietnam (%)
Place of birth for the foreign-born population - Other South Eastern Asia (%)
Place of birth for the foreign-born population - Armenia (%)
Place of birth for the foreign-born population - Iraq (%)
Place of birth for the foreign-born population - Israel (%)
Place of birth for the foreign-born population - Jordan (%)
Place of birth for the foreign-born population - Kuwait (%)
Place of birth for the foreign-born population - Lebanon (%)
Place of birth for the foreign-born population - Saudi Arabia (%)
Place of birth for the foreign-born population - Syria (%)
Place of birth for the foreign-born population - Turkey (%)
Place of birth for the foreign-born population - Yemen (%)
Place of birth for the foreign-born population - Other Western Asia (%)
Place of birth for the foreign-born population - Eritrea (%)
Place of birth for the foreign-born population - Ethiopia (%)
Place of birth for the foreign-born population - Kenya (%)
Place of birth for the foreign-born population - Somalia (%)
Place of birth for the foreign-born population - Uganda (%)
Place of birth for the foreign-born population - Zimbabwe (%)
Place of birth for the foreign-born population - Other Eastern Africa (%)
Place of birth for the foreign-born population - Cameroon (%)
Place of birth for the foreign-born population - Congo (%)
Place of birth for the foreign-born population - Democratic Republic of Congo (Zaire) (%)
Place of birth for the foreign-born population - Other Middle Africa (%)
Place of birth for the foreign-born population - Egypt (%)
Place of birth for the foreign-born population - Morocco (%)
Place of birth for the foreign-born population - Sudan (%)
Place of birth for the foreign-born population - Other Northern Africa (%)
Place of birth for the foreign-born population - South Africa (%)
Place of birth for the foreign-born population - Other Southern Africa (%)
Place of birth for the foreign-born population - Cabo Verde (%)
Place of birth for the foreign-born population - Ghana (%)
Place of birth for the foreign-born population - Liberia (%)
Place of birth for the foreign-born population - Nigeria (%)
Place of birth for the foreign-born population - Senegal (%)
Place of birth for the foreign-born population - Sierra Leone (%)
Place of birth for the foreign-born population - Other Western Africa (%)
Place of birth for the foreign-born population - Australia (%)
Place of birth for the foreign-born population - New Zealand (%)
Place of birth for the foreign-born population - Fiji (%)
Place of birth for the foreign-born population - Micronesia (%)
Place of birth for the foreign-born population - Bahamas (%)
Place of birth for the foreign-born population - Barbados (%)
Place of birth for the foreign-born population - Cuba (%)
Place of birth for the foreign-born population - Dominica (%)
Place of birth for the foreign-born population - Dominican Republic (%)
Place of birth for the foreign-born population - Grenada (%)
Place of birth for the foreign-born population - Haiti (%)
Place of birth for the foreign-born population - Jamaica (%)
Place of birth for the foreign-born population - St. Vincent and the Grenadines (%)
Place of birth for the foreign-born population - Trinidad and Tobago (%)
Place of birth for the foreign-born population - West Indies (%)
Place of birth for the foreign-born population - Other Caribbean (%)
Place of birth for the foreign-born population - Belize (%)
Place of birth for the foreign-born population - Costa Rica (%)
Place of birth for the foreign-born population - El Salvador (%)
Place of birth for the foreign-born population - Guatemala (%)
Place of birth for the foreign-born population - Honduras (%)
Place of birth for the foreign-born population - Mexico (%)
Place of birth for the foreign-born population - Nicaragua (%)
Place of birth for the foreign-born population - Panama (%)
Place of birth for the foreign-born population - Other Central America (%)
Place of birth for the foreign-born population - Argentina (%)
Place of birth for the foreign-born population - Bolivia (%)
Place of birth for the foreign-born population - Brazil (%)
Place of birth for the foreign-born population - Chile (%)
Place of birth for the foreign-born population - Colombia (%)
Place of birth for the foreign-born population - Ecuador (%)
Place of birth for the foreign-born population - Guyana (%)
Place of birth for the foreign-born population - Peru (%)
Place of birth for the foreign-born population - Uruguay (%)
Place of birth for the foreign-born population - Venezuela (%)
Place of birth for the foreign-born population - Other South America (%)
Place of birth for the foreign-born population - Canada (%)
Place of birth for the foreign-born population - Other Northern America (%)
Place of birth for the foreign-born population - Other (%)
Latest news about races in Everett, MA collected exclusively by city-data.com from local newspapers, TV, and radio stations
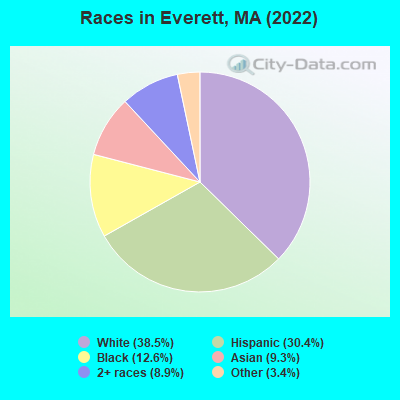
According to 2022 data, the most numerous races in Everett, MA are White alone (18,652 residents), Hispanic (14,767 residents), and Asian alone (4,503 residents). 37.6% of Everett residents speak English at home. 46.7% of Everett, MA residents are foreign-born (32.0% born in Latin America, 7.1% born in Asia), which is 61.4% greater than the foreign-born rate of 18.0% across the entire state of Massachusetts.
Race distribution in Everett
2000 2022
28,587 75.2% White alone 3,617 9.5% Hispanic 2,269 6.0% Black alone 1,654 4.3% Two or more races 1,230 3.2% Asian alone 559 1.5% Other race alone 100 0.3% American Indian alone 21 0.06% Native Hawaiian and Other
18,652 38.5% White alone 14,767 30.4% Hispanic 6,099 12.6% Black alone 4,503 9.3% Asian alone 4,324 8.9% Two or more races 1,642 3.4% Other race alone 23 0.05% Native Hawaiian and Other
2000 2022
5,198,359 81.9% White alone 428,729 6.8% Hispanic 318,329 5.0% Black alone 236,786 3.7% Asian alone 110,338 1.7% Two or more races 43,586 0.7% Other race alone 11,264 0.2% American Indian alone 1,706 0.03% Native Hawaiian and Other
4,676,627 67.0% White alone 911,038 13.0% Hispanic 501,463 7.2% Asian alone 459,740 6.6% Black alone 341,889 4.9% Two or more races 84,403 1.2% Other race alone 5,838 0.08% American Indian alone 976 0.01% Native Hawaiian and Other
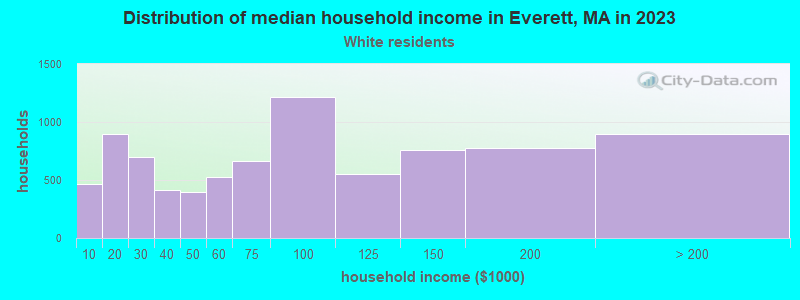
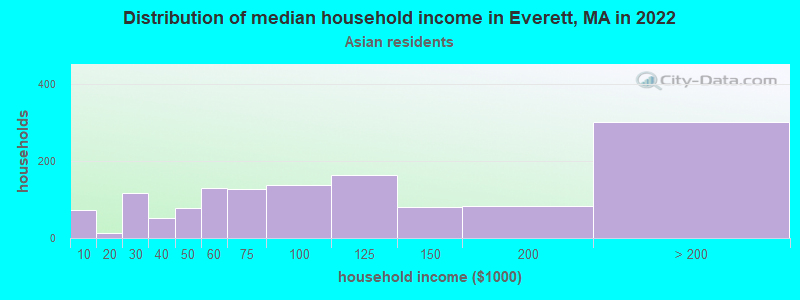
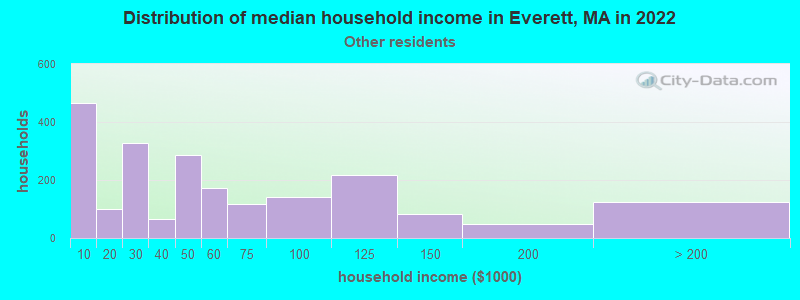
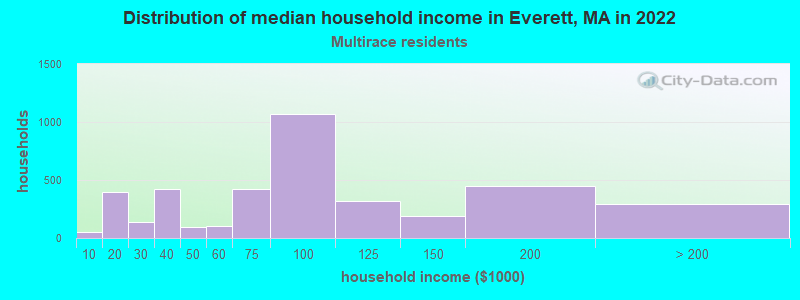
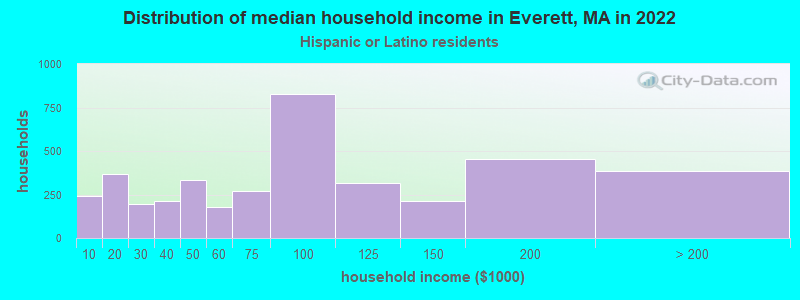
Income and house value in Everett Median household income in 2022 $70,816 White non-Hispanic householders$91,996 Black householders$87,273 Asian householders$49,341 Some other race householders$88,794 Two or more races householders$87,229 Hispanic or Latino race householdersMedian 2022 house value $534,474 White Non-Hispanic householders$559,502 Black or African American householdersover $1,000,000 American Indian or Alaska Native householders $606,264 Asian householders$776,190 Some other race householders$850,614 Two or more races householders$635,244 Hispanic or Latino householders
Median age by race in Everett
43.6 Median age for White residents41.0 47.3 35.3 Median age for Black or African American residents33.8 35.6 25.3 Median age for American Indian / Alaska Native residents32.0 7.6 37.9 Median age for Asian residents37.4 38.4 23.0 Median age for Native Hawaiian / Pacific Islander residents-513,131,312.6 -508,717,948.2 33.1 Median age for Other race residents31.8 36.6 29.4 Median age for Two or more races residents29.0 29.4 45.4 Median age for White alone residents42.9 49.2 27.7 Median age for Hispanic or Latino residents27.9 27.5
Owner/renter occupied households by race in Everett
House owners and renters - White residents 3,314 36.9% Owner occupied5,662 63.1% Renter occupiedHouse owners and renters - Black or African American residents 966 46.4% Owner occupied1,117 53.6% Renter occupiedHouse owners and renters - American Indian / Alaska Native residents 166 100.0% Renter occupiedHouse owners and renters - Asian residents 786 58.7% Owner occupied554 41.3% Renter occupiedHouse owners and renters - Native Hawaiian / Pacific Islander residents 78 100.0% Renter occupiedHouse owners and renters - Other race residents 632 32.4% Owner occupied1,319 67.6% Renter occupiedHouse owners and renters - Two or more races residents 996 25.8% Owner occupied2,867 74.2% Renter occupiedHouse owners and renters - White alone residents 3,127 37.2% Owner occupied5,285 62.8% Renter occupiedHouse owners and renters - Hispanic or Latino residents 1,074 26.1% Owner occupied3,046 73.9% Renter occupied
Language usage in Everett
English speakers - Total 37.6% of residents of Everett speak English at home.
24.3% of residents speak Spanish at home 5,699 51.7% Speak English very well5,332 48.3% Speak English less than very well40.3% of residents speak other language at home 8,374 45.8% Speak English very well9,928 54.2% Speak English less than very well
English speakers - Born in the United States 71.4% of residents of Everett speak English at home.
19.0% of residents speak Spanish at home 544 82.2% Speak English very well118 17.8% Speak English less than very well9.9% of residents speak other language at home 235 67.9% Speak English very well111 32.1% Speak English less than very well
English speakers - Native, born elsewhere 40.0% of residents of Everett speak English at home.
44.2% of residents speak Spanish at home 574 87.8% Speak English very well80 12.2% Speak English less than very well21.1% of residents speak other language at home 49 15.7% Speak English very well264 84.3% Speak English less than very well
English speakers - Foreign-born 6.9% of residents of Everett speak English at home.
31.8% of residents speak Spanish at home 2,252 31.5% Speak English very well4,893 68.5% Speak English less than very well62.8% of residents speak other language at home 4,931 34.9% Speak English very well9,180 65.1% Speak English less than very well
White (Caucasian) - Speak only English Native:
82.5% (11,357)Foreign-born:
8.1% (504)
White (Caucasian) - Speak another language Native:
15.9% (2,185)Foreign-born:
92.7% (5,791)
Black or African American - Speak only English Native:
72.8% (2,481)Foreign-born:
15.7% (426)
Black or African American - Speak another language Native:
28.6% (974)Foreign-born:
83.7% (2,265)
American Indian / Alaska Native - Speak another language Native:
100.0% (103)Foreign-born:
100.0% (269)
Asian - Speak only English Native:
36.5% (330)Foreign-born:
9.6% (314)
Asian - Speak another language Native:
63.5% (574)Foreign-born:
90.6% (2,950)
Other race - Speak only English Native:
24.2% (399)Foreign-born:
5.4% (184)
Other race - Speak another language Native:
70.5% (1,165)Foreign-born:
94.5% (3,242)
Two or more races - Speak only English Native:
22.7% (1,068)Foreign-born:
2.6% (220)
Two or more races - Speak another language Native:
84.2% (3,962)Foreign-born:
97.8% (8,421)
White alone - Speak only English Native:
86.1% (10,777)Foreign-born:
7.7% (402)
White alone - Speak another language Native:
13.7% (1,709)Foreign-born:
94.3% (4,954)
Hispanic or Latino - Speak only English Native:
31.5% (1,822)Foreign-born:
3.7% (278)
Hispanic or Latino - Speak another language Native:
66.8% (3,864)Foreign-born:
96.3% (7,310)
Foreign-born residents in Everett 22,641 residents are foreign born (32.0% Latin America , 7.1% Asia ).
This city:
46.7%Massachusetts:
17.6%
Marital status for residents in Everett Marital status - White (Caucasian) population 15 years and over
Males 44.5% Never married41.8% Now married0.9% Separated1.9% Widowed11.0% DivorcedFemales 36.7% Never married37.2% Now married2.7% Separated11.0% Widowed12.4% DivorcedWomen who gave birth in the past 12 months Now married:
78.9% (165)Unmarried:
21.1% (44)
Women who did not give birth in the past 12 months Now married:
35.2% (1,576)Unmarried:
64.8% (2,905)
Marital status - Black or African American population 15 years and over
Males 45.6% Never married39.6% Now married2.1% Separated0.3% Widowed12.4% DivorcedFemales 46.8% Never married33.7% Now married1.6% Separated3.4% Widowed14.5% DivorcedWomen who gave birth in the past 12 months Now married:
38.7% (72)Unmarried:
61.3% (114)
Women who did not give birth in the past 12 months Now married:
26.0% (438)Unmarried:
74.0% (1,250)
Marital status - American Indian / Alaska Native population 15 years and over
Males 52.9% Never married47.1% Now married0.0% Separated0.0% Widowed0.0% DivorcedFemales 16.9% Never married83.1% Now married0.0% Separated0.0% Widowed0.0% DivorcedWomen who gave birth in the past 12 months Now married:
100.0% (65)Unmarried:
0.0% (0)
Women who did not give birth in the past 12 months Now married:
55.9% (22)Unmarried:
44.1% (18)
Marital status - Asian population 15 years and over
Males 38.7% Never married51.4% Now married2.0% Separated0.4% Widowed7.5% DivorcedFemales 20.4% Never married63.5% Now married0.0% Separated10.5% Widowed5.6% DivorcedWomen who gave birth in the past 12 months Now married:
66.7% (31)Unmarried:
33.3% (15)
Women who did not give birth in the past 12 months Now married:
74.8% (763)Unmarried:
25.2% (257)
Marital status - Native Hawaiian / Pacific Islander population 15 years and over
Males 0.0% Never married100.0% Now married0.0% Separated0.0% Widowed0.0% DivorcedFemales 0.0% Never married100.0% Now married0.0% Separated0.0% Widowed0.0% DivorcedWomen who did not give birth in the past 12 months Now married:
100.0% (25)Unmarried:
0.0% (0)
Marital status - Other race population 15 years and over
Males 48.9% Never married45.2% Now married1.8% Separated0.0% Widowed4.1% DivorcedFemales 39.6% Never married48.8% Now married4.5% Separated0.5% Widowed6.6% DivorcedWomen who gave birth in the past 12 months Now married:
37.2% (56)Unmarried:
62.8% (95)
Women who did not give birth in the past 12 months Now married:
50.2% (709)Unmarried:
49.8% (704)
Marital status - Two or more races population 15 years and over
Males 54.8% Never married39.5% Now married1.1% Separated0.0% Widowed4.7% DivorcedFemales 42.3% Never married43.6% Now married1.7% Separated4.1% Widowed8.2% DivorcedWomen who gave birth in the past 12 months Now married:
15.1% (40)Unmarried:
84.9% (223)
Women who did not give birth in the past 12 months Now married:
42.3% (1,410)Unmarried:
57.7% (1,926)
Marital status - White alone, not Hispanic / Latino population 15 years and over
Males 44.1% Never married42.4% Now married0.7% Separated1.7% Widowed11.2% DivorcedFemales 36.5% Never married36.2% Now married2.5% Separated12.2% Widowed12.6% DivorcedWomen who gave birth in the past 12 months Now married:
81.3% (106)Unmarried:
18.7% (24)
Women who did not give birth in the past 12 months Now married:
34.9% (1,401)Unmarried:
65.1% (2,618)
Marital status - Hispanic or Latino population 15 years and over
Males 53.5% Never married38.3% Now married1.1% Separated0.8% Widowed6.2% DivorcedFemales 49.8% Never married38.8% Now married2.3% Separated1.7% Widowed7.5% DivorcedWomen who gave birth in the past 12 months Now married:
39.0% (204)Unmarried:
61.0% (319)
Women who did not give birth in the past 12 months Now married:
35.5% (1,206)Unmarried:
64.5% (2,189)
Ancestries in Everett
4,751 16.3% Brazilian2,759 9.5% Italian2,341 8.0% Haitian1,248 4.3% Irish896 3.1% American745 2.6% Portuguese555 1.9% Moroccan223 0.8% English214 0.7% African210 0.7% Polish153 0.5% Cape Verdean132 0.5% Russian119 0.4% Yugoslavian117 0.4% French Canadian116 0.4% Ethiopian80 0.3% Albanian76 0.3% Canadian59 0.2% German48 0.2% Northern European43 0.1% Nigerian41 0.1% Croatian38 0.1% Israeli33 0.1% Kenyan31 0.1% Scottish29 0.10% Arab27 0.09% European25 0.09% Greek20 0.07% Armenian19 0.07% Scotch-Irish18 0.06% British17 0.06% French16 0.05% Danish16 0.05% Czech13 0.04% Swiss12 0.04% Cajun12 0.04% Welsh11 0.04% New Zealander11 0.04% Romanian10 0.03% Austrian10 0.03% Australian9 0.03% Eastern European8 0.03% Norwegian8 0.03% Turkish5 0.02% Hungarian
Geographical mobility in Everett Same house 1 year ago 18,361 87.5% White (Caucasian)6,020 94.2% Black or African American433 81.5% American Indian / Alaska Native4,176 92.7% Asian58 58.1% Native Hawaiian / Pacific Islander4,286 81.6% Other race12,307 90.5% Two or more races16,618 89.6% White alone, not Hispanic / Latino12,097 84.3% Hispanic or LatinoMoved within same county 1,451 6.9% White / Caucasian267 4.2% Black or African American58 1.3% Asian40 40.3% Native Hawaiian / Pacific Islander256 4.9% Other race184 1.4% Two or more races1,100 5.9% White alone, not Hispanic / Latino684 4.8% Hispanic or LatinoMoved within same state 704 3.4% White / Caucasian134 2.1% Black or African American144 27.0% American Indian / Alaska Native258 5.7% Asian155 3.0% Other race355 2.6% Two or more races487 2.6% White alone, not Hispanic / Latino763 5.3% Hispanic or LatinoMoved from different state 96 0.5% White / Caucasian35 0.6% Black or African American10 0.2% Asian192 3.7% Other race298 2.2% Two or more races79 0.4% White alone, not Hispanic / Latino138 1.0% Hispanic or LatinoMoved from abroad 433 2.1% White77 1.2% Black or African American367 7.0% Other race270 2.0% Two or more races318 1.7% White alone, not Hispanic / Latino455 3.2% Hispanic or Latino
Children Nativity (place of birth) in Everett
Children under 6 years - Living with two parents Both parents native 365 100.0% NativeBoth parents foreign-born 1,341 85.4% Native229 14.6% Foreign-bornOne native, one foreign-born parent 71 100.0% NativeChildren under 6 years - Living with one parent Native parent 732 100.0% NativeForeign-born parent 670 92.8% Native52 7.2% Foreign-bornChildren 6 to 17 years - Living with two parents Both parents native 304 100.0% NativeBoth parents foreign-born 1,714 69.8% Native742 30.2% Foreign-bornOne native, one foreign-born parent 689 100.0% NativeChildren 6 to 17 years - Living with one parent Native parent 26 100.0% NativeForeign-born parent 2,423 61.0% Native1,549 39.0% Foreign-born
Place of birth for residents in Everett 16,206 Americas16,127 Latin America7,429 South America5,839 Central America3,584 Asia2,858 Caribbean1,567 Europe1,491 South Eastern Asia1,381 South Central Asia1,237 Africa952 Southern Europe608 Eastern Asia607 Northern Africa524 China497 Eastern Europe308 Western Africa275 Eastern Africa96 Northern Europe96 Western Asia79 Northern America44 Oceania44 Australia and New Zealand Subregion21 Western Europe6,064 Brazil4,321 El Salvador2,646 Haiti1,289 Vietnam887 India704 Colombia651 Honduras576 Italy507 China451 Morocco376 Portugal365 Mexico353 Nepal346 Ecuador306 Guatemala192 Peru188 Russia155 Algeria149 Bosnia and Herzegovina144 Dominican Republic135 Ethiopia88 Ghana81 Cabo Verde80 Croatia80 Afghanistan79 Canada77 Eritrea73 Korea68 Iraq67 Cuba65 Costa Rica55 Albania54 Nigeria51 Kenya50 Argentina47 Chile45 Burma (Myanmar)39 Thailand38 Cambodia37 Bangladesh35 United Kingdom33 Australia33 Ireland32 Indonesia24 Singapore24 Nicaragua23 Bolivia22 Pakistan22 Czechoslovakia21 Philippines21 Germany19 Turkey18 England16 Hong Kong12 Panama11 New Zealand10 Zimbabwe10 Japan9 Denmark8 Syria
Grandparents responsible for own grandchildren in Everett
Grandparents (30 to 59 years) White / Caucasian 49 74.1% Responsible for grandchildren17 25.9% Not responsible for grandchildrenBlack or African American 6 4.0% Responsible for grandchildren147 96.0% Not responsible for grandchildrenAsian 56 100.0% Not responsible for grandchildrenOther race 165 100.0% Not responsible for grandchildrenTwo or more races 89 100.0% Not responsible for grandchildrenWhite alone, not Hispanic / Latino 55 74.5% Responsible for grandchildren19 25.5% Not responsible for grandchildrenHispanic or Latino 75 100.0% Not responsible for grandchildrenGrandparents (60 years and over) White / Caucasian 109 55.5% Responsible for grandchildren87 44.5% Not responsible for grandchildrenBlack or African American 48 100.0% Not responsible for grandchildrenAsian 29 16.2% Responsible for grandchildren150 83.8% Not responsible for grandchildrenOther race 20 100.0% Not responsible for grandchildrenTwo or more races 21 10.6% Responsible for grandchildren177 89.4% Not responsible for grandchildrenWhite alone, not Hispanic / Latino 109 62.2% Responsible for grandchildren66 37.8% Not responsible for grandchildrenHispanic or Latino 15 11.8% Responsible for grandchildren112 88.2% Not responsible for grandchildren