Races in Franklin Town, Massachusetts (MA) Detailed Stats
Data:
Races - White alone (%)
Races - White alone (% change since 2000)
Races - Black alone (%)
Races - Black alone (% change since 2000)
Races - American Indian alone (%)
Races - American Indian alone (% change since 2000)
Races - Asian alone (%)
Races - Asian alone (% change since 2000)
Races - Hispanic (%)
Races - Hispanic (% change since 2000)
Races - Native Hawaiian and Other Pacific Islander alone (%)
Races - Native Hawaiian and Other Pacific Islander alone (% change since 2000)
Races - Two or more races(%)
Races - Two or more races(% change since 2000)
Races - Other race alone (%)
Races - Other race alone (% change since 2000)
Racial diversity
Place of birth - Born in state of residence (%)
Place of birth - Born in state of residence (%) - White
Place of birth - Born in state of residence (%) - Black or African American
Place of birth - Born in state of residence (%) - Asian
Place of birth - Born in state of residence (%) - Hispanic or Latino
Place of birth - Born in state of residence (%) - American Indian and Alaska Native
Place of birth - Born in state of residence (%) - Multirace
Place of birth - Born in state of residence (%) - Other Race
Place of birth - Born in other state (%)
Place of birth - Born in other state (%) - White
Place of birth - Born in other state (%) - Black or African American
Place of birth - Born in other state (%) - Asian
Place of birth - Born in other state (%) - Hispanic or Latino
Place of birth - Born in other state (%) - American Indian and Alaska Native
Place of birth - Born in other state (%) - Multirace
Place of birth - Born in other state (%) - Other Race
Place of birth - Native, outside of US (%)
Place of birth - Native, outside of US (%) - White
Place of birth - Native, outside of US (%) - Black or African American
Place of birth - Native, outside of US (%) - Asian
Place of birth - Native, outside of US (%) - Hispanic or Latino
Place of birth - Native, outside of US (%) - American Indian and Alaska Native
Place of birth - Native, outside of US (%) - Multirace
Place of birth - Native, outside of US (%) - Other Race
Place of birth - Foreign born (%)
Place of birth - Foreign born (%) - White
Place of birth - Foreign born (%) - Black or African American
Place of birth - Foreign born (%) - Asian
Place of birth - Foreign born (%) - Hispanic or Latino
Place of birth - Foreign born (%) - American Indian and Alaska Native
Place of birth - Foreign born (%) - Multirace
Place of birth - Foreign born (%) - Other Race
Residents speaking English at home (%)
Residents speaking English at home - Born in the United States (%)
Residents speaking English at home - Native, born elsewhere (%)
Residents speaking English at home - Foreign born (%)
Residents speaking Spanish at home (%)
Residents speaking Spanish at home - Born in the United States (%)
Residents speaking Spanish at home - Native, born elsewhere (%)
Residents speaking Spanish at home - Foreign born (%)
Residents speaking other language at home (%)
Residents speaking other language at home - Born in the United States (%)
Residents speaking other language at home - Native, born elsewhere (%)
Residents speaking other language at home - Foreign born (%)
Marital status - Never married (%)
Marital status - Now married (%)
Marital status - Separated (%)
Marital status - Widowed (%)
Marital status - Divorced (%)
Ancestries Reported - Arab (%)
Ancestries Reported - Czech (%)
Ancestries Reported - Danish (%)
Ancestries Reported - Dutch (%)
Ancestries Reported - English (%)
Ancestries Reported - French (%)
Ancestries Reported - French Canadian (%)
Ancestries Reported - German (%)
Ancestries Reported - Greek (%)
Ancestries Reported - Hungarian (%)
Ancestries Reported - Irish (%)
Ancestries Reported - Italian (%)
Ancestries Reported - Lithuanian (%)
Ancestries Reported - Norwegian (%)
Ancestries Reported - Polish (%)
Ancestries Reported - Portuguese (%)
Ancestries Reported - Russian (%)
Ancestries Reported - Scotch-Irish (%)
Ancestries Reported - Scottish (%)
Ancestries Reported - Slovak (%)
Ancestries Reported - Subsaharan African (%)
Ancestries Reported - Swedish (%)
Ancestries Reported - Swiss (%)
Ancestries Reported - Ukrainian (%)
Ancestries Reported - United States (%)
Ancestries Reported - Welsh (%)
Ancestries Reported - West Indian (%)
Ancestries Reported - Other (%)
Geographical mobility - Same house 1 year ago (%)
Geographical mobility - Same house 1 year ago (%) - White
Geographical mobility - Same house 1 year ago (%) - Black or African American
Geographical mobility - Same house 1 year ago (%) - Asian
Geographical mobility - Same house 1 year ago (%) - Hispanic or Latino
Geographical mobility - Same house 1 year ago (%) - American Indian and Alaska Native
Geographical mobility - Same house 1 year ago (%) - Multirace
Geographical mobility - Same house 1 year ago (%) - Other Race
Geographical mobility - Moved within same county (%)
Geographical mobility - Moved within same county (%) - White
Geographical mobility - Moved within same county (%) - Black or African American
Geographical mobility - Moved within same county (%) - Asian
Geographical mobility - Moved within same county (%) - Hispanic or Latino
Geographical mobility - Moved within same county (%) - American Indian and Alaska Native
Geographical mobility - Moved within same county (%) - Multirace
Geographical mobility - Moved within same county (%) - Other Race
Geographical mobility - Moved from different county within same state (%)
Geographical mobility - Moved from different county within same state (%) - White
Geographical mobility - Moved from different county within same state (%) - Black or African American
Geographical mobility - Moved from different county within same state (%) - Asian
Geographical mobility - Moved from different county within same state (%) - Hispanic or Latino
Geographical mobility - Moved from different county within same state (%) - American Indian and Alaska Native
Geographical mobility - Moved from different county within same state (%) - Multirace
Geographical mobility - Moved from different county within same state (%) - Other Race
Geographical mobility - Moved from different state (%)
Geographical mobility - Moved from different state (%) - White
Geographical mobility - Moved from different state (%) - Black or African American
Geographical mobility - Moved from different state (%) - Asian
Geographical mobility - Moved from different state (%) - Hispanic or Latino
Geographical mobility - Moved from different state (%) - American Indian and Alaska Native
Geographical mobility - Moved from different state (%) - Multirace
Geographical mobility - Moved from different state (%) - Other Race
Geographical mobility - Moved from abroad (%)
Geographical mobility - Moved from abroad (%) - White
Geographical mobility - Moved from abroad (%) - Black or African American
Geographical mobility - Moved from abroad (%) - Asian
Geographical mobility - Moved from abroad (%) - Hispanic or Latino
Geographical mobility - Moved from abroad (%) - American Indian and Alaska Native
Geographical mobility - Moved from abroad (%) - Multirace
Geographical mobility - Moved from abroad (%) - Other Race
Place of birth for the foreign-born population - Ireland (%)
Place of birth for the foreign-born population - Denmark (%)
Place of birth for the foreign-born population - Norway (%)
Place of birth for the foreign-born population - Sweden (%)
Place of birth for the foreign-born population - United Kingdom (%)
Place of birth for the foreign-born population - England (%)
Place of birth for the foreign-born population - Scotland (%)
Place of birth for the foreign-born population - Other Northern Europe (%)
Place of birth for the foreign-born population - Austria (%)
Place of birth for the foreign-born population - Belgium (%)
Place of birth for the foreign-born population - France (%)
Place of birth for the foreign-born population - Germany (%)
Place of birth for the foreign-born population - Netherlands (%)
Place of birth for the foreign-born population - Switzerland (%)
Place of birth for the foreign-born population - Other Western Europe (%)
Place of birth for the foreign-born population - Greece (%)
Place of birth for the foreign-born population - Italy (%)
Place of birth for the foreign-born population - Portugal (%)
Place of birth for the foreign-born population - Spain (%)
Place of birth for the foreign-born population - Other Southern Europe (%)
Place of birth for the foreign-born population - Albania (%)
Place of birth for the foreign-born population - Belarus (%)
Place of birth for the foreign-born population - Bosnia and Herzegovina (%)
Place of birth for the foreign-born population - Bulgaria (%)
Place of birth for the foreign-born population - Croatia (%)
Place of birth for the foreign-born population - Czechoslovakia (%)
Place of birth for the foreign-born population - Hungary (%)
Place of birth for the foreign-born population - Latvia (%)
Place of birth for the foreign-born population - Lithuania (%)
Place of birth for the foreign-born population - North Macedonia (Macedonia) (%)
Place of birth for the foreign-born population - Moldova (%)
Place of birth for the foreign-born population - Poland (%)
Place of birth for the foreign-born population - Romania (%)
Place of birth for the foreign-born population - Russia (%)
Place of birth for the foreign-born population - Serbia (%)
Place of birth for the foreign-born population - Ukraine (%)
Place of birth for the foreign-born population - Other Eastern Europe (%)
Place of birth for the foreign-born population - China (%)
Place of birth for the foreign-born population - Hong Kong (%)
Place of birth for the foreign-born population - Taiwan (%)
Place of birth for the foreign-born population - Japan (%)
Place of birth for the foreign-born population - Korea (%)
Place of birth for the foreign-born population - Other Eastern Asia (%)
Place of birth for the foreign-born population - Afghanistan (%)
Place of birth for the foreign-born population - Bangladesh (%)
Place of birth for the foreign-born population - India (%)
Place of birth for the foreign-born population - Iran (%)
Place of birth for the foreign-born population - Kazakhstan (%)
Place of birth for the foreign-born population - Nepal (%)
Place of birth for the foreign-born population - Pakistan (%)
Place of birth for the foreign-born population - Sri Lanka (%)
Place of birth for the foreign-born population - Uzbekistan (%)
Place of birth for the foreign-born population - Other South Central Asia (%)
Place of birth for the foreign-born population - Burma (%)
Place of birth for the foreign-born population - Cambodia (%)
Place of birth for the foreign-born population - Indonesia (%)
Place of birth for the foreign-born population - Laos (%)
Place of birth for the foreign-born population - Malaysia (%)
Place of birth for the foreign-born population - Philippines (%)
Place of birth for the foreign-born population - Singapore (%)
Place of birth for the foreign-born population - Thailand (%)
Place of birth for the foreign-born population - Vietnam (%)
Place of birth for the foreign-born population - Other South Eastern Asia (%)
Place of birth for the foreign-born population - Armenia (%)
Place of birth for the foreign-born population - Iraq (%)
Place of birth for the foreign-born population - Israel (%)
Place of birth for the foreign-born population - Jordan (%)
Place of birth for the foreign-born population - Kuwait (%)
Place of birth for the foreign-born population - Lebanon (%)
Place of birth for the foreign-born population - Saudi Arabia (%)
Place of birth for the foreign-born population - Syria (%)
Place of birth for the foreign-born population - Turkey (%)
Place of birth for the foreign-born population - Yemen (%)
Place of birth for the foreign-born population - Other Western Asia (%)
Place of birth for the foreign-born population - Eritrea (%)
Place of birth for the foreign-born population - Ethiopia (%)
Place of birth for the foreign-born population - Kenya (%)
Place of birth for the foreign-born population - Somalia (%)
Place of birth for the foreign-born population - Uganda (%)
Place of birth for the foreign-born population - Zimbabwe (%)
Place of birth for the foreign-born population - Other Eastern Africa (%)
Place of birth for the foreign-born population - Cameroon (%)
Place of birth for the foreign-born population - Congo (%)
Place of birth for the foreign-born population - Democratic Republic of Congo (Zaire) (%)
Place of birth for the foreign-born population - Other Middle Africa (%)
Place of birth for the foreign-born population - Egypt (%)
Place of birth for the foreign-born population - Morocco (%)
Place of birth for the foreign-born population - Sudan (%)
Place of birth for the foreign-born population - Other Northern Africa (%)
Place of birth for the foreign-born population - South Africa (%)
Place of birth for the foreign-born population - Other Southern Africa (%)
Place of birth for the foreign-born population - Cabo Verde (%)
Place of birth for the foreign-born population - Ghana (%)
Place of birth for the foreign-born population - Liberia (%)
Place of birth for the foreign-born population - Nigeria (%)
Place of birth for the foreign-born population - Senegal (%)
Place of birth for the foreign-born population - Sierra Leone (%)
Place of birth for the foreign-born population - Other Western Africa (%)
Place of birth for the foreign-born population - Australia (%)
Place of birth for the foreign-born population - New Zealand (%)
Place of birth for the foreign-born population - Fiji (%)
Place of birth for the foreign-born population - Micronesia (%)
Place of birth for the foreign-born population - Bahamas (%)
Place of birth for the foreign-born population - Barbados (%)
Place of birth for the foreign-born population - Cuba (%)
Place of birth for the foreign-born population - Dominica (%)
Place of birth for the foreign-born population - Dominican Republic (%)
Place of birth for the foreign-born population - Grenada (%)
Place of birth for the foreign-born population - Haiti (%)
Place of birth for the foreign-born population - Jamaica (%)
Place of birth for the foreign-born population - St. Vincent and the Grenadines (%)
Place of birth for the foreign-born population - Trinidad and Tobago (%)
Place of birth for the foreign-born population - West Indies (%)
Place of birth for the foreign-born population - Other Caribbean (%)
Place of birth for the foreign-born population - Belize (%)
Place of birth for the foreign-born population - Costa Rica (%)
Place of birth for the foreign-born population - El Salvador (%)
Place of birth for the foreign-born population - Guatemala (%)
Place of birth for the foreign-born population - Honduras (%)
Place of birth for the foreign-born population - Mexico (%)
Place of birth for the foreign-born population - Nicaragua (%)
Place of birth for the foreign-born population - Panama (%)
Place of birth for the foreign-born population - Other Central America (%)
Place of birth for the foreign-born population - Argentina (%)
Place of birth for the foreign-born population - Bolivia (%)
Place of birth for the foreign-born population - Brazil (%)
Place of birth for the foreign-born population - Chile (%)
Place of birth for the foreign-born population - Colombia (%)
Place of birth for the foreign-born population - Ecuador (%)
Place of birth for the foreign-born population - Guyana (%)
Place of birth for the foreign-born population - Peru (%)
Place of birth for the foreign-born population - Uruguay (%)
Place of birth for the foreign-born population - Venezuela (%)
Place of birth for the foreign-born population - Other South America (%)
Place of birth for the foreign-born population - Canada (%)
Place of birth for the foreign-born population - Other Northern America (%)
Place of birth for the foreign-born population - Other (%)
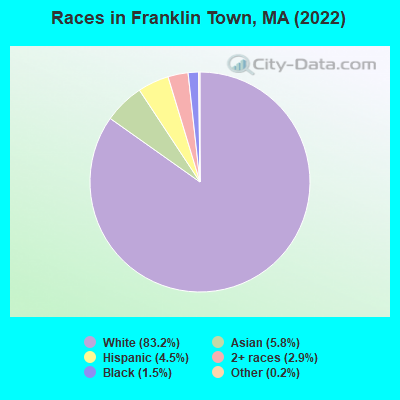
According to 2022 data, the most numerous races in Franklin Town, MA are White alone (27,387 residents), Hispanic (1,495 residents), and Asian alone (1,906 residents). 88.0% of Franklin Town residents speak English at home.
Race distribution in Franklin Town 27,387 83.2% White alone 1,906 5.8% Asian alone 1,495 4.5% Hispanic 949 2.9% Two or more races 500 1.5% Black alone 55 0.2% Other race alone
2000 2022
5,198,359 81.9% White alone 428,729 6.8% Hispanic 318,329 5.0% Black alone 236,786 3.7% Asian alone 110,338 1.7% Two or more races 43,586 0.7% Other race alone 11,264 0.2% American Indian alone 1,706 0.03% Native Hawaiian and Other
4,676,627 67.0% White alone 911,038 13.0% Hispanic 501,463 7.2% Asian alone 459,740 6.6% Black alone 341,889 4.9% Two or more races 84,403 1.2% Other race alone 5,838 0.08% American Indian alone 976 0.01% Native Hawaiian and Other
Income and house value in Franklin Town Median household income in 2022 $132,895 White non-Hispanic householders$183,781 Asian householders$100,668 Two or more races householders$101,247 Hispanic or Latino race householders
Median age by race in Franklin Town
44.2 Median age for White residents44.0 44.2 20.3 Median age for Black or African American residents21.4 20.3 -655,238,094.6 Median age for American Indian / Alaska Native residents-649,474,688.9 -657,223,795.4 38.5 Median age for Asian residents38.3 38.6 -514,227,641.8 Median age for Native Hawaiian / Pacific Islander residents-513,131,312.6 -508,717,948.2 51.9 Median age for Other race residents54.5 57.6 22.9 Median age for Two or more races residents44.6 19.0 44.2 Median age for White alone residents44.0 44.6 24.4 Median age for Hispanic or Latino residents25.9 22.6
Owner/renter occupied households by race in Franklin Town
House owners and renters - White residents 8,735 80.9% Owner occupied2,064 19.1% Renter occupiedHouse owners and renters - Black or African American residents 41 36.3% Owner occupied71 63.7% Renter occupiedHouse owners and renters - Asian residents 422 73.4% Owner occupied153 26.6% Renter occupiedHouse owners and renters - Other race residents 83 100.0% Owner occupiedHouse owners and renters - Two or more races residents 328 69.0% Owner occupied147 31.0% Renter occupiedHouse owners and renters - White alone residents 8,583 80.8% Owner occupied2,044 19.2% Renter occupiedHouse owners and renters - Hispanic or Latino residents 360 78.4% Owner occupied99 21.6% Renter occupied
Language usage in Franklin Town
English speakers - Total 88.0% of residents of Franklin Town speak English at home.
2.2% of residents speak Spanish at home 454 66.5% Speak English very well229 33.5% Speak English less than very well9.1% of residents speak other language at home 2,052 71.4% Speak English very well823 28.6% Speak English less than very well
English speakers - Born in the United States 94.6% of residents of Franklin Town speak English at home.
1.1% of residents speak Spanish at home 79 82.3% Speak English very well17 17.7% Speak English less than very well3.8% of residents speak other language at home 306 94.4% Speak English very well18 5.6% Speak English less than very well
English speakers - Native, born elsewhere 50.2% of residents of Franklin Town speak English at home.
61.7% of residents speak Spanish at home 66 51.2% Speak English very well63 48.8% Speak English less than very well
English speakers - Foreign-born 18.1% of residents of Franklin Town speak English at home.
9.5% of residents speak Spanish at home 181 64.2% Speak English very well101 35.8% Speak English less than very well73.0% of residents speak other language at home 1,434 65.9% Speak English very well742 34.1% Speak English less than very well
White (Caucasian) - Speak only English Native:
97.8% (25,570)Foreign-born:
39.1% (406)
White (Caucasian) - Speak another language Native:
2.2% (571)Foreign-born:
60.7% (630)
Black or African American - Speak only English Native:
78.2% (144)Foreign-born:
1.9% (5)
Black or African American - Speak another language Native:
22.1% (41)Foreign-born:
100.0% (287)
Asian - Speak only English Native:
56.8% (299)Foreign-born:
4.6% (58)
Asian - Speak another language Native:
43.7% (230)Foreign-born:
94.2% (1,171)
Other race - Speak another language Native:
38.7% (49)Foreign-born:
98.2% (5)
Two or more races - Speak only English Native:
86.3% (1,128)Foreign-born:
9.7% (27)
Two or more races - Speak another language Native:
13.2% (172)Foreign-born:
92.0% (253)
White alone - Speak only English Native:
97.9% (25,298)Foreign-born:
41.7% (409)
White alone - Speak another language Native:
1.9% (504)Foreign-born:
57.1% (561)
Hispanic or Latino - Speak only English Native:
65.3% (625)Foreign-born:
5.6% (18)
Hispanic or Latino - Speak another language Native:
32.1% (307)Foreign-born:
95.4% (303)
Foreign-born residents in Franklin Town
Marital status for residents in Franklin Town Marital status - White (Caucasian) population 15 years and over
Males 36.5% Never married56.9% Now married0.5% Separated1.1% Widowed5.0% DivorcedFemales 28.4% Never married52.5% Now married1.8% Separated7.6% Widowed9.7% DivorcedWomen who gave birth in the past 12 months Now married:
98.9% (169)Unmarried:
1.1% (2)
Women who did not give birth in the past 12 months Now married:
42.7% (2,554)Unmarried:
57.3% (3,430)
Marital status - Black or African American population 15 years and over
Males 48.6% Never married39.7% Now married0.0% Separated0.0% Widowed11.6% DivorcedFemales 56.9% Never married27.3% Now married10.9% Separated2.3% Widowed2.6% DivorcedWomen who did not give birth in the past 12 months Now married:
34.9% (87)Unmarried:
65.1% (162)
Marital status - Asian population 15 years and over
Males 13.5% Never married83.1% Now married0.0% Separated0.0% Widowed3.4% DivorcedFemales 25.1% Never married63.0% Now married0.0% Separated10.3% Widowed1.6% DivorcedWomen who gave birth in the past 12 months Now married:
100.0% (25)Unmarried:
0.0% (0)
Women who did not give birth in the past 12 months Now married:
64.3% (365)Unmarried:
35.7% (203)
Marital status - Other race population 15 years and over
Males 100.0% Never married0.0% Now married0.0% Separated0.0% Widowed0.0% DivorcedFemales 37.3% Never married62.7% Now married0.0% Separated0.0% Widowed0.0% DivorcedWomen who did not give birth in the past 12 months Now married:
0.0% (0)Unmarried:
100.0% (35)
Marital status - Two or more races population 15 years and over
Males 29.2% Never married56.8% Now married0.0% Separated0.0% Widowed13.9% DivorcedFemales 47.4% Never married44.0% Now married0.0% Separated0.0% Widowed8.5% DivorcedWomen who did not give birth in the past 12 months Now married:
33.0% (195)Unmarried:
67.0% (398)
Marital status - White alone, not Hispanic / Latino population 15 years and over
Males 36.1% Never married57.2% Now married0.5% Separated1.1% Widowed5.1% DivorcedFemales 28.0% Never married52.9% Now married1.6% Separated7.5% Widowed10.0% DivorcedWomen who gave birth in the past 12 months Now married:
98.9% (172)Unmarried:
1.1% (2)
Women who did not give birth in the past 12 months Now married:
42.5% (2,470)Unmarried:
57.5% (3,347)
Marital status - Hispanic or Latino population 15 years and over
Males 49.2% Never married47.6% Now married0.0% Separated0.0% Widowed3.2% DivorcedFemales 44.3% Never married34.9% Now married5.4% Separated7.5% Widowed7.9% DivorcedWomen who did not give birth in the past 12 months Now married:
35.9% (184)Unmarried:
64.1% (329)
Ancestries in Franklin Town
2,562 19.3% Irish2,205 16.6% Italian1,074 8.1% American835 6.3% English613 4.6% Romanian457 3.4% European453 3.4% French Canadian306 2.3% German286 2.2% Polish218 1.6% French173 1.3% Scottish133 1.0% Eastern European125 0.9% Cape Verdean116 0.9% Ethiopian100 0.8% Portuguese94 0.7% Russian82 0.6% British71 0.5% Greek58 0.4% Haitian51 0.4% Australian49 0.4% Egyptian49 0.4% Somali45 0.3% Canadian42 0.3% Jordanian39 0.3% Lithuanian36 0.3% Syrian35 0.3% Armenian34 0.3% Dutch31 0.2% Czechoslovakian30 0.2% Hungarian25 0.2% Slovak24 0.2% Lebanese22 0.2% Scotch-Irish19 0.1% Finnish15 0.1% Luxembourger14 0.1% Northern European11 0.08% Norwegian10 0.08% Belizean9 0.07% Swedish8 0.06% Scandinavian8 0.06% Austrian7 0.05% Celtic6 0.05% Welsh5 0.04% African3 0.02% Pennsylvania German
Geographical mobility in Franklin Town Same house 1 year ago 25,064 90.8% White (Caucasian)486 98.3% Black or African American6 41.2% American Indian / Alaska Native1,656 87.8% Asian110 99.3% Other race1,636 85.3% Two or more races24,781 90.9% White alone, not Hispanic / Latino1,191 80.5% Hispanic or LatinoMoved within same county 1,098 4.0% White / Caucasian2 0.4% Black or African American117 6.2% Asian91 4.8% Two or more races1,098 4.0% White alone, not Hispanic / Latino72 4.8% Hispanic or LatinoMoved within same state 529 1.9% White / Caucasian5 1.1% Black or African American11 77.9% American Indian / Alaska Native154 8.0% Two or more races469 1.7% White alone, not Hispanic / Latino142 9.6% Hispanic or LatinoMoved from different state 883 3.2% White / Caucasian8 1.7% Black or African American64 3.4% Asian6 0.3% Two or more races870 3.2% White alone, not Hispanic / Latino20 1.4% Hispanic or LatinoMoved from abroad 41 0.1% White42 2.2% Asian44 0.2% White alone, not Hispanic / Latino
Children Nativity (place of birth) in Franklin Town
Children under 6 years - Living with two parents Both parents native 1,081 100.0% NativeBoth parents foreign-born 204 100.0% NativeOne native, one foreign-born parent 195 100.0% NativeChildren under 6 years - Living with one parent Native parent 72 100.0% NativeForeign-born parent 24 100.0% NativeChildren 6 to 17 years - Living with two parents Both parents native 3,526 99.9% Native5 0.1% Foreign-bornBoth parents foreign-born 478 89.2% Native58 10.8% Foreign-bornOne native, one foreign-born parent 95 100.0% NativeChildren 6 to 17 years - Living with one parent Native parent 611 100.0% NativeForeign-born parent 67 51.2% Native64 48.8% Foreign-born
Grandparents responsible for own grandchildren in Franklin Town
Grandparents (30 to 59 years) White / Caucasian 9 23.0% Responsible for grandchildren31 77.0% Not responsible for grandchildrenWhite alone, not Hispanic / Latino 10 23.3% Responsible for grandchildren34 76.7% Not responsible for grandchildren
Grandparents (60 years and over) White / Caucasian 278 100.0% Not responsible for grandchildrenWhite alone, not Hispanic / Latino 279 100.0% Not responsible for grandchildren