Races in Gladstone, Oregon (OR) Detailed Stats
Data:
Races - White alone (%)
Races - White alone (% change since 2000)
Races - Black alone (%)
Races - Black alone (% change since 2000)
Races - American Indian alone (%)
Races - American Indian alone (% change since 2000)
Races - Asian alone (%)
Races - Asian alone (% change since 2000)
Races - Hispanic (%)
Races - Hispanic (% change since 2000)
Races - Native Hawaiian and Other Pacific Islander alone (%)
Races - Native Hawaiian and Other Pacific Islander alone (% change since 2000)
Races - Two or more races(%)
Races - Two or more races(% change since 2000)
Races - Other race alone (%)
Races - Other race alone (% change since 2000)
Racial diversity
Place of birth - Born in state of residence (%)
Place of birth - Born in state of residence (%) - White
Place of birth - Born in state of residence (%) - Black or African American
Place of birth - Born in state of residence (%) - Asian
Place of birth - Born in state of residence (%) - Hispanic or Latino
Place of birth - Born in state of residence (%) - American Indian and Alaska Native
Place of birth - Born in state of residence (%) - Multirace
Place of birth - Born in state of residence (%) - Other Race
Place of birth - Born in other state (%)
Place of birth - Born in other state (%) - White
Place of birth - Born in other state (%) - Black or African American
Place of birth - Born in other state (%) - Asian
Place of birth - Born in other state (%) - Hispanic or Latino
Place of birth - Born in other state (%) - American Indian and Alaska Native
Place of birth - Born in other state (%) - Multirace
Place of birth - Born in other state (%) - Other Race
Place of birth - Native, outside of US (%)
Place of birth - Native, outside of US (%) - White
Place of birth - Native, outside of US (%) - Black or African American
Place of birth - Native, outside of US (%) - Asian
Place of birth - Native, outside of US (%) - Hispanic or Latino
Place of birth - Native, outside of US (%) - American Indian and Alaska Native
Place of birth - Native, outside of US (%) - Multirace
Place of birth - Native, outside of US (%) - Other Race
Place of birth - Foreign born (%)
Place of birth - Foreign born (%) - White
Place of birth - Foreign born (%) - Black or African American
Place of birth - Foreign born (%) - Asian
Place of birth - Foreign born (%) - Hispanic or Latino
Place of birth - Foreign born (%) - American Indian and Alaska Native
Place of birth - Foreign born (%) - Multirace
Place of birth - Foreign born (%) - Other Race
Residents speaking English at home (%)
Residents speaking English at home - Born in the United States (%)
Residents speaking English at home - Native, born elsewhere (%)
Residents speaking English at home - Foreign born (%)
Residents speaking Spanish at home (%)
Residents speaking Spanish at home - Born in the United States (%)
Residents speaking Spanish at home - Native, born elsewhere (%)
Residents speaking Spanish at home - Foreign born (%)
Residents speaking other language at home (%)
Residents speaking other language at home - Born in the United States (%)
Residents speaking other language at home - Native, born elsewhere (%)
Residents speaking other language at home - Foreign born (%)
Marital status - Never married (%)
Marital status - Now married (%)
Marital status - Separated (%)
Marital status - Widowed (%)
Marital status - Divorced (%)
Ancestries Reported - Arab (%)
Ancestries Reported - Czech (%)
Ancestries Reported - Danish (%)
Ancestries Reported - Dutch (%)
Ancestries Reported - English (%)
Ancestries Reported - French (%)
Ancestries Reported - French Canadian (%)
Ancestries Reported - German (%)
Ancestries Reported - Greek (%)
Ancestries Reported - Hungarian (%)
Ancestries Reported - Irish (%)
Ancestries Reported - Italian (%)
Ancestries Reported - Lithuanian (%)
Ancestries Reported - Norwegian (%)
Ancestries Reported - Polish (%)
Ancestries Reported - Portuguese (%)
Ancestries Reported - Russian (%)
Ancestries Reported - Scotch-Irish (%)
Ancestries Reported - Scottish (%)
Ancestries Reported - Slovak (%)
Ancestries Reported - Subsaharan African (%)
Ancestries Reported - Swedish (%)
Ancestries Reported - Swiss (%)
Ancestries Reported - Ukrainian (%)
Ancestries Reported - United States (%)
Ancestries Reported - Welsh (%)
Ancestries Reported - West Indian (%)
Ancestries Reported - Other (%)
Geographical mobility - Same house 1 year ago (%)
Geographical mobility - Same house 1 year ago (%) - White
Geographical mobility - Same house 1 year ago (%) - Black or African American
Geographical mobility - Same house 1 year ago (%) - Asian
Geographical mobility - Same house 1 year ago (%) - Hispanic or Latino
Geographical mobility - Same house 1 year ago (%) - American Indian and Alaska Native
Geographical mobility - Same house 1 year ago (%) - Multirace
Geographical mobility - Same house 1 year ago (%) - Other Race
Geographical mobility - Moved within same county (%)
Geographical mobility - Moved within same county (%) - White
Geographical mobility - Moved within same county (%) - Black or African American
Geographical mobility - Moved within same county (%) - Asian
Geographical mobility - Moved within same county (%) - Hispanic or Latino
Geographical mobility - Moved within same county (%) - American Indian and Alaska Native
Geographical mobility - Moved within same county (%) - Multirace
Geographical mobility - Moved within same county (%) - Other Race
Geographical mobility - Moved from different county within same state (%)
Geographical mobility - Moved from different county within same state (%) - White
Geographical mobility - Moved from different county within same state (%) - Black or African American
Geographical mobility - Moved from different county within same state (%) - Asian
Geographical mobility - Moved from different county within same state (%) - Hispanic or Latino
Geographical mobility - Moved from different county within same state (%) - American Indian and Alaska Native
Geographical mobility - Moved from different county within same state (%) - Multirace
Geographical mobility - Moved from different county within same state (%) - Other Race
Geographical mobility - Moved from different state (%)
Geographical mobility - Moved from different state (%) - White
Geographical mobility - Moved from different state (%) - Black or African American
Geographical mobility - Moved from different state (%) - Asian
Geographical mobility - Moved from different state (%) - Hispanic or Latino
Geographical mobility - Moved from different state (%) - American Indian and Alaska Native
Geographical mobility - Moved from different state (%) - Multirace
Geographical mobility - Moved from different state (%) - Other Race
Geographical mobility - Moved from abroad (%)
Geographical mobility - Moved from abroad (%) - White
Geographical mobility - Moved from abroad (%) - Black or African American
Geographical mobility - Moved from abroad (%) - Asian
Geographical mobility - Moved from abroad (%) - Hispanic or Latino
Geographical mobility - Moved from abroad (%) - American Indian and Alaska Native
Geographical mobility - Moved from abroad (%) - Multirace
Geographical mobility - Moved from abroad (%) - Other Race
Place of birth for the foreign-born population - Ireland (%)
Place of birth for the foreign-born population - Denmark (%)
Place of birth for the foreign-born population - Norway (%)
Place of birth for the foreign-born population - Sweden (%)
Place of birth for the foreign-born population - United Kingdom (%)
Place of birth for the foreign-born population - England (%)
Place of birth for the foreign-born population - Scotland (%)
Place of birth for the foreign-born population - Other Northern Europe (%)
Place of birth for the foreign-born population - Austria (%)
Place of birth for the foreign-born population - Belgium (%)
Place of birth for the foreign-born population - France (%)
Place of birth for the foreign-born population - Germany (%)
Place of birth for the foreign-born population - Netherlands (%)
Place of birth for the foreign-born population - Switzerland (%)
Place of birth for the foreign-born population - Other Western Europe (%)
Place of birth for the foreign-born population - Greece (%)
Place of birth for the foreign-born population - Italy (%)
Place of birth for the foreign-born population - Portugal (%)
Place of birth for the foreign-born population - Spain (%)
Place of birth for the foreign-born population - Other Southern Europe (%)
Place of birth for the foreign-born population - Albania (%)
Place of birth for the foreign-born population - Belarus (%)
Place of birth for the foreign-born population - Bosnia and Herzegovina (%)
Place of birth for the foreign-born population - Bulgaria (%)
Place of birth for the foreign-born population - Croatia (%)
Place of birth for the foreign-born population - Czechoslovakia (%)
Place of birth for the foreign-born population - Hungary (%)
Place of birth for the foreign-born population - Latvia (%)
Place of birth for the foreign-born population - Lithuania (%)
Place of birth for the foreign-born population - North Macedonia (Macedonia) (%)
Place of birth for the foreign-born population - Moldova (%)
Place of birth for the foreign-born population - Poland (%)
Place of birth for the foreign-born population - Romania (%)
Place of birth for the foreign-born population - Russia (%)
Place of birth for the foreign-born population - Serbia (%)
Place of birth for the foreign-born population - Ukraine (%)
Place of birth for the foreign-born population - Other Eastern Europe (%)
Place of birth for the foreign-born population - China (%)
Place of birth for the foreign-born population - Hong Kong (%)
Place of birth for the foreign-born population - Taiwan (%)
Place of birth for the foreign-born population - Japan (%)
Place of birth for the foreign-born population - Korea (%)
Place of birth for the foreign-born population - Other Eastern Asia (%)
Place of birth for the foreign-born population - Afghanistan (%)
Place of birth for the foreign-born population - Bangladesh (%)
Place of birth for the foreign-born population - India (%)
Place of birth for the foreign-born population - Iran (%)
Place of birth for the foreign-born population - Kazakhstan (%)
Place of birth for the foreign-born population - Nepal (%)
Place of birth for the foreign-born population - Pakistan (%)
Place of birth for the foreign-born population - Sri Lanka (%)
Place of birth for the foreign-born population - Uzbekistan (%)
Place of birth for the foreign-born population - Other South Central Asia (%)
Place of birth for the foreign-born population - Burma (%)
Place of birth for the foreign-born population - Cambodia (%)
Place of birth for the foreign-born population - Indonesia (%)
Place of birth for the foreign-born population - Laos (%)
Place of birth for the foreign-born population - Malaysia (%)
Place of birth for the foreign-born population - Philippines (%)
Place of birth for the foreign-born population - Singapore (%)
Place of birth for the foreign-born population - Thailand (%)
Place of birth for the foreign-born population - Vietnam (%)
Place of birth for the foreign-born population - Other South Eastern Asia (%)
Place of birth for the foreign-born population - Armenia (%)
Place of birth for the foreign-born population - Iraq (%)
Place of birth for the foreign-born population - Israel (%)
Place of birth for the foreign-born population - Jordan (%)
Place of birth for the foreign-born population - Kuwait (%)
Place of birth for the foreign-born population - Lebanon (%)
Place of birth for the foreign-born population - Saudi Arabia (%)
Place of birth for the foreign-born population - Syria (%)
Place of birth for the foreign-born population - Turkey (%)
Place of birth for the foreign-born population - Yemen (%)
Place of birth for the foreign-born population - Other Western Asia (%)
Place of birth for the foreign-born population - Eritrea (%)
Place of birth for the foreign-born population - Ethiopia (%)
Place of birth for the foreign-born population - Kenya (%)
Place of birth for the foreign-born population - Somalia (%)
Place of birth for the foreign-born population - Uganda (%)
Place of birth for the foreign-born population - Zimbabwe (%)
Place of birth for the foreign-born population - Other Eastern Africa (%)
Place of birth for the foreign-born population - Cameroon (%)
Place of birth for the foreign-born population - Congo (%)
Place of birth for the foreign-born population - Democratic Republic of Congo (Zaire) (%)
Place of birth for the foreign-born population - Other Middle Africa (%)
Place of birth for the foreign-born population - Egypt (%)
Place of birth for the foreign-born population - Morocco (%)
Place of birth for the foreign-born population - Sudan (%)
Place of birth for the foreign-born population - Other Northern Africa (%)
Place of birth for the foreign-born population - South Africa (%)
Place of birth for the foreign-born population - Other Southern Africa (%)
Place of birth for the foreign-born population - Cabo Verde (%)
Place of birth for the foreign-born population - Ghana (%)
Place of birth for the foreign-born population - Liberia (%)
Place of birth for the foreign-born population - Nigeria (%)
Place of birth for the foreign-born population - Senegal (%)
Place of birth for the foreign-born population - Sierra Leone (%)
Place of birth for the foreign-born population - Other Western Africa (%)
Place of birth for the foreign-born population - Australia (%)
Place of birth for the foreign-born population - New Zealand (%)
Place of birth for the foreign-born population - Fiji (%)
Place of birth for the foreign-born population - Micronesia (%)
Place of birth for the foreign-born population - Bahamas (%)
Place of birth for the foreign-born population - Barbados (%)
Place of birth for the foreign-born population - Cuba (%)
Place of birth for the foreign-born population - Dominica (%)
Place of birth for the foreign-born population - Dominican Republic (%)
Place of birth for the foreign-born population - Grenada (%)
Place of birth for the foreign-born population - Haiti (%)
Place of birth for the foreign-born population - Jamaica (%)
Place of birth for the foreign-born population - St. Vincent and the Grenadines (%)
Place of birth for the foreign-born population - Trinidad and Tobago (%)
Place of birth for the foreign-born population - West Indies (%)
Place of birth for the foreign-born population - Other Caribbean (%)
Place of birth for the foreign-born population - Belize (%)
Place of birth for the foreign-born population - Costa Rica (%)
Place of birth for the foreign-born population - El Salvador (%)
Place of birth for the foreign-born population - Guatemala (%)
Place of birth for the foreign-born population - Honduras (%)
Place of birth for the foreign-born population - Mexico (%)
Place of birth for the foreign-born population - Nicaragua (%)
Place of birth for the foreign-born population - Panama (%)
Place of birth for the foreign-born population - Other Central America (%)
Place of birth for the foreign-born population - Argentina (%)
Place of birth for the foreign-born population - Bolivia (%)
Place of birth for the foreign-born population - Brazil (%)
Place of birth for the foreign-born population - Chile (%)
Place of birth for the foreign-born population - Colombia (%)
Place of birth for the foreign-born population - Ecuador (%)
Place of birth for the foreign-born population - Guyana (%)
Place of birth for the foreign-born population - Peru (%)
Place of birth for the foreign-born population - Uruguay (%)
Place of birth for the foreign-born population - Venezuela (%)
Place of birth for the foreign-born population - Other South America (%)
Place of birth for the foreign-born population - Canada (%)
Place of birth for the foreign-born population - Other Northern America (%)
Place of birth for the foreign-born population - Other (%)
Latest news about races in Gladstone, OR collected exclusively by city-data.com from local newspapers, TV, and radio stations
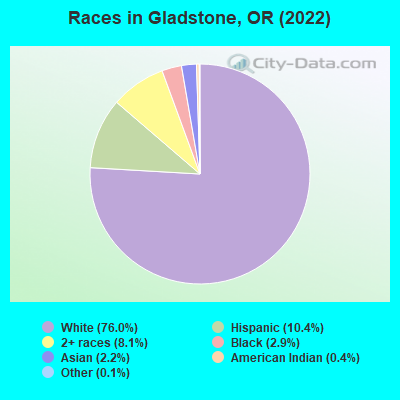
According to 2022 data, the most numerous races in Gladstone, OR are White alone (9,167 residents), Hispanic (1,249 residents), and Two or more races (982 residents). 93.4% of Gladstone residents speak English at home. 6.0% of Gladstone, OR residents are foreign-born (2.9% born in Latin America, 2.3% born in Asia), which is 49.1% less than the foreign-born rate of 9.0% across the entire state of Oregon.
Race distribution in Gladstone
2000 2022
2,857,616 83.5% White alone 275,314 8.0% Hispanic 100,333 2.9% Asian alone 82,733 2.4% Two or more races 53,325 1.6% Black alone 40,130 1.2% American Indian alone 7,398 0.2% Native Hawaiian and Other 4,550 0.1% Other race alone
3,037,571 71.6% White alone 609,538 14.4% Hispanic 252,744 6.0% Two or more races 191,283 4.5% Asian alone 78,228 1.8% Black alone 29,399 0.7% American Indian alone 25,731 0.6% Other race alone 15,643 0.4% Native Hawaiian and Other
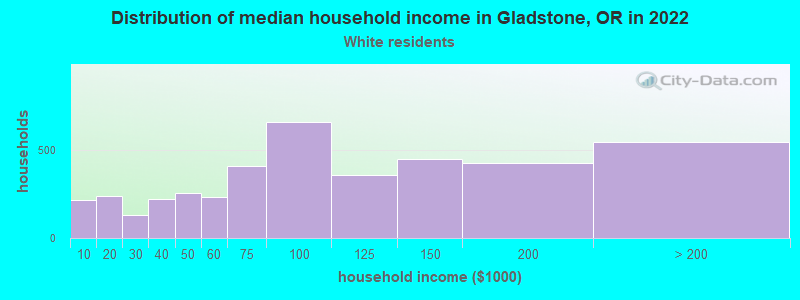
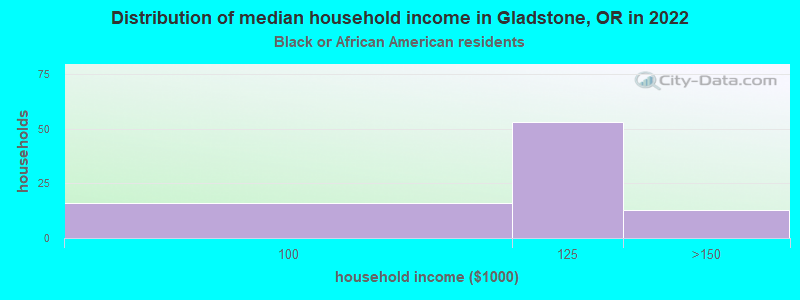
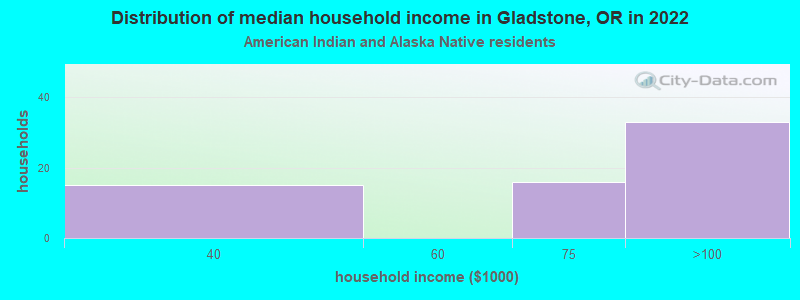
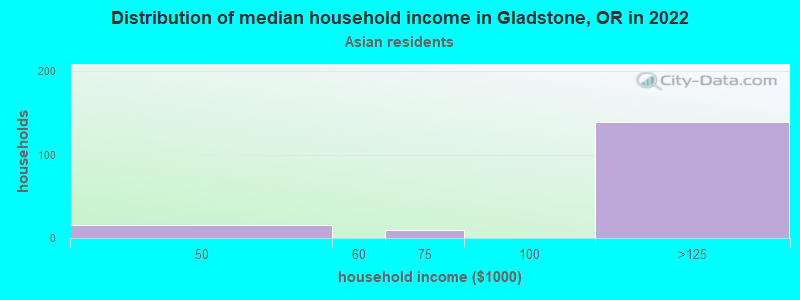
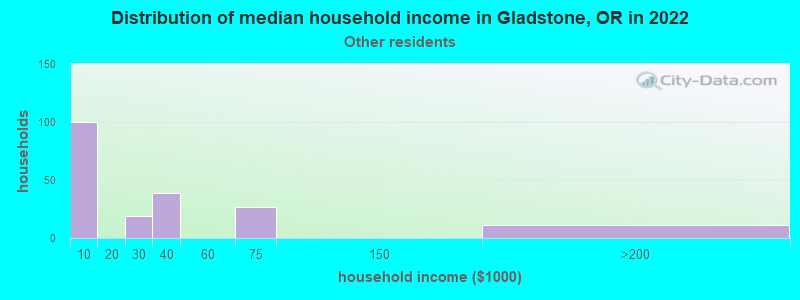
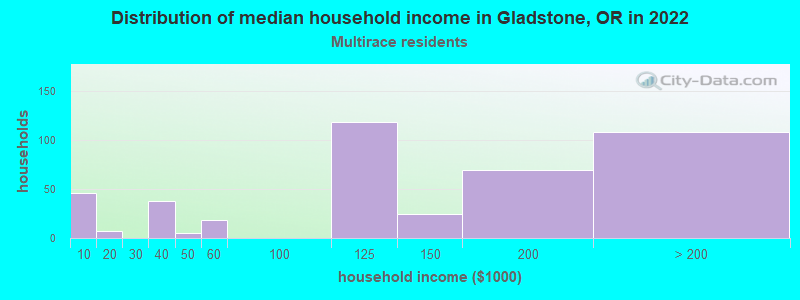
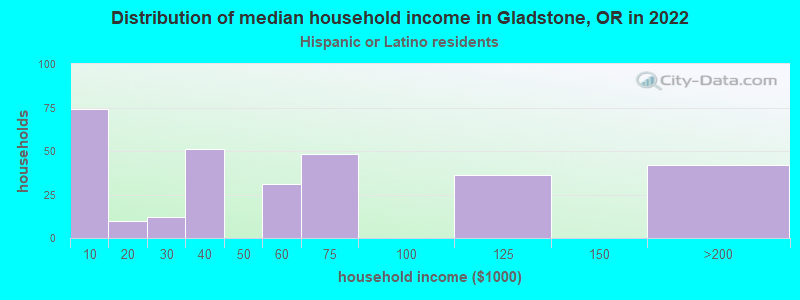
Income and house value in Gladstone Median household income in 2022 $85,821 White non-Hispanic householders$178,344 Black householders$99,128 American Indian and Alaska Native householders$116,780 Asian householders$169,525 Two or more races householders$56,523 Hispanic or Latino race householdersMedian 2022 house value $518,674 White Non-Hispanic householders$472,770 American Indian or Alaska Native householders $670,123 Asian householders$478,079 Some other race householders$296,652 Two or more races householders$597,365 Hispanic or Latino householders
Median age by race in Gladstone
47.9 Median age for White residents41.7 54.6 21.6 Median age for Black or African American residents27.0 2.6 30.1 Median age for American Indian / Alaska Native residents29.4 -684,287,811.4 53.1 Median age for Asian residents27.8 74.1 -764,705,881.6 Median age for Native Hawaiian / Pacific Islander residents-764,119,600.6 -774,891,774.1 48.3 Median age for Other race residents28.6 52.0 31.2 Median age for Two or more races residents27.6 38.4 50.2 Median age for White alone residents43.8 55.4 27.1 Median age for Hispanic or Latino residents25.2 33.0
Owner/renter occupied households by race in Gladstone
House owners and renters - White residents 2,701 65.4% Owner occupied1,426 34.6% Renter occupiedHouse owners and renters - Black or African American residents 9 8.8% Owner occupied95 91.2% Renter occupiedHouse owners and renters - American Indian / Alaska Native residents 25 24.2% Owner occupied77 75.8% Renter occupiedHouse owners and renters - Asian residents 100 100.0% Owner occupiedHouse owners and renters - Other race residents 139 82.7% Owner occupied29 17.3% Renter occupiedHouse owners and renters - Two or more races residents 281 64.4% Owner occupied155 35.6% Renter occupiedHouse owners and renters - White alone residents 2,687 65.0% Owner occupied1,446 35.0% Renter occupiedHouse owners and renters - Hispanic or Latino residents 243 78.6% Owner occupied66 21.4% Renter occupied
Language usage in Gladstone
English speakers - Total 93.4% of residents of Gladstone speak English at home.
5.1% of residents speak Spanish at home 385 64.9% Speak English very well208 35.1% Speak English less than very well1.5% of residents speak other language at home 142 83.5% Speak English very well28 16.5% Speak English less than very well
English speakers - Born in the United States 93.9% of residents of Gladstone speak English at home.
6.2% of residents speak Spanish at home 237 80.3% Speak English very well58 19.7% Speak English less than very well
English speakers - Native, born elsewhere 71.3% of residents of Gladstone speak English at home.
18.2% of residents speak Spanish at home 25 96.2% Speak English very well1 3.8% Speak English less than very well
English speakers - Foreign-born 46.2% of residents of Gladstone speak English at home.
32.8% of residents speak Spanish at home 67 30.5% Speak English very well153 69.5% Speak English less than very well16.1% of residents speak other language at home 86 79.6% Speak English very well22 20.4% Speak English less than very well
White (Caucasian) - Speak only English Native:
97.5% (9,109)Foreign-born:
100.0% (68)
White (Caucasian) - Speak another language Native:
2.6% (245)Foreign-born:
12.0% (8)
Black or African American - Speak only English Native:
99.5% (206)Foreign-born:
100.0% (14)
American Indian / Alaska Native - Speak another language Native:
98.7% (45)Foreign-born:
100.0% (84)
Asian - Speak only English Native:
100.0% (74)Foreign-born:
27.3% (50)
Other race - Speak only English Native:
78.5% (241)Foreign-born:
26.4% (71)
Other race - Speak another language Native:
25.3% (78)Foreign-born:
76.8% (206)
Two or more races - Speak only English Native:
94.0% (948)Foreign-born:
100.0% (146)
White alone - Speak only English Native:
98.7% (8,927)Foreign-born:
88.9% (66)
White alone - Speak another language Native:
1.3% (116)Foreign-born:
15.5% (12)
Hispanic or Latino - Speak only English Native:
72.3% (669)Foreign-born:
25.3% (73)
Hispanic or Latino - Speak another language Native:
28.4% (263)Foreign-born:
73.4% (211)
Foreign-born residents in Gladstone 728 residents are foreign born (2.9% Latin America , 2.3% Asia ).
This city:
6.0%Oregon:
9.8%
Marital status for residents in Gladstone Marital status - White (Caucasian) population 15 years and over
Males 36.2% Never married49.0% Now married1.1% Separated2.2% Widowed11.4% DivorcedFemales 22.5% Never married50.4% Now married1.6% Separated9.2% Widowed16.3% DivorcedWomen who gave birth in the past 12 months Now married:
100.0% (39)Unmarried:
0.0% (0)
Women who did not give birth in the past 12 months Now married:
47.7% (799)Unmarried:
52.3% (877)
Marital status - Black or African American population 15 years and over
Males 68.9% Never married6.1% Now married25.0% Separated0.0% Widowed0.0% DivorcedFemales 100.0% Never married0.0% Now married0.0% Separated0.0% Widowed0.0% DivorcedWomen who did not give birth in the past 12 months Now married:
0.0% (0)Unmarried:
100.0% (7)
Marital status - American Indian / Alaska Native population 15 years and over
Males 82.4% Never married17.6% Now married0.0% Separated0.0% Widowed0.0% DivorcedFemales 100.0% Never married0.0% Now married0.0% Separated0.0% Widowed0.0% DivorcedMarital status - Asian population 15 years and over
Males 40.4% Never married59.6% Now married0.0% Separated0.0% Widowed0.0% DivorcedFemales 38.8% Never married15.8% Now married0.0% Separated45.4% Widowed0.0% DivorcedWomen who did not give birth in the past 12 months Now married:
20.3% (12)Unmarried:
79.7% (48)
Marital status - Other race population 15 years and over
Males 63.9% Never married36.1% Now married0.0% Separated0.0% Widowed0.0% DivorcedFemales 10.3% Never married42.7% Now married24.9% Separated0.0% Widowed22.2% DivorcedWomen who did not give birth in the past 12 months Now married:
65.5% (124)Unmarried:
34.5% (66)
Marital status - Two or more races population 15 years and over
Males 54.6% Never married37.6% Now married0.0% Separated0.0% Widowed7.8% DivorcedFemales 41.5% Never married34.6% Now married0.0% Separated6.0% Widowed17.9% DivorcedWomen who gave birth in the past 12 months Now married:
0.0% (0)Unmarried:
100.0% (46)
Women who did not give birth in the past 12 months Now married:
43.8% (171)Unmarried:
56.2% (219)
Marital status - White alone, not Hispanic / Latino population 15 years and over
Males 34.9% Never married50.0% Now married1.1% Separated2.2% Widowed11.7% DivorcedFemales 21.9% Never married50.8% Now married1.6% Separated9.3% Widowed16.4% DivorcedWomen who gave birth in the past 12 months Now married:
100.0% (40)Unmarried:
0.0% (0)
Women who did not give birth in the past 12 months Now married:
48.6% (811)Unmarried:
51.4% (859)
Marital status - Hispanic or Latino population 15 years and over
Males 66.2% Never married33.8% Now married0.0% Separated0.0% Widowed0.0% DivorcedFemales 36.8% Never married36.2% Now married14.2% Separated0.0% Widowed12.7% DivorcedWomen who did not give birth in the past 12 months Now married:
51.5% (145)Unmarried:
48.5% (137)
Ancestries in Gladstone
906 17.6% German576 11.2% American376 7.3% European265 5.2% English224 4.4% Irish223 4.3% Norwegian139 2.7% Australian112 2.2% Italian80 1.6% Eastern European78 1.5% Northern European77 1.5% Scandinavian76 1.5% Scottish70 1.4% Iranian47 0.9% Trinidadian and Tobagonian44 0.9% Welsh38 0.7% Czechoslovakian32 0.6% French29 0.6% French Canadian26 0.5% Czech23 0.4% Armenian21 0.4% British21 0.4% Haitian19 0.4% Finnish16 0.3% Austrian16 0.3% Polish16 0.3% Scotch-Irish13 0.3% Dutch10 0.2% Portuguese10 0.2% Russian5 0.10% Greek4 0.08% Swiss3 0.06% African
Children Nativity (place of birth) in Gladstone
Children under 6 years - Living with two parents Both parents native 309 100.0% NativeChildren under 6 years - Living with one parent Native parent 117 100.0% NativeChildren 6 to 17 years - Living with two parents Both parents native 555 100.0% NativeBoth parents foreign-born 22 100.0% NativeOne native, one foreign-born parent 2 100.0% NativeChildren 6 to 17 years - Living with one parent Native parent 814 100.0% NativeForeign-born parent 94 47.4% Native104 52.6% Foreign-born
Grandparents responsible for own grandchildren in Gladstone
Grandparents (30 to 59 years) White / Caucasian 25 67.8% Responsible for grandchildren12 32.2% Not responsible for grandchildrenBlack or African American 9 100.0% Not responsible for grandchildrenOther race 36 100.0% Responsible for grandchildrenWhite alone, not Hispanic / Latino 25 79.3% Responsible for grandchildren7 20.7% Not responsible for grandchildrenHispanic or Latino 24 100.0% Responsible for grandchildrenGrandparents (60 years and over) White / Caucasian 57 53.4% Responsible for grandchildren50 46.6% Not responsible for grandchildrenWhite alone, not Hispanic / Latino 57 51.8% Responsible for grandchildren53 48.2% Not responsible for grandchildren