Races in Hanover, Massachusetts (MA) Detailed Stats
Ancestries, Foreign-born residents, place of birth

Recent posts about races in Hanover, Massachusetts on our local forum with over 2,400,000 registered users:
 | Nicer house in Pembroke or hold out for Norwell scituate duxbury? (72 replies) |
| Norwell, Cohasset, Scituate or Hanover? (26 replies) |
| Trying to figure out this house situation (59 replies) |
| 2023 Real Estate Observations (5278 replies) |
| towns that offer the most jobs per dollar of house (58 replies) |
| Towns similar to Hanover? (16 replies) |
Latest news about races in Hanover, MA collected exclusively by city-data.com from local newspapers, TV, and radio stations
2.5% of Hanover, MA residents are foreign-born (1.2% born in Europe, 0.7% born in Asia, 0.4% born in North America), which is 622.4% less than the foreign-born rate of 18.0% across the entire state of Massachusetts.
Race distribution in Hanover

- 12,79897.2%White alone
- 1010.8%Asian alone
- 900.7%Hispanic
- 790.6%Two or more races
- 650.5%Black alone
- 200.2%Other race alone
- 100.08%American Indian alone
- 10.01%Native Hawaiian and Other
Pacific Islander alone

2000
2022
-
- 5,198,35981.9%White alone
- 428,7296.8%Hispanic
- 318,3295.0%Black alone
- 236,7863.7%Asian alone
- 110,3381.7%Two or more races
- 43,5860.7%Other race alone
- 11,2640.2%American Indian alone
- 1,7060.03%Native Hawaiian and Other
Pacific Islander alone

-
- 4,676,62767.0%White alone
- 911,03813.0%Hispanic
- 501,4637.2%Asian alone
- 459,7406.6%Black alone
- 341,8894.9%Two or more races
- 84,4031.2%Other race alone
- 5,8380.08%American Indian alone
- 9760.01%Native Hawaiian and Other
Pacific Islander alone

Income and house value in Hanover
- Median household income in 2022
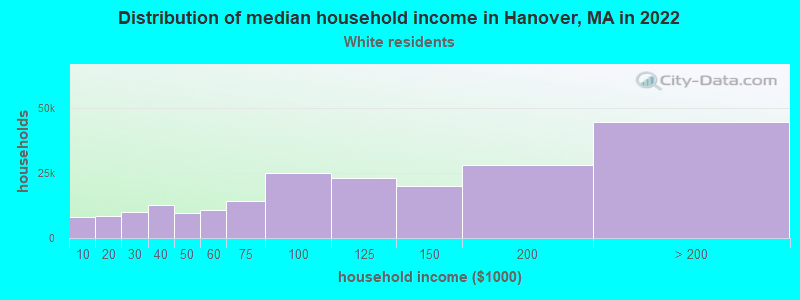
- $138,621White non-Hispanic householders
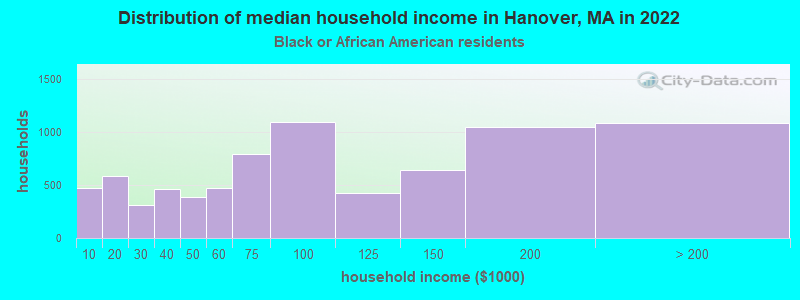
- $43,656Black householders
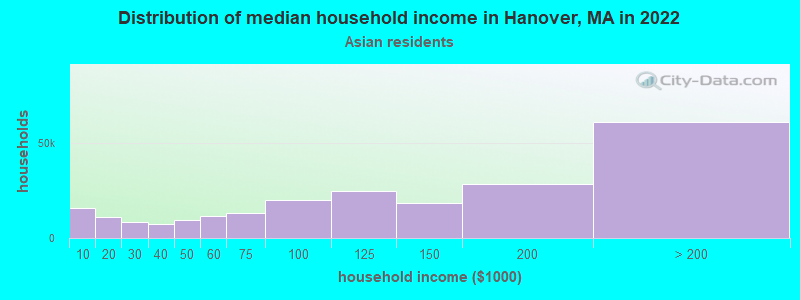
- $106,159Asian householders
- $107,771Some other race householders
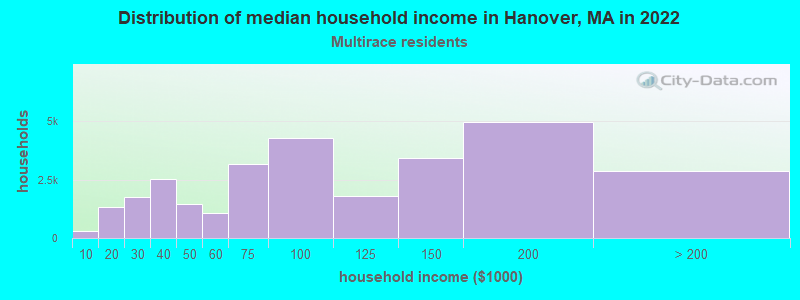
- $186,913Two or more races householders
- $71,883Hispanic or Latino race householders
- Median 2022 house value
- $790,393White Non-Hispanic householders
- $608,833Black or African American householders
- $761,119Asian householders
- $506,063Some other race householders
Household income for White non-Hispanic householders
Household income for Black householders
Household income for Asian householders
Household income for Two or more races householders
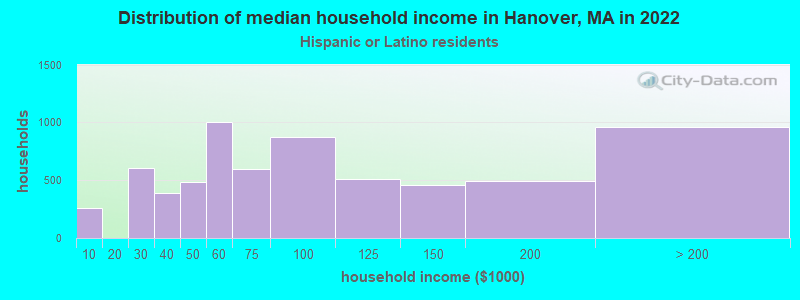
Household income for Hispanic or Latino race householders
Foreign-born residents in Hanover
328 residents are foreign born (1.2% Europe, 0.7% Asia, 0.4% North America).
| This city: | 2.5% |
| Massachusetts: | 12.2% |
Ancestries in Hanover

- 5,20831.0%Irish
- 2,37014.1%Italian
- 2,22513.2%English
- 9335.6%Other
- 8114.8%German
- 7344.4%French
- 6714.0%United States
- 6013.6%French Canadian
- 5193.1%Swedish
- 5043.0%Scotch-Irish
- 4902.9%Scottish
- 3402.0%Lithuanian
- 2981.8%Polish
- 1911.1%Portuguese
- 1841.1%Greek
- 1410.8%Norwegian
- 1370.8%Arab
- 1020.6%Dutch
- 700.4%Russian
- 540.3%Subsaharan African
- 360.2%Czech
- 340.2%Ukrainian
- 310.2%Danish
- 310.2%Welsh
- 300.2%Swiss
- 290.2%West Indian
- 200.1%Slovak
- 110.07%Hungarian

Zip codes: 02339.