Races in Lake Oswego, Oregon (OR) Detailed Stats
Data:
Races - White alone (%)
Races - White alone (% change since 2000)
Races - Black alone (%)
Races - Black alone (% change since 2000)
Races - American Indian alone (%)
Races - American Indian alone (% change since 2000)
Races - Asian alone (%)
Races - Asian alone (% change since 2000)
Races - Hispanic (%)
Races - Hispanic (% change since 2000)
Races - Native Hawaiian and Other Pacific Islander alone (%)
Races - Native Hawaiian and Other Pacific Islander alone (% change since 2000)
Races - Two or more races(%)
Races - Two or more races(% change since 2000)
Races - Other race alone (%)
Races - Other race alone (% change since 2000)
Racial diversity
Place of birth - Born in state of residence (%)
Place of birth - Born in state of residence (%) - White
Place of birth - Born in state of residence (%) - Black or African American
Place of birth - Born in state of residence (%) - Asian
Place of birth - Born in state of residence (%) - Hispanic or Latino
Place of birth - Born in state of residence (%) - American Indian and Alaska Native
Place of birth - Born in state of residence (%) - Multirace
Place of birth - Born in state of residence (%) - Other Race
Place of birth - Born in other state (%)
Place of birth - Born in other state (%) - White
Place of birth - Born in other state (%) - Black or African American
Place of birth - Born in other state (%) - Asian
Place of birth - Born in other state (%) - Hispanic or Latino
Place of birth - Born in other state (%) - American Indian and Alaska Native
Place of birth - Born in other state (%) - Multirace
Place of birth - Born in other state (%) - Other Race
Place of birth - Native, outside of US (%)
Place of birth - Native, outside of US (%) - White
Place of birth - Native, outside of US (%) - Black or African American
Place of birth - Native, outside of US (%) - Asian
Place of birth - Native, outside of US (%) - Hispanic or Latino
Place of birth - Native, outside of US (%) - American Indian and Alaska Native
Place of birth - Native, outside of US (%) - Multirace
Place of birth - Native, outside of US (%) - Other Race
Place of birth - Foreign born (%)
Place of birth - Foreign born (%) - White
Place of birth - Foreign born (%) - Black or African American
Place of birth - Foreign born (%) - Asian
Place of birth - Foreign born (%) - Hispanic or Latino
Place of birth - Foreign born (%) - American Indian and Alaska Native
Place of birth - Foreign born (%) - Multirace
Place of birth - Foreign born (%) - Other Race
Residents speaking English at home (%)
Residents speaking English at home - Born in the United States (%)
Residents speaking English at home - Native, born elsewhere (%)
Residents speaking English at home - Foreign born (%)
Residents speaking Spanish at home (%)
Residents speaking Spanish at home - Born in the United States (%)
Residents speaking Spanish at home - Native, born elsewhere (%)
Residents speaking Spanish at home - Foreign born (%)
Residents speaking other language at home (%)
Residents speaking other language at home - Born in the United States (%)
Residents speaking other language at home - Native, born elsewhere (%)
Residents speaking other language at home - Foreign born (%)
Marital status - Never married (%)
Marital status - Now married (%)
Marital status - Separated (%)
Marital status - Widowed (%)
Marital status - Divorced (%)
Ancestries Reported - Arab (%)
Ancestries Reported - Czech (%)
Ancestries Reported - Danish (%)
Ancestries Reported - Dutch (%)
Ancestries Reported - English (%)
Ancestries Reported - French (%)
Ancestries Reported - French Canadian (%)
Ancestries Reported - German (%)
Ancestries Reported - Greek (%)
Ancestries Reported - Hungarian (%)
Ancestries Reported - Irish (%)
Ancestries Reported - Italian (%)
Ancestries Reported - Lithuanian (%)
Ancestries Reported - Norwegian (%)
Ancestries Reported - Polish (%)
Ancestries Reported - Portuguese (%)
Ancestries Reported - Russian (%)
Ancestries Reported - Scotch-Irish (%)
Ancestries Reported - Scottish (%)
Ancestries Reported - Slovak (%)
Ancestries Reported - Subsaharan African (%)
Ancestries Reported - Swedish (%)
Ancestries Reported - Swiss (%)
Ancestries Reported - Ukrainian (%)
Ancestries Reported - United States (%)
Ancestries Reported - Welsh (%)
Ancestries Reported - West Indian (%)
Ancestries Reported - Other (%)
Geographical mobility - Same house 1 year ago (%)
Geographical mobility - Same house 1 year ago (%) - White
Geographical mobility - Same house 1 year ago (%) - Black or African American
Geographical mobility - Same house 1 year ago (%) - Asian
Geographical mobility - Same house 1 year ago (%) - Hispanic or Latino
Geographical mobility - Same house 1 year ago (%) - American Indian and Alaska Native
Geographical mobility - Same house 1 year ago (%) - Multirace
Geographical mobility - Same house 1 year ago (%) - Other Race
Geographical mobility - Moved within same county (%)
Geographical mobility - Moved within same county (%) - White
Geographical mobility - Moved within same county (%) - Black or African American
Geographical mobility - Moved within same county (%) - Asian
Geographical mobility - Moved within same county (%) - Hispanic or Latino
Geographical mobility - Moved within same county (%) - American Indian and Alaska Native
Geographical mobility - Moved within same county (%) - Multirace
Geographical mobility - Moved within same county (%) - Other Race
Geographical mobility - Moved from different county within same state (%)
Geographical mobility - Moved from different county within same state (%) - White
Geographical mobility - Moved from different county within same state (%) - Black or African American
Geographical mobility - Moved from different county within same state (%) - Asian
Geographical mobility - Moved from different county within same state (%) - Hispanic or Latino
Geographical mobility - Moved from different county within same state (%) - American Indian and Alaska Native
Geographical mobility - Moved from different county within same state (%) - Multirace
Geographical mobility - Moved from different county within same state (%) - Other Race
Geographical mobility - Moved from different state (%)
Geographical mobility - Moved from different state (%) - White
Geographical mobility - Moved from different state (%) - Black or African American
Geographical mobility - Moved from different state (%) - Asian
Geographical mobility - Moved from different state (%) - Hispanic or Latino
Geographical mobility - Moved from different state (%) - American Indian and Alaska Native
Geographical mobility - Moved from different state (%) - Multirace
Geographical mobility - Moved from different state (%) - Other Race
Geographical mobility - Moved from abroad (%)
Geographical mobility - Moved from abroad (%) - White
Geographical mobility - Moved from abroad (%) - Black or African American
Geographical mobility - Moved from abroad (%) - Asian
Geographical mobility - Moved from abroad (%) - Hispanic or Latino
Geographical mobility - Moved from abroad (%) - American Indian and Alaska Native
Geographical mobility - Moved from abroad (%) - Multirace
Geographical mobility - Moved from abroad (%) - Other Race
Place of birth for the foreign-born population - Ireland (%)
Place of birth for the foreign-born population - Denmark (%)
Place of birth for the foreign-born population - Norway (%)
Place of birth for the foreign-born population - Sweden (%)
Place of birth for the foreign-born population - United Kingdom (%)
Place of birth for the foreign-born population - England (%)
Place of birth for the foreign-born population - Scotland (%)
Place of birth for the foreign-born population - Other Northern Europe (%)
Place of birth for the foreign-born population - Austria (%)
Place of birth for the foreign-born population - Belgium (%)
Place of birth for the foreign-born population - France (%)
Place of birth for the foreign-born population - Germany (%)
Place of birth for the foreign-born population - Netherlands (%)
Place of birth for the foreign-born population - Switzerland (%)
Place of birth for the foreign-born population - Other Western Europe (%)
Place of birth for the foreign-born population - Greece (%)
Place of birth for the foreign-born population - Italy (%)
Place of birth for the foreign-born population - Portugal (%)
Place of birth for the foreign-born population - Spain (%)
Place of birth for the foreign-born population - Other Southern Europe (%)
Place of birth for the foreign-born population - Albania (%)
Place of birth for the foreign-born population - Belarus (%)
Place of birth for the foreign-born population - Bosnia and Herzegovina (%)
Place of birth for the foreign-born population - Bulgaria (%)
Place of birth for the foreign-born population - Croatia (%)
Place of birth for the foreign-born population - Czechoslovakia (%)
Place of birth for the foreign-born population - Hungary (%)
Place of birth for the foreign-born population - Latvia (%)
Place of birth for the foreign-born population - Lithuania (%)
Place of birth for the foreign-born population - North Macedonia (Macedonia) (%)
Place of birth for the foreign-born population - Moldova (%)
Place of birth for the foreign-born population - Poland (%)
Place of birth for the foreign-born population - Romania (%)
Place of birth for the foreign-born population - Russia (%)
Place of birth for the foreign-born population - Serbia (%)
Place of birth for the foreign-born population - Ukraine (%)
Place of birth for the foreign-born population - Other Eastern Europe (%)
Place of birth for the foreign-born population - China (%)
Place of birth for the foreign-born population - Hong Kong (%)
Place of birth for the foreign-born population - Taiwan (%)
Place of birth for the foreign-born population - Japan (%)
Place of birth for the foreign-born population - Korea (%)
Place of birth for the foreign-born population - Other Eastern Asia (%)
Place of birth for the foreign-born population - Afghanistan (%)
Place of birth for the foreign-born population - Bangladesh (%)
Place of birth for the foreign-born population - India (%)
Place of birth for the foreign-born population - Iran (%)
Place of birth for the foreign-born population - Kazakhstan (%)
Place of birth for the foreign-born population - Nepal (%)
Place of birth for the foreign-born population - Pakistan (%)
Place of birth for the foreign-born population - Sri Lanka (%)
Place of birth for the foreign-born population - Uzbekistan (%)
Place of birth for the foreign-born population - Other South Central Asia (%)
Place of birth for the foreign-born population - Burma (%)
Place of birth for the foreign-born population - Cambodia (%)
Place of birth for the foreign-born population - Indonesia (%)
Place of birth for the foreign-born population - Laos (%)
Place of birth for the foreign-born population - Malaysia (%)
Place of birth for the foreign-born population - Philippines (%)
Place of birth for the foreign-born population - Singapore (%)
Place of birth for the foreign-born population - Thailand (%)
Place of birth for the foreign-born population - Vietnam (%)
Place of birth for the foreign-born population - Other South Eastern Asia (%)
Place of birth for the foreign-born population - Armenia (%)
Place of birth for the foreign-born population - Iraq (%)
Place of birth for the foreign-born population - Israel (%)
Place of birth for the foreign-born population - Jordan (%)
Place of birth for the foreign-born population - Kuwait (%)
Place of birth for the foreign-born population - Lebanon (%)
Place of birth for the foreign-born population - Saudi Arabia (%)
Place of birth for the foreign-born population - Syria (%)
Place of birth for the foreign-born population - Turkey (%)
Place of birth for the foreign-born population - Yemen (%)
Place of birth for the foreign-born population - Other Western Asia (%)
Place of birth for the foreign-born population - Eritrea (%)
Place of birth for the foreign-born population - Ethiopia (%)
Place of birth for the foreign-born population - Kenya (%)
Place of birth for the foreign-born population - Somalia (%)
Place of birth for the foreign-born population - Uganda (%)
Place of birth for the foreign-born population - Zimbabwe (%)
Place of birth for the foreign-born population - Other Eastern Africa (%)
Place of birth for the foreign-born population - Cameroon (%)
Place of birth for the foreign-born population - Congo (%)
Place of birth for the foreign-born population - Democratic Republic of Congo (Zaire) (%)
Place of birth for the foreign-born population - Other Middle Africa (%)
Place of birth for the foreign-born population - Egypt (%)
Place of birth for the foreign-born population - Morocco (%)
Place of birth for the foreign-born population - Sudan (%)
Place of birth for the foreign-born population - Other Northern Africa (%)
Place of birth for the foreign-born population - South Africa (%)
Place of birth for the foreign-born population - Other Southern Africa (%)
Place of birth for the foreign-born population - Cabo Verde (%)
Place of birth for the foreign-born population - Ghana (%)
Place of birth for the foreign-born population - Liberia (%)
Place of birth for the foreign-born population - Nigeria (%)
Place of birth for the foreign-born population - Senegal (%)
Place of birth for the foreign-born population - Sierra Leone (%)
Place of birth for the foreign-born population - Other Western Africa (%)
Place of birth for the foreign-born population - Australia (%)
Place of birth for the foreign-born population - New Zealand (%)
Place of birth for the foreign-born population - Fiji (%)
Place of birth for the foreign-born population - Micronesia (%)
Place of birth for the foreign-born population - Bahamas (%)
Place of birth for the foreign-born population - Barbados (%)
Place of birth for the foreign-born population - Cuba (%)
Place of birth for the foreign-born population - Dominica (%)
Place of birth for the foreign-born population - Dominican Republic (%)
Place of birth for the foreign-born population - Grenada (%)
Place of birth for the foreign-born population - Haiti (%)
Place of birth for the foreign-born population - Jamaica (%)
Place of birth for the foreign-born population - St. Vincent and the Grenadines (%)
Place of birth for the foreign-born population - Trinidad and Tobago (%)
Place of birth for the foreign-born population - West Indies (%)
Place of birth for the foreign-born population - Other Caribbean (%)
Place of birth for the foreign-born population - Belize (%)
Place of birth for the foreign-born population - Costa Rica (%)
Place of birth for the foreign-born population - El Salvador (%)
Place of birth for the foreign-born population - Guatemala (%)
Place of birth for the foreign-born population - Honduras (%)
Place of birth for the foreign-born population - Mexico (%)
Place of birth for the foreign-born population - Nicaragua (%)
Place of birth for the foreign-born population - Panama (%)
Place of birth for the foreign-born population - Other Central America (%)
Place of birth for the foreign-born population - Argentina (%)
Place of birth for the foreign-born population - Bolivia (%)
Place of birth for the foreign-born population - Brazil (%)
Place of birth for the foreign-born population - Chile (%)
Place of birth for the foreign-born population - Colombia (%)
Place of birth for the foreign-born population - Ecuador (%)
Place of birth for the foreign-born population - Guyana (%)
Place of birth for the foreign-born population - Peru (%)
Place of birth for the foreign-born population - Uruguay (%)
Place of birth for the foreign-born population - Venezuela (%)
Place of birth for the foreign-born population - Other South America (%)
Place of birth for the foreign-born population - Canada (%)
Place of birth for the foreign-born population - Other Northern America (%)
Place of birth for the foreign-born population - Other (%)
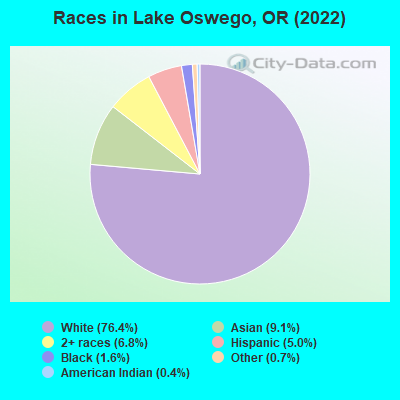
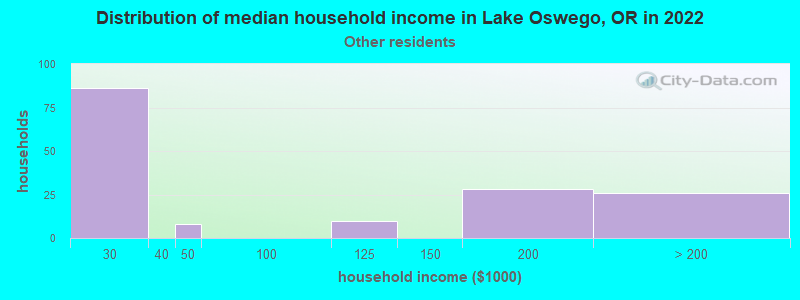
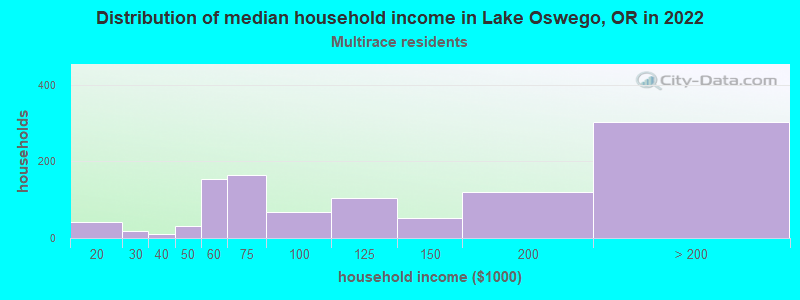
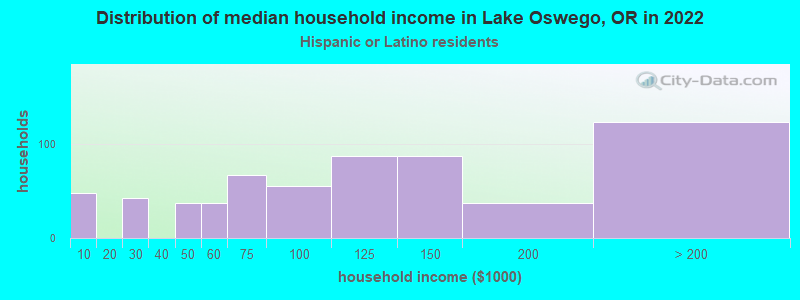
According to 2022 data, the most numerous races in Lake Oswego, OR are White alone (31,078 residents), Hispanic (2,043 residents), and Two or more races (2,781 residents). 88.5% of Lake Oswego residents speak English at home. 11.5% of Lake Oswego, OR residents are foreign-born (6.0% born in Asia, 2.7% born in Europe), which is 21.5% greater than the foreign-born rate of 9.0% across the entire state of Oregon.
Race distribution in Lake Oswego
2000 2022
2,857,616 83.5% White alone 275,314 8.0% Hispanic 100,333 2.9% Asian alone 82,733 2.4% Two or more races 53,325 1.6% Black alone 40,130 1.2% American Indian alone 7,398 0.2% Native Hawaiian and Other 4,550 0.1% Other race alone
3,037,571 71.6% White alone 609,538 14.4% Hispanic 252,744 6.0% Two or more races 191,283 4.5% Asian alone 78,228 1.8% Black alone 29,399 0.7% American Indian alone 25,731 0.6% Other race alone 15,643 0.4% Native Hawaiian and Other
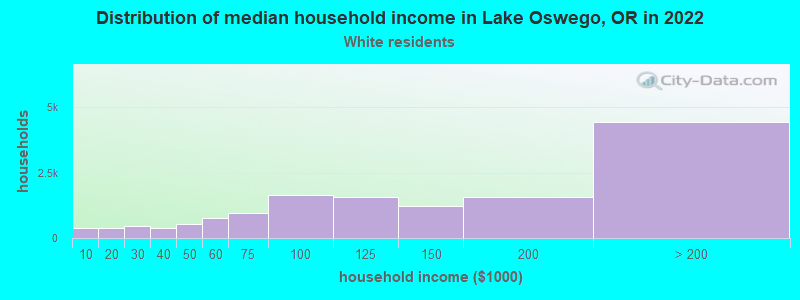
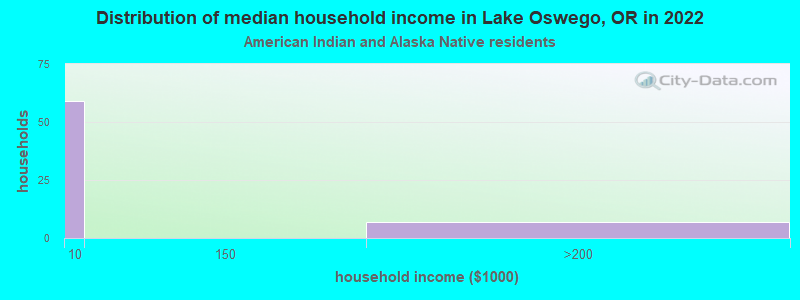
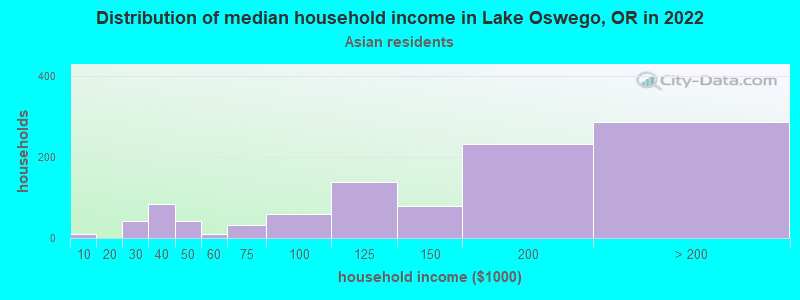
Income and house value in Lake Oswego Median household income in 2022 $124,758 White non-Hispanic householders$193,227 Black householders$190,280 Asian householders$138,880 Two or more races householders$97,242 Hispanic or Latino race householdersMedian 2022 house value $982,348 White Non-Hispanic householdersover $1,000,000 Black or African American householders$704,519 American Indian or Alaska Native householders over $1,000,000 Asian householders$906,426 Some other race householdersover $1,000,000 Two or more races householders$900,789 Hispanic or Latino householders
Median age by race in Lake Oswego
50.9 Median age for White residents48.1 52.9 39.0 Median age for Black or African American residents48.5 35.1 18.8 Median age for American Indian / Alaska Native residents15.2 21.2 41.2 Median age for Asian residents35.7 43.4 18.1 Median age for Native Hawaiian / Pacific Islander residents18.1 -774,891,774.1 31.0 Median age for Other race residents55.0 22.7 28.2 Median age for Two or more races residents20.8 39.4 51.1 Median age for White alone residents48.0 53.0 31.0 Median age for Hispanic or Latino residents29.8 36.9
Owner/renter occupied households by race in Lake Oswego
House owners and renters - White residents 10,089 71.4% Owner occupied4,033 28.6% Renter occupiedHouse owners and renters - Black or African American residents 116 46.9% Owner occupied131 53.1% Renter occupiedHouse owners and renters - American Indian / Alaska Native residents 67 100.0% Renter occupiedHouse owners and renters - Asian residents 820 78.2% Owner occupied229 21.8% Renter occupiedHouse owners and renters - Native Hawaiian / Pacific Islander residents 6 10.2% Owner occupied57 89.8% Renter occupiedHouse owners and renters - Other race residents 106 70.5% Owner occupied44 29.5% Renter occupiedHouse owners and renters - Two or more races residents 698 61.6% Owner occupied435 38.4% Renter occupiedHouse owners and renters - White alone residents 10,010 71.2% Owner occupied4,047 28.8% Renter occupiedHouse owners and renters - Hispanic or Latino residents 349 54.9% Owner occupied286 45.1% Renter occupied
Language usage in Lake Oswego
English speakers - Total 88.5% of residents of Lake Oswego speak English at home.
1.8% of residents speak Spanish at home 654 92.1% Speak English very well56 7.9% Speak English less than very well10.0% of residents speak other language at home 2,921 75.1% Speak English very well967 24.9% Speak English less than very well
English speakers - Born in the United States 94.6% of residents of Lake Oswego speak English at home.
1.6% of residents speak Spanish at home 333 96.0% Speak English very well14 4.0% Speak English less than very well3.7% of residents speak other language at home 768 97.8% Speak English very well17 2.2% Speak English less than very well
English speakers - Native, born elsewhere 66.6% of residents of Lake Oswego speak English at home.
4.1% of residents speak Spanish at home 23 100.0% Speak English very well43.2% of residents speak other language at home 239 98.8% Speak English very well3 1.2% Speak English less than very well
English speakers - Foreign-born 35.2% of residents of Lake Oswego speak English at home.
4.8% of residents speak Spanish at home 167 81.9% Speak English very well37 18.1% Speak English less than very well60.3% of residents speak other language at home 1,500 58.2% Speak English very well1,077 41.8% Speak English less than very well
White (Caucasian) - Speak only English Native:
97.1% (27,776)Foreign-born:
55.7% (756)
White (Caucasian) - Speak another language Native:
3.0% (850)Foreign-born:
47.8% (649)
Black or African American - Speak only English Native:
87.1% (304)Foreign-born:
53.8% (72)
Black or African American - Speak another language Native:
13.4% (47)Foreign-born:
46.6% (63)
American Indian / Alaska Native - Speak only English Native:
100.0% (135)Foreign-born:
86.0% (58)
Asian - Speak only English Native:
79.3% (1,200)Foreign-born:
15.1% (326)
Asian - Speak another language Native:
21.6% (327)Foreign-born:
84.7% (1,830)
Other race - Speak only English Native:
90.3% (314)Foreign-born:
52.8% (39)
Other race - Speak another language Native:
14.8% (51)Foreign-born:
64.5% (48)
Two or more races - Speak only English Native:
91.2% (2,925)Foreign-born:
31.7% (132)
Two or more races - Speak another language Native:
8.8% (283)Foreign-born:
66.6% (277)
White alone - Speak only English Native:
96.9% (27,480)Foreign-born:
49.8% (792)
White alone - Speak another language Native:
3.1% (865)Foreign-born:
50.7% (807)
Hispanic or Latino - Speak only English Native:
86.1% (1,294)Foreign-born:
37.7% (139)
Hispanic or Latino - Speak another language Native:
18.2% (274)Foreign-born:
68.2% (251)
Foreign-born residents in Lake Oswego 4,666 residents are foreign born (6.0% Asia , 2.7% Europe ).
This city:
11.5%Oregon:
9.8%
Marital status for residents in Lake Oswego Marital status - White (Caucasian) population 15 years and over
Males 25.2% Never married64.0% Now married1.2% Separated2.2% Widowed7.5% DivorcedFemales 17.2% Never married58.8% Now married0.9% Separated8.9% Widowed14.2% DivorcedWomen who gave birth in the past 12 months Now married:
100.0% (383)Unmarried:
0.0% (0)
Women who did not give birth in the past 12 months Now married:
51.1% (2,542)Unmarried:
48.9% (2,437)
Marital status - Black or African American population 15 years and over
Males 33.5% Never married57.8% Now married0.0% Separated0.0% Widowed8.7% DivorcedFemales 16.7% Never married69.6% Now married0.0% Separated6.5% Widowed7.2% DivorcedWomen who did not give birth in the past 12 months Now married:
72.6% (65)Unmarried:
27.4% (25)
Marital status - American Indian / Alaska Native population 15 years and over
Males 80.5% Never married19.5% Now married0.0% Separated0.0% Widowed0.0% DivorcedFemales 46.8% Never married51.1% Now married0.0% Separated2.1% Widowed0.0% DivorcedWomen who did not give birth in the past 12 months Now married:
52.2% (52)Unmarried:
47.8% (48)
Marital status - Asian population 15 years and over
Males 28.9% Never married70.3% Now married0.0% Separated0.0% Widowed0.9% DivorcedFemales 14.9% Never married75.9% Now married0.0% Separated3.0% Widowed6.2% DivorcedWomen who gave birth in the past 12 months Now married:
0.0% (0)Unmarried:
100.0% (9)
Women who did not give birth in the past 12 months Now married:
75.7% (709)Unmarried:
24.3% (228)
Marital status - Other race population 15 years and over
Males 44.8% Never married42.7% Now married0.0% Separated0.0% Widowed12.6% DivorcedFemales 57.2% Never married42.8% Now married0.0% Separated0.0% Widowed0.0% DivorcedWomen who did not give birth in the past 12 months Now married:
49.1% (75)Unmarried:
50.9% (78)
Marital status - Two or more races population 15 years and over
Males 50.2% Never married44.4% Now married0.0% Separated0.0% Widowed5.4% DivorcedFemales 16.8% Never married69.1% Now married0.0% Separated3.0% Widowed11.1% DivorcedWomen who gave birth in the past 12 months Now married:
100.0% (161)Unmarried:
0.0% (0)
Women who did not give birth in the past 12 months Now married:
69.8% (426)Unmarried:
30.2% (185)
Marital status - White alone, not Hispanic / Latino population 15 years and over
Males 25.3% Never married63.9% Now married1.2% Separated2.2% Widowed7.4% DivorcedFemales 17.3% Never married58.6% Now married0.9% Separated9.0% Widowed14.2% DivorcedWomen who gave birth in the past 12 months Now married:
100.0% (389)Unmarried:
0.0% (0)
Women who did not give birth in the past 12 months Now married:
50.5% (2,501)Unmarried:
49.5% (2,452)
Marital status - Hispanic or Latino population 15 years and over
Males 46.5% Never married40.6% Now married0.0% Separated0.0% Widowed12.9% DivorcedFemales 27.5% Never married60.9% Now married1.9% Separated2.2% Widowed7.4% DivorcedWomen who did not give birth in the past 12 months Now married:
68.7% (299)Unmarried:
31.3% (137)
Ancestries in Lake Oswego
1,688 10.2% English1,422 8.6% Irish1,357 8.2% German1,203 7.2% European924 5.6% American395 2.4% Italian306 1.8% Northern European305 1.8% Scottish293 1.8% Norwegian262 1.6% British241 1.5% Swedish232 1.4% Scandinavian214 1.3% Iranian212 1.3% Polish181 1.1% Austrian173 1.0% Eastern European150 0.9% Greek141 0.8% Finnish137 0.8% Afghan126 0.8% Ukrainian104 0.6% Scotch-Irish95 0.6% Dutch90 0.5% Russian86 0.5% French84 0.5% Croatian80 0.5% Sudanese77 0.5% Syrian66 0.4% Danish61 0.4% New Zealander59 0.4% Hungarian50 0.3% French Canadian45 0.3% Belgian40 0.2% Canadian38 0.2% Lithuanian38 0.2% Welsh32 0.2% Cajun31 0.2% Turkish28 0.2% Czech26 0.2% Portuguese24 0.1% Slovak22 0.1% Swiss20 0.1% Jamaican18 0.1% South African16 0.10% Assyrian16 0.10% Basque15 0.09% Yugoslavian13 0.08% Latvian7 0.04% Ethiopian2 0.01% Romanian1 0.01% Arab
Geographical mobility in Lake Oswego Same house 1 year ago 26,515 86.1% White (Caucasian)498 100.0% Black or African American131 70.6% American Indian / Alaska Native2,884 76.1% Asian20 14.0% Native Hawaiian / Pacific Islander521 96.9% Other race3,220 77.1% Two or more races26,359 86.0% White alone, not Hispanic / Latino1,578 76.6% Hispanic or LatinoMoved within same county 813 2.6% White / Caucasian437 11.5% Asian1 0.2% Other race86 2.0% Two or more races784 2.6% White alone, not Hispanic / Latino36 1.8% Hispanic or LatinoMoved within same state 2,855 9.3% White / Caucasian167 4.4% Asian153 100.0% Native Hawaiian / Pacific Islander10 1.8% Other race449 10.7% Two or more races2,956 9.6% White alone, not Hispanic / Latino188 9.1% Hispanic or LatinoMoved from different state 1,042 3.4% White / Caucasian17 3.5% Black or African American59 31.6% American Indian / Alaska Native376 9.9% Asian20 3.7% Other race485 11.6% Two or more races1,023 3.3% White alone, not Hispanic / Latino210 10.2% Hispanic or LatinoMoved from abroad 89 0.3% White9 1.7% Black or African American49 1.3% Asian18 0.4% Two or more races36 0.1% White alone, not Hispanic / Latino25 1.2% Hispanic or Latino
Children Nativity (place of birth) in Lake Oswego
Children under 6 years - Living with two parents Both parents native 1,619 100.0% NativeBoth parents foreign-born 77 55.8% Native61 44.2% Foreign-bornOne native, one foreign-born parent 565 100.0% NativeChildren under 6 years - Living with one parent Native parent 108 100.0% NativeChildren 6 to 17 years - Living with two parents Both parents native 4,174 99.5% Native20 0.5% Foreign-bornBoth parents foreign-born 188 67.9% Native89 32.1% Foreign-bornOne native, one foreign-born parent 748 100.0% NativeChildren 6 to 17 years - Living with one parent Native parent 885 94.0% Native57 6.0% Foreign-bornForeign-born parent 158 62.0% Native97 38.0% Foreign-born