Races in Lowell, Massachusetts (MA) Detailed Stats
Data:
Races - White alone (%)
Races - White alone (% change since 2000)
Races - Black alone (%)
Races - Black alone (% change since 2000)
Races - American Indian alone (%)
Races - American Indian alone (% change since 2000)
Races - Asian alone (%)
Races - Asian alone (% change since 2000)
Races - Hispanic (%)
Races - Hispanic (% change since 2000)
Races - Native Hawaiian and Other Pacific Islander alone (%)
Races - Native Hawaiian and Other Pacific Islander alone (% change since 2000)
Races - Two or more races(%)
Races - Two or more races(% change since 2000)
Races - Other race alone (%)
Races - Other race alone (% change since 2000)
Racial diversity
Place of birth - Born in state of residence (%)
Place of birth - Born in state of residence (%) - White
Place of birth - Born in state of residence (%) - Black or African American
Place of birth - Born in state of residence (%) - Asian
Place of birth - Born in state of residence (%) - Hispanic or Latino
Place of birth - Born in state of residence (%) - American Indian and Alaska Native
Place of birth - Born in state of residence (%) - Multirace
Place of birth - Born in state of residence (%) - Other Race
Place of birth - Born in other state (%)
Place of birth - Born in other state (%) - White
Place of birth - Born in other state (%) - Black or African American
Place of birth - Born in other state (%) - Asian
Place of birth - Born in other state (%) - Hispanic or Latino
Place of birth - Born in other state (%) - American Indian and Alaska Native
Place of birth - Born in other state (%) - Multirace
Place of birth - Born in other state (%) - Other Race
Place of birth - Native, outside of US (%)
Place of birth - Native, outside of US (%) - White
Place of birth - Native, outside of US (%) - Black or African American
Place of birth - Native, outside of US (%) - Asian
Place of birth - Native, outside of US (%) - Hispanic or Latino
Place of birth - Native, outside of US (%) - American Indian and Alaska Native
Place of birth - Native, outside of US (%) - Multirace
Place of birth - Native, outside of US (%) - Other Race
Place of birth - Foreign born (%)
Place of birth - Foreign born (%) - White
Place of birth - Foreign born (%) - Black or African American
Place of birth - Foreign born (%) - Asian
Place of birth - Foreign born (%) - Hispanic or Latino
Place of birth - Foreign born (%) - American Indian and Alaska Native
Place of birth - Foreign born (%) - Multirace
Place of birth - Foreign born (%) - Other Race
Residents speaking English at home (%)
Residents speaking English at home - Born in the United States (%)
Residents speaking English at home - Native, born elsewhere (%)
Residents speaking English at home - Foreign born (%)
Residents speaking Spanish at home (%)
Residents speaking Spanish at home - Born in the United States (%)
Residents speaking Spanish at home - Native, born elsewhere (%)
Residents speaking Spanish at home - Foreign born (%)
Residents speaking other language at home (%)
Residents speaking other language at home - Born in the United States (%)
Residents speaking other language at home - Native, born elsewhere (%)
Residents speaking other language at home - Foreign born (%)
Marital status - Never married (%)
Marital status - Now married (%)
Marital status - Separated (%)
Marital status - Widowed (%)
Marital status - Divorced (%)
Ancestries Reported - Arab (%)
Ancestries Reported - Czech (%)
Ancestries Reported - Danish (%)
Ancestries Reported - Dutch (%)
Ancestries Reported - English (%)
Ancestries Reported - French (%)
Ancestries Reported - French Canadian (%)
Ancestries Reported - German (%)
Ancestries Reported - Greek (%)
Ancestries Reported - Hungarian (%)
Ancestries Reported - Irish (%)
Ancestries Reported - Italian (%)
Ancestries Reported - Lithuanian (%)
Ancestries Reported - Norwegian (%)
Ancestries Reported - Polish (%)
Ancestries Reported - Portuguese (%)
Ancestries Reported - Russian (%)
Ancestries Reported - Scotch-Irish (%)
Ancestries Reported - Scottish (%)
Ancestries Reported - Slovak (%)
Ancestries Reported - Subsaharan African (%)
Ancestries Reported - Swedish (%)
Ancestries Reported - Swiss (%)
Ancestries Reported - Ukrainian (%)
Ancestries Reported - United States (%)
Ancestries Reported - Welsh (%)
Ancestries Reported - West Indian (%)
Ancestries Reported - Other (%)
Geographical mobility - Same house 1 year ago (%)
Geographical mobility - Same house 1 year ago (%) - White
Geographical mobility - Same house 1 year ago (%) - Black or African American
Geographical mobility - Same house 1 year ago (%) - Asian
Geographical mobility - Same house 1 year ago (%) - Hispanic or Latino
Geographical mobility - Same house 1 year ago (%) - American Indian and Alaska Native
Geographical mobility - Same house 1 year ago (%) - Multirace
Geographical mobility - Same house 1 year ago (%) - Other Race
Geographical mobility - Moved within same county (%)
Geographical mobility - Moved within same county (%) - White
Geographical mobility - Moved within same county (%) - Black or African American
Geographical mobility - Moved within same county (%) - Asian
Geographical mobility - Moved within same county (%) - Hispanic or Latino
Geographical mobility - Moved within same county (%) - American Indian and Alaska Native
Geographical mobility - Moved within same county (%) - Multirace
Geographical mobility - Moved within same county (%) - Other Race
Geographical mobility - Moved from different county within same state (%)
Geographical mobility - Moved from different county within same state (%) - White
Geographical mobility - Moved from different county within same state (%) - Black or African American
Geographical mobility - Moved from different county within same state (%) - Asian
Geographical mobility - Moved from different county within same state (%) - Hispanic or Latino
Geographical mobility - Moved from different county within same state (%) - American Indian and Alaska Native
Geographical mobility - Moved from different county within same state (%) - Multirace
Geographical mobility - Moved from different county within same state (%) - Other Race
Geographical mobility - Moved from different state (%)
Geographical mobility - Moved from different state (%) - White
Geographical mobility - Moved from different state (%) - Black or African American
Geographical mobility - Moved from different state (%) - Asian
Geographical mobility - Moved from different state (%) - Hispanic or Latino
Geographical mobility - Moved from different state (%) - American Indian and Alaska Native
Geographical mobility - Moved from different state (%) - Multirace
Geographical mobility - Moved from different state (%) - Other Race
Geographical mobility - Moved from abroad (%)
Geographical mobility - Moved from abroad (%) - White
Geographical mobility - Moved from abroad (%) - Black or African American
Geographical mobility - Moved from abroad (%) - Asian
Geographical mobility - Moved from abroad (%) - Hispanic or Latino
Geographical mobility - Moved from abroad (%) - American Indian and Alaska Native
Geographical mobility - Moved from abroad (%) - Multirace
Geographical mobility - Moved from abroad (%) - Other Race
Place of birth for the foreign-born population - Ireland (%)
Place of birth for the foreign-born population - Denmark (%)
Place of birth for the foreign-born population - Norway (%)
Place of birth for the foreign-born population - Sweden (%)
Place of birth for the foreign-born population - United Kingdom (%)
Place of birth for the foreign-born population - England (%)
Place of birth for the foreign-born population - Scotland (%)
Place of birth for the foreign-born population - Other Northern Europe (%)
Place of birth for the foreign-born population - Austria (%)
Place of birth for the foreign-born population - Belgium (%)
Place of birth for the foreign-born population - France (%)
Place of birth for the foreign-born population - Germany (%)
Place of birth for the foreign-born population - Netherlands (%)
Place of birth for the foreign-born population - Switzerland (%)
Place of birth for the foreign-born population - Other Western Europe (%)
Place of birth for the foreign-born population - Greece (%)
Place of birth for the foreign-born population - Italy (%)
Place of birth for the foreign-born population - Portugal (%)
Place of birth for the foreign-born population - Spain (%)
Place of birth for the foreign-born population - Other Southern Europe (%)
Place of birth for the foreign-born population - Albania (%)
Place of birth for the foreign-born population - Belarus (%)
Place of birth for the foreign-born population - Bosnia and Herzegovina (%)
Place of birth for the foreign-born population - Bulgaria (%)
Place of birth for the foreign-born population - Croatia (%)
Place of birth for the foreign-born population - Czechoslovakia (%)
Place of birth for the foreign-born population - Hungary (%)
Place of birth for the foreign-born population - Latvia (%)
Place of birth for the foreign-born population - Lithuania (%)
Place of birth for the foreign-born population - North Macedonia (Macedonia) (%)
Place of birth for the foreign-born population - Moldova (%)
Place of birth for the foreign-born population - Poland (%)
Place of birth for the foreign-born population - Romania (%)
Place of birth for the foreign-born population - Russia (%)
Place of birth for the foreign-born population - Serbia (%)
Place of birth for the foreign-born population - Ukraine (%)
Place of birth for the foreign-born population - Other Eastern Europe (%)
Place of birth for the foreign-born population - China (%)
Place of birth for the foreign-born population - Hong Kong (%)
Place of birth for the foreign-born population - Taiwan (%)
Place of birth for the foreign-born population - Japan (%)
Place of birth for the foreign-born population - Korea (%)
Place of birth for the foreign-born population - Other Eastern Asia (%)
Place of birth for the foreign-born population - Afghanistan (%)
Place of birth for the foreign-born population - Bangladesh (%)
Place of birth for the foreign-born population - India (%)
Place of birth for the foreign-born population - Iran (%)
Place of birth for the foreign-born population - Kazakhstan (%)
Place of birth for the foreign-born population - Nepal (%)
Place of birth for the foreign-born population - Pakistan (%)
Place of birth for the foreign-born population - Sri Lanka (%)
Place of birth for the foreign-born population - Uzbekistan (%)
Place of birth for the foreign-born population - Other South Central Asia (%)
Place of birth for the foreign-born population - Burma (%)
Place of birth for the foreign-born population - Cambodia (%)
Place of birth for the foreign-born population - Indonesia (%)
Place of birth for the foreign-born population - Laos (%)
Place of birth for the foreign-born population - Malaysia (%)
Place of birth for the foreign-born population - Philippines (%)
Place of birth for the foreign-born population - Singapore (%)
Place of birth for the foreign-born population - Thailand (%)
Place of birth for the foreign-born population - Vietnam (%)
Place of birth for the foreign-born population - Other South Eastern Asia (%)
Place of birth for the foreign-born population - Armenia (%)
Place of birth for the foreign-born population - Iraq (%)
Place of birth for the foreign-born population - Israel (%)
Place of birth for the foreign-born population - Jordan (%)
Place of birth for the foreign-born population - Kuwait (%)
Place of birth for the foreign-born population - Lebanon (%)
Place of birth for the foreign-born population - Saudi Arabia (%)
Place of birth for the foreign-born population - Syria (%)
Place of birth for the foreign-born population - Turkey (%)
Place of birth for the foreign-born population - Yemen (%)
Place of birth for the foreign-born population - Other Western Asia (%)
Place of birth for the foreign-born population - Eritrea (%)
Place of birth for the foreign-born population - Ethiopia (%)
Place of birth for the foreign-born population - Kenya (%)
Place of birth for the foreign-born population - Somalia (%)
Place of birth for the foreign-born population - Uganda (%)
Place of birth for the foreign-born population - Zimbabwe (%)
Place of birth for the foreign-born population - Other Eastern Africa (%)
Place of birth for the foreign-born population - Cameroon (%)
Place of birth for the foreign-born population - Congo (%)
Place of birth for the foreign-born population - Democratic Republic of Congo (Zaire) (%)
Place of birth for the foreign-born population - Other Middle Africa (%)
Place of birth for the foreign-born population - Egypt (%)
Place of birth for the foreign-born population - Morocco (%)
Place of birth for the foreign-born population - Sudan (%)
Place of birth for the foreign-born population - Other Northern Africa (%)
Place of birth for the foreign-born population - South Africa (%)
Place of birth for the foreign-born population - Other Southern Africa (%)
Place of birth for the foreign-born population - Cabo Verde (%)
Place of birth for the foreign-born population - Ghana (%)
Place of birth for the foreign-born population - Liberia (%)
Place of birth for the foreign-born population - Nigeria (%)
Place of birth for the foreign-born population - Senegal (%)
Place of birth for the foreign-born population - Sierra Leone (%)
Place of birth for the foreign-born population - Other Western Africa (%)
Place of birth for the foreign-born population - Australia (%)
Place of birth for the foreign-born population - New Zealand (%)
Place of birth for the foreign-born population - Fiji (%)
Place of birth for the foreign-born population - Micronesia (%)
Place of birth for the foreign-born population - Bahamas (%)
Place of birth for the foreign-born population - Barbados (%)
Place of birth for the foreign-born population - Cuba (%)
Place of birth for the foreign-born population - Dominica (%)
Place of birth for the foreign-born population - Dominican Republic (%)
Place of birth for the foreign-born population - Grenada (%)
Place of birth for the foreign-born population - Haiti (%)
Place of birth for the foreign-born population - Jamaica (%)
Place of birth for the foreign-born population - St. Vincent and the Grenadines (%)
Place of birth for the foreign-born population - Trinidad and Tobago (%)
Place of birth for the foreign-born population - West Indies (%)
Place of birth for the foreign-born population - Other Caribbean (%)
Place of birth for the foreign-born population - Belize (%)
Place of birth for the foreign-born population - Costa Rica (%)
Place of birth for the foreign-born population - El Salvador (%)
Place of birth for the foreign-born population - Guatemala (%)
Place of birth for the foreign-born population - Honduras (%)
Place of birth for the foreign-born population - Mexico (%)
Place of birth for the foreign-born population - Nicaragua (%)
Place of birth for the foreign-born population - Panama (%)
Place of birth for the foreign-born population - Other Central America (%)
Place of birth for the foreign-born population - Argentina (%)
Place of birth for the foreign-born population - Bolivia (%)
Place of birth for the foreign-born population - Brazil (%)
Place of birth for the foreign-born population - Chile (%)
Place of birth for the foreign-born population - Colombia (%)
Place of birth for the foreign-born population - Ecuador (%)
Place of birth for the foreign-born population - Guyana (%)
Place of birth for the foreign-born population - Peru (%)
Place of birth for the foreign-born population - Uruguay (%)
Place of birth for the foreign-born population - Venezuela (%)
Place of birth for the foreign-born population - Other South America (%)
Place of birth for the foreign-born population - Canada (%)
Place of birth for the foreign-born population - Other Northern America (%)
Place of birth for the foreign-born population - Other (%)
Latest news about races in Lowell, MA collected exclusively by city-data.com from local newspapers, TV, and radio stations
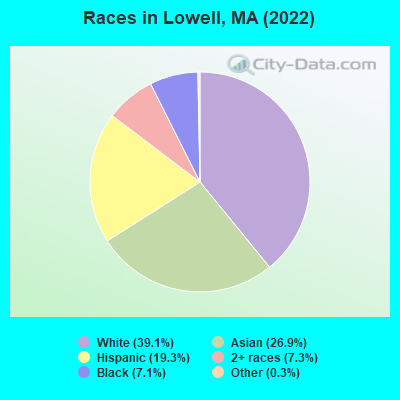
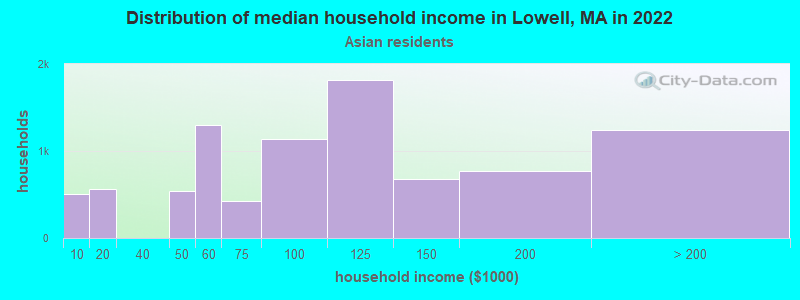
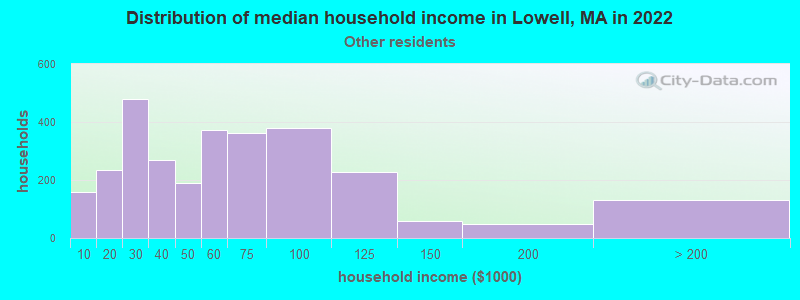
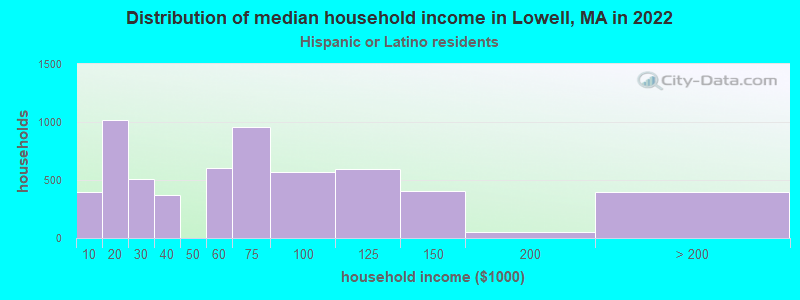
According to 2022 data, the most numerous races in Lowell, MA are White alone (44,455 residents), Hispanic (21,894 residents), and Asian alone (30,517 residents). 51.2% of Lowell residents speak English at home. 29.8% of Lowell, MA residents are foreign-born (14.3% born in Asia, 7.7% born in Latin America, 4.2% born in Africa), which is 39.7% greater than the foreign-born rate of 18.0% across the entire state of Massachusetts.
Race distribution in Lowell
2000 2022
65,760 62.5% White alone 17,302 16.5% Asian alone 14,734 14.0% Hispanic 3,644 3.5% Black alone 3,071 2.9% Two or more races 474 0.5% Other race alone 170 0.2% American Indian alone 12 0.01% Native Hawaiian and Other
44,455 39.1% White alone 30,517 26.9% Asian alone 21,894 19.3% Hispanic 8,278 7.3% Two or more races 8,091 7.1% Black alone 359 0.3% Other race alone
2000 2022
5,198,359 81.9% White alone 428,729 6.8% Hispanic 318,329 5.0% Black alone 236,786 3.7% Asian alone 110,338 1.7% Two or more races 43,586 0.7% Other race alone 11,264 0.2% American Indian alone 1,706 0.03% Native Hawaiian and Other
4,676,627 67.0% White alone 911,038 13.0% Hispanic 501,463 7.2% Asian alone 459,740 6.6% Black alone 341,889 4.9% Two or more races 84,403 1.2% Other race alone 5,838 0.08% American Indian alone 976 0.01% Native Hawaiian and Other
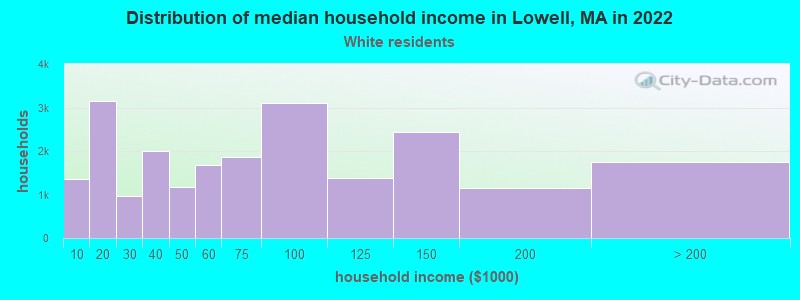
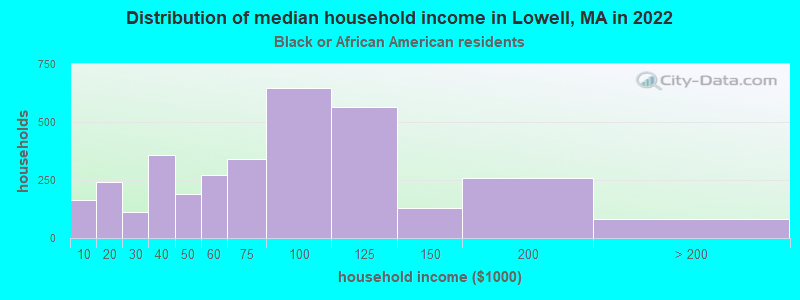
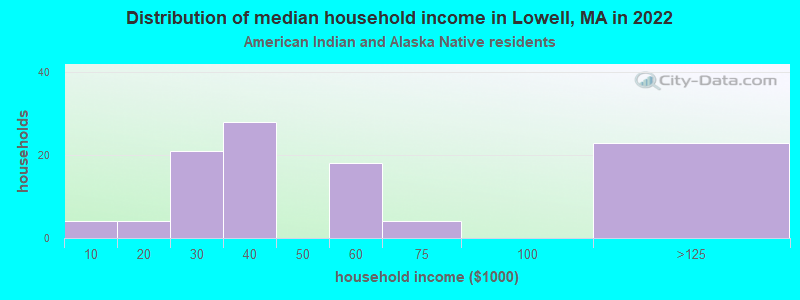
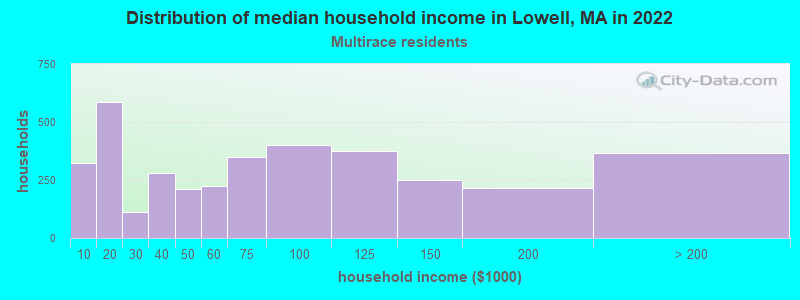
Income and house value in Lowell Median household income in 2022 $66,913 White non-Hispanic householders$78,239 Black householders$100,190 Asian householders$56,194 Some other race householders$66,545 Two or more races householders$65,026 Hispanic or Latino race householdersMedian 2022 house value $435,655 White Non-Hispanic householders$383,492 Black or African American householders$395,728 American Indian or Alaska Native householders $416,014 Asian householders$318,772 Some other race householders$429,215 Two or more races householders$397,338 Hispanic or Latino householders
Median age by race in Lowell
37.8 Median age for White residents36.8 38.5 32.7 Median age for Black or African American residents34.9 32.0 -666,666,666.0 Median age for American Indian / Alaska Native residents-666,666,666.0 -666,666,666.0 36.7 Median age for Asian residents36.4 37.6 -666,666,666.0 Median age for Native Hawaiian / Pacific Islander residents-666,666,666.0 -666,666,666.0 31.7 Median age for Other race residents24.9 32.4 30.4 Median age for Two or more races residents24.2 35.3 40.6 Median age for White alone residents39.1 42.0 28.0 Median age for Hispanic or Latino residents23.4 34.6
Owner/renter occupied households by race in Lowell
House owners and renters - White residents 10,563 48.0% Owner occupied11,437 52.0% Renter occupiedHouse owners and renters - Black or African American residents 1,218 41.7% Owner occupied1,701 58.3% Renter occupiedHouse owners and renters - American Indian / Alaska Native residents 9 6.8% Owner occupied118 93.2% Renter occupiedHouse owners and renters - Asian residents 4,613 51.3% Owner occupied4,372 48.7% Renter occupiedHouse owners and renters - Native Hawaiian / Pacific Islander residents 9 18.1% Owner occupied42 81.9% Renter occupiedHouse owners and renters - Other race residents 571 19.8% Owner occupied2,319 80.2% Renter occupiedHouse owners and renters - Two or more races residents 1,138 28.5% Owner occupied2,858 71.5% Renter occupiedHouse owners and renters - White alone residents 10,024 48.6% Owner occupied10,615 51.4% Renter occupiedHouse owners and renters - Hispanic or Latino residents 1,847 31.4% Owner occupied4,040 68.6% Renter occupied
Language usage in Lowell
English speakers - Total 51.2% of residents of Lowell speak English at home.
13.7% of residents speak Spanish at home 6,895 47.0% Speak English very well7,787 53.0% Speak English less than very well35.0% of residents speak other language at home 20,775 55.4% Speak English very well16,712 44.6% Speak English less than very well
English speakers - Born in the United States 71.0% of residents of Lowell speak English at home.
8.7% of residents speak Spanish at home 930 87.0% Speak English very well139 13.0% Speak English less than very well20.3% of residents speak other language at home 2,342 94.3% Speak English very well142 5.7% Speak English less than very well
English speakers - Native, born elsewhere 10.8% of residents of Lowell speak English at home.
68.5% of residents speak Spanish at home 1,796 49.6% Speak English very well1,825 50.4% Speak English less than very well20.7% of residents speak other language at home 924 84.5% Speak English very well170 15.5% Speak English less than very well
English speakers - Foreign-born 9.0% of residents of Lowell speak English at home.
18.2% of residents speak Spanish at home 1,440 21.3% Speak English very well5,331 78.7% Speak English less than very well72.9% of residents speak other language at home 11,663 43.0% Speak English very well15,478 57.0% Speak English less than very well
White (Caucasian) - Speak only English Native:
91.0% (39,020)Foreign-born:
6.2% (240)
White (Caucasian) - Speak another language Native:
9.0% (3,871)Foreign-born:
93.8% (3,642)
Black or African American - Speak only English Native:
84.9% (2,748)Foreign-born:
27.3% (1,263)
Black or African American - Speak another language Native:
15.1% (488)Foreign-born:
72.7% (3,369)
American Indian / Alaska Native - Speak only English Native:
56.6% (140)Foreign-born:
76.4% (4)
Asian - Speak only English Native:
38.8% (4,391)Foreign-born:
5.3% (976)
Asian - Speak another language Native:
61.2% (6,917)Foreign-born:
94.7% (17,455)
Native Hawaiian / Pacific Islander - Speak only English Native:
69.9% (64)Foreign-born:
50.7% (20)
Native Hawaiian / Pacific Islander - Speak another language Native:
30.2% (27)Foreign-born:
47.8% (19)
Other race - Speak only English Native:
33.7% (1,562)Foreign-born:
3.3% (163)
Other race - Speak another language Native:
66.3% (3,074)Foreign-born:
96.7% (4,780)
Two or more races - Speak only English Native:
49.0% (3,760)Foreign-born:
12.9% (694)
Two or more races - Speak another language Native:
51.0% (3,907)Foreign-born:
87.1% (4,666)
White alone - Speak only English Native:
95.1% (37,613)Foreign-born:
8.4% (240)
White alone - Speak another language Native:
4.9% (1,925)Foreign-born:
91.6% (2,621)
Hispanic or Latino - Speak another language Native:
60.6% (7,901)Foreign-born:
100.0% (6,644)
Foreign-born residents in Lowell 34,100 residents are foreign born (14.3% Asia , 7.7% Latin America , 4.2% Africa ).
This city:
29.8%Massachusetts:
17.6%
Marital status for residents in Lowell Marital status - White (Caucasian) population 15 years and over
Males 52.3% Never married36.4% Now married1.4% Separated2.6% Widowed7.3% DivorcedFemales 39.0% Never married32.6% Now married3.6% Separated7.6% Widowed17.2% DivorcedWomen who gave birth in the past 12 months Now married:
43.2% (421)Unmarried:
56.8% (554)
Women who did not give birth in the past 12 months Now married:
26.5% (3,002)Unmarried:
73.5% (8,346)
Marital status - Black or African American population 15 years and over
Males 19.9% Never married42.3% Now married11.2% Separated0.0% Widowed26.5% DivorcedFemales 42.9% Never married32.2% Now married6.8% Separated5.4% Widowed12.7% DivorcedWomen who gave birth in the past 12 months Now married:
0.0% (0)Unmarried:
100.0% (110)
Women who did not give birth in the past 12 months Now married:
33.4% (1,094)Unmarried:
66.6% (2,179)
Marital status - American Indian / Alaska Native population 15 years and over
Males 69.0% Never married27.6% Now married0.0% Separated0.0% Widowed3.4% DivorcedFemales 49.2% Never married17.4% Now married0.0% Separated0.0% Widowed33.3% DivorcedWomen who did not give birth in the past 12 months Now married:
12.8% (18)Unmarried:
87.2% (120)
Marital status - Asian population 15 years and over
Males 51.6% Never married41.1% Now married0.5% Separated0.3% Widowed6.6% DivorcedFemales 40.8% Never married37.7% Now married2.8% Separated3.2% Widowed15.5% DivorcedWomen who gave birth in the past 12 months Now married:
28.1% (130)Unmarried:
71.9% (333)
Women who did not give birth in the past 12 months Now married:
37.2% (2,997)Unmarried:
62.8% (5,057)
Marital status - Native Hawaiian / Pacific Islander population 15 years and over
Males 34.3% Never married35.8% Now married0.0% Separated0.0% Widowed29.9% DivorcedFemales 2.9% Never married51.4% Now married0.0% Separated45.7% Widowed0.0% DivorcedWomen who did not give birth in the past 12 months Now married:
100.0% (19)Unmarried:
0.0% (0)
Marital status - Other race population 15 years and over
Males 60.6% Never married34.6% Now married3.3% Separated0.0% Widowed1.6% DivorcedFemales 47.9% Never married26.6% Now married4.6% Separated1.9% Widowed19.0% DivorcedWomen who gave birth in the past 12 months Now married:
76.3% (53)Unmarried:
23.7% (16)
Women who did not give birth in the past 12 months Now married:
29.7% (684)Unmarried:
70.3% (1,618)
Marital status - Two or more races population 15 years and over
Males 44.4% Never married53.2% Now married2.5% Separated0.0% Widowed0.0% DivorcedFemales 38.2% Never married48.7% Now married0.0% Separated3.0% Widowed10.0% DivorcedWomen who gave birth in the past 12 months Now married:
60.6% (117)Unmarried:
39.4% (77)
Women who did not give birth in the past 12 months Now married:
30.1% (824)Unmarried:
69.9% (1,915)
Marital status - White alone, not Hispanic / Latino population 15 years and over
Males 52.1% Never married35.9% Now married1.5% Separated2.8% Widowed7.7% DivorcedFemales 40.2% Never married31.6% Now married2.3% Separated7.9% Widowed18.0% DivorcedWomen who gave birth in the past 12 months Now married:
32.2% (263)Unmarried:
67.8% (554)
Women who did not give birth in the past 12 months Now married:
24.1% (2,511)Unmarried:
75.9% (7,918)
Marital status - Hispanic or Latino population 15 years and over
Males 60.2% Never married36.0% Now married2.5% Separated0.0% Widowed1.3% DivorcedFemales 44.1% Never married32.4% Now married6.8% Separated1.4% Widowed15.2% DivorcedWomen who gave birth in the past 12 months Now married:
82.3% (289)Unmarried:
17.7% (62)
Women who did not give birth in the past 12 months Now married:
30.3% (1,662)Unmarried:
69.7% (3,827)
Ancestries in Lowell
7,537 10.7% Irish3,220 4.6% Portuguese3,004 4.2% Brazilian2,316 3.3% Italian1,867 2.6% French Canadian1,835 2.6% French1,497 2.1% American1,182 1.7% African1,081 1.5% English865 1.2% Greek860 1.2% Sierra Leonean771 1.1% German601 0.8% Polish414 0.6% Moroccan409 0.6% Haitian388 0.5% Kenyan335 0.5% European276 0.4% Jamaican259 0.4% Nigerian222 0.3% Ugandan205 0.3% Russian202 0.3% Lebanese180 0.3% Lithuanian178 0.3% Scottish162 0.2% Liberian161 0.2% Swedish157 0.2% Turkish144 0.2% Iranian135 0.2% Ghanaian105 0.1% Albanian99 0.1% Armenian75 0.1% Cape Verdean69 0.10% West Indian67 0.09% Canadian67 0.09% Syrian63 0.09% Eastern European61 0.09% Afghan56 0.08% Norwegian53 0.07% Barbadian50 0.07% Scotch-Irish44 0.06% Austrian38 0.05% Bermudan37 0.05% Romanian36 0.05% Danish35 0.05% Hungarian34 0.05% Swiss32 0.05% Northern European31 0.04% Zimbabwean29 0.04% Welsh27 0.04% Arab23 0.03% British23 0.03% Finnish22 0.03% Iraqi20 0.03% Guyanese20 0.03% Somali20 0.03% Ukrainian16 0.02% Israeli15 0.02% U.S. Virgin Islander14 0.02% Egyptian9 0.01% Dutch9 0.01% Slovak6 0.01% South African6 0.01% Bahamian6 0.01% Croatian4 0.01% Scandinavian
Geographical mobility in Lowell Same house 1 year ago 42,653 86.2% White (Caucasian)8,636 82.5% Black or African American387 97.0% American Indian / Alaska Native28,245 91.9% Asian125 82.6% Native Hawaiian / Pacific Islander6,489 85.9% Other race9,323 80.6% Two or more races38,389 86.9% White alone, not Hispanic / Latino17,380 83.8% Hispanic or LatinoMoved within same county 3,415 6.9% White / Caucasian1,020 9.8% Black or African American15 3.8% American Indian / Alaska Native1,444 4.7% Asian262 3.5% Other race1,270 11.0% Two or more races3,325 7.5% White alone, not Hispanic / Latino826 4.0% Hispanic or LatinoMoved within same state 1,358 2.7% White / Caucasian324 3.1% Black or African American387 1.3% Asian29 19.2% Native Hawaiian / Pacific Islander297 3.9% Other race485 4.2% Two or more races777 1.8% White alone, not Hispanic / Latino1,193 5.8% Hispanic or LatinoMoved from different state 1,564 3.2% White / Caucasian178 1.7% Black or African American375 1.2% Asian85 1.1% Other race83 0.7% Two or more races1,564 3.5% White alone, not Hispanic / Latino296 1.4% Hispanic or LatinoMoved from abroad 515 1.0% White202 1.9% Black or African American283 0.9% Asian263 3.5% Other race418 3.6% Two or more races139 0.3% White alone, not Hispanic / Latino875 4.2% Hispanic or Latino
Children Nativity (place of birth) in Lowell
Children under 6 years - Living with two parents Both parents native 1,385 100.0% NativeBoth parents foreign-born 1,037 84.9% Native184 15.1% Foreign-bornOne native, one foreign-born parent 338 100.0% NativeChildren under 6 years - Living with one parent Native parent 2,587 100.0% NativeForeign-born parent 959 100.0% NativeChildren 6 to 17 years - Living with two parents Both parents native 2,090 100.0% NativeBoth parents foreign-born 2,976 56.3% Native2,312 43.7% Foreign-bornOne native, one foreign-born parent 1,519 100.0% NativeChildren 6 to 17 years - Living with one parent Native parent 3,309 100.0% NativeForeign-born parent 3,989 53.4% Native3,483 46.6% Foreign-born
Place of birth for residents in Lowell 16,982 Asia12,698 South Eastern Asia9,248 Americas9,080 Latin America5,548 South America5,033 Africa2,937 South Central Asia2,765 Europe2,570 Caribbean2,352 Eastern Africa2,254 Southern Europe1,639 Western Africa960 Central America759 Eastern Asia549 Western Asia447 China259 Eastern Europe246 Middle Africa168 Northern America167 Northern Africa160 Western Europe91 Northern Europe70 Oceania58 Southern Africa8,306 Cambodia3,563 Brazil2,034 India2,010 Portugal1,854 Dominican Republic1,792 Vietnam1,563 Kenya1,553 Colombia900 Thailand815 Laos668 Uganda595 Nigeria439 Liberia409 El Salvador395 Haiti389 Burma (Myanmar)374 Sierra Leone345 China340 Azores Islands334 Philippines249 Korea239 Ecuador223 Guatemala201 Cameroon190 Greece184 Bhutan175 Turkey172 Pakistan169 Iran168 Canada154 Nepal150 Mexico147 Morocco132 Jamaica130 Bangladesh127 Ghana126 Indonesia113 Lebanon108 Russia105 Honduras97 Taiwan92 Afghanistan80 Iraq75 Uruguay74 Togo71 Costa Rica68 Poland68 Germany65 France62 Japan59 Micronesia55 Barbados55 Saudi Arabia51 South Africa47 Venezuela46 Syria45 Cuba44 Congo43 Georgia38 Albania33 Malaysia32 England31 Italy29 Ireland28 United Kingdom28 Peru26 Austria25 Israel24 Ukraine24 Bahamas22 Spain21 Trinidad and Tobago19 Egypt18 Somalia17 Ethiopia16 Ivory Coast15 Zimbabwe15 Guyana13 Croatia13 West Indies13 Chile10 Argentina7 Jordan6 Romania5 Hong Kong4 Cabo Verde
Grandparents responsible for own grandchildren in Lowell
Grandparents (30 to 59 years) White / Caucasian 102 25.7% Responsible for grandchildren296 74.3% Not responsible for grandchildrenBlack or African American 32 100.0% Not responsible for grandchildrenAmerican Indian / Alaska Native 17 100.0% Responsible for grandchildrenAsian 190 24.1% Responsible for grandchildren598 75.9% Not responsible for grandchildrenOther race 39 100.0% Not responsible for grandchildrenTwo or more races 113 100.0% Not responsible for grandchildrenWhite alone, not Hispanic / Latino 110 29.0% Responsible for grandchildren270 71.0% Not responsible for grandchildrenHispanic or Latino 35 41.8% Responsible for grandchildren49 58.2% Not responsible for grandchildrenGrandparents (60 years and over) White / Caucasian 125 14.4% Responsible for grandchildren740 85.6% Not responsible for grandchildrenBlack or African American 16 8.5% Responsible for grandchildren177 91.5% Not responsible for grandchildrenAsian 30 3.9% Responsible for grandchildren748 96.1% Not responsible for grandchildrenOther race 135 100.0% Not responsible for grandchildrenTwo or more races 46 19.8% Responsible for grandchildren185 80.2% Not responsible for grandchildrenWhite alone, not Hispanic / Latino 125 16.8% Responsible for grandchildren619 83.2% Not responsible for grandchildrenHispanic or Latino 33 9.0% Responsible for grandchildren333 91.0% Not responsible for grandchildren