Races in Malden, Massachusetts (MA) Detailed Stats
Data:
Races - White alone (%)
Races - White alone (% change since 2000)
Races - Black alone (%)
Races - Black alone (% change since 2000)
Races - American Indian alone (%)
Races - American Indian alone (% change since 2000)
Races - Asian alone (%)
Races - Asian alone (% change since 2000)
Races - Hispanic (%)
Races - Hispanic (% change since 2000)
Races - Native Hawaiian and Other Pacific Islander alone (%)
Races - Native Hawaiian and Other Pacific Islander alone (% change since 2000)
Races - Two or more races(%)
Races - Two or more races(% change since 2000)
Races - Other race alone (%)
Races - Other race alone (% change since 2000)
Racial diversity
Place of birth - Born in state of residence (%)
Place of birth - Born in state of residence (%) - White
Place of birth - Born in state of residence (%) - Black or African American
Place of birth - Born in state of residence (%) - Asian
Place of birth - Born in state of residence (%) - Hispanic or Latino
Place of birth - Born in state of residence (%) - American Indian and Alaska Native
Place of birth - Born in state of residence (%) - Multirace
Place of birth - Born in state of residence (%) - Other Race
Place of birth - Born in other state (%)
Place of birth - Born in other state (%) - White
Place of birth - Born in other state (%) - Black or African American
Place of birth - Born in other state (%) - Asian
Place of birth - Born in other state (%) - Hispanic or Latino
Place of birth - Born in other state (%) - American Indian and Alaska Native
Place of birth - Born in other state (%) - Multirace
Place of birth - Born in other state (%) - Other Race
Place of birth - Native, outside of US (%)
Place of birth - Native, outside of US (%) - White
Place of birth - Native, outside of US (%) - Black or African American
Place of birth - Native, outside of US (%) - Asian
Place of birth - Native, outside of US (%) - Hispanic or Latino
Place of birth - Native, outside of US (%) - American Indian and Alaska Native
Place of birth - Native, outside of US (%) - Multirace
Place of birth - Native, outside of US (%) - Other Race
Place of birth - Foreign born (%)
Place of birth - Foreign born (%) - White
Place of birth - Foreign born (%) - Black or African American
Place of birth - Foreign born (%) - Asian
Place of birth - Foreign born (%) - Hispanic or Latino
Place of birth - Foreign born (%) - American Indian and Alaska Native
Place of birth - Foreign born (%) - Multirace
Place of birth - Foreign born (%) - Other Race
Residents speaking English at home (%)
Residents speaking English at home - Born in the United States (%)
Residents speaking English at home - Native, born elsewhere (%)
Residents speaking English at home - Foreign born (%)
Residents speaking Spanish at home (%)
Residents speaking Spanish at home - Born in the United States (%)
Residents speaking Spanish at home - Native, born elsewhere (%)
Residents speaking Spanish at home - Foreign born (%)
Residents speaking other language at home (%)
Residents speaking other language at home - Born in the United States (%)
Residents speaking other language at home - Native, born elsewhere (%)
Residents speaking other language at home - Foreign born (%)
Marital status - Never married (%)
Marital status - Now married (%)
Marital status - Separated (%)
Marital status - Widowed (%)
Marital status - Divorced (%)
Ancestries Reported - Arab (%)
Ancestries Reported - Czech (%)
Ancestries Reported - Danish (%)
Ancestries Reported - Dutch (%)
Ancestries Reported - English (%)
Ancestries Reported - French (%)
Ancestries Reported - French Canadian (%)
Ancestries Reported - German (%)
Ancestries Reported - Greek (%)
Ancestries Reported - Hungarian (%)
Ancestries Reported - Irish (%)
Ancestries Reported - Italian (%)
Ancestries Reported - Lithuanian (%)
Ancestries Reported - Norwegian (%)
Ancestries Reported - Polish (%)
Ancestries Reported - Portuguese (%)
Ancestries Reported - Russian (%)
Ancestries Reported - Scotch-Irish (%)
Ancestries Reported - Scottish (%)
Ancestries Reported - Slovak (%)
Ancestries Reported - Subsaharan African (%)
Ancestries Reported - Swedish (%)
Ancestries Reported - Swiss (%)
Ancestries Reported - Ukrainian (%)
Ancestries Reported - United States (%)
Ancestries Reported - Welsh (%)
Ancestries Reported - West Indian (%)
Ancestries Reported - Other (%)
Geographical mobility - Same house 1 year ago (%)
Geographical mobility - Same house 1 year ago (%) - White
Geographical mobility - Same house 1 year ago (%) - Black or African American
Geographical mobility - Same house 1 year ago (%) - Asian
Geographical mobility - Same house 1 year ago (%) - Hispanic or Latino
Geographical mobility - Same house 1 year ago (%) - American Indian and Alaska Native
Geographical mobility - Same house 1 year ago (%) - Multirace
Geographical mobility - Same house 1 year ago (%) - Other Race
Geographical mobility - Moved within same county (%)
Geographical mobility - Moved within same county (%) - White
Geographical mobility - Moved within same county (%) - Black or African American
Geographical mobility - Moved within same county (%) - Asian
Geographical mobility - Moved within same county (%) - Hispanic or Latino
Geographical mobility - Moved within same county (%) - American Indian and Alaska Native
Geographical mobility - Moved within same county (%) - Multirace
Geographical mobility - Moved within same county (%) - Other Race
Geographical mobility - Moved from different county within same state (%)
Geographical mobility - Moved from different county within same state (%) - White
Geographical mobility - Moved from different county within same state (%) - Black or African American
Geographical mobility - Moved from different county within same state (%) - Asian
Geographical mobility - Moved from different county within same state (%) - Hispanic or Latino
Geographical mobility - Moved from different county within same state (%) - American Indian and Alaska Native
Geographical mobility - Moved from different county within same state (%) - Multirace
Geographical mobility - Moved from different county within same state (%) - Other Race
Geographical mobility - Moved from different state (%)
Geographical mobility - Moved from different state (%) - White
Geographical mobility - Moved from different state (%) - Black or African American
Geographical mobility - Moved from different state (%) - Asian
Geographical mobility - Moved from different state (%) - Hispanic or Latino
Geographical mobility - Moved from different state (%) - American Indian and Alaska Native
Geographical mobility - Moved from different state (%) - Multirace
Geographical mobility - Moved from different state (%) - Other Race
Geographical mobility - Moved from abroad (%)
Geographical mobility - Moved from abroad (%) - White
Geographical mobility - Moved from abroad (%) - Black or African American
Geographical mobility - Moved from abroad (%) - Asian
Geographical mobility - Moved from abroad (%) - Hispanic or Latino
Geographical mobility - Moved from abroad (%) - American Indian and Alaska Native
Geographical mobility - Moved from abroad (%) - Multirace
Geographical mobility - Moved from abroad (%) - Other Race
Place of birth for the foreign-born population - Ireland (%)
Place of birth for the foreign-born population - Denmark (%)
Place of birth for the foreign-born population - Norway (%)
Place of birth for the foreign-born population - Sweden (%)
Place of birth for the foreign-born population - United Kingdom (%)
Place of birth for the foreign-born population - England (%)
Place of birth for the foreign-born population - Scotland (%)
Place of birth for the foreign-born population - Other Northern Europe (%)
Place of birth for the foreign-born population - Austria (%)
Place of birth for the foreign-born population - Belgium (%)
Place of birth for the foreign-born population - France (%)
Place of birth for the foreign-born population - Germany (%)
Place of birth for the foreign-born population - Netherlands (%)
Place of birth for the foreign-born population - Switzerland (%)
Place of birth for the foreign-born population - Other Western Europe (%)
Place of birth for the foreign-born population - Greece (%)
Place of birth for the foreign-born population - Italy (%)
Place of birth for the foreign-born population - Portugal (%)
Place of birth for the foreign-born population - Spain (%)
Place of birth for the foreign-born population - Other Southern Europe (%)
Place of birth for the foreign-born population - Albania (%)
Place of birth for the foreign-born population - Belarus (%)
Place of birth for the foreign-born population - Bosnia and Herzegovina (%)
Place of birth for the foreign-born population - Bulgaria (%)
Place of birth for the foreign-born population - Croatia (%)
Place of birth for the foreign-born population - Czechoslovakia (%)
Place of birth for the foreign-born population - Hungary (%)
Place of birth for the foreign-born population - Latvia (%)
Place of birth for the foreign-born population - Lithuania (%)
Place of birth for the foreign-born population - North Macedonia (Macedonia) (%)
Place of birth for the foreign-born population - Moldova (%)
Place of birth for the foreign-born population - Poland (%)
Place of birth for the foreign-born population - Romania (%)
Place of birth for the foreign-born population - Russia (%)
Place of birth for the foreign-born population - Serbia (%)
Place of birth for the foreign-born population - Ukraine (%)
Place of birth for the foreign-born population - Other Eastern Europe (%)
Place of birth for the foreign-born population - China (%)
Place of birth for the foreign-born population - Hong Kong (%)
Place of birth for the foreign-born population - Taiwan (%)
Place of birth for the foreign-born population - Japan (%)
Place of birth for the foreign-born population - Korea (%)
Place of birth for the foreign-born population - Other Eastern Asia (%)
Place of birth for the foreign-born population - Afghanistan (%)
Place of birth for the foreign-born population - Bangladesh (%)
Place of birth for the foreign-born population - India (%)
Place of birth for the foreign-born population - Iran (%)
Place of birth for the foreign-born population - Kazakhstan (%)
Place of birth for the foreign-born population - Nepal (%)
Place of birth for the foreign-born population - Pakistan (%)
Place of birth for the foreign-born population - Sri Lanka (%)
Place of birth for the foreign-born population - Uzbekistan (%)
Place of birth for the foreign-born population - Other South Central Asia (%)
Place of birth for the foreign-born population - Burma (%)
Place of birth for the foreign-born population - Cambodia (%)
Place of birth for the foreign-born population - Indonesia (%)
Place of birth for the foreign-born population - Laos (%)
Place of birth for the foreign-born population - Malaysia (%)
Place of birth for the foreign-born population - Philippines (%)
Place of birth for the foreign-born population - Singapore (%)
Place of birth for the foreign-born population - Thailand (%)
Place of birth for the foreign-born population - Vietnam (%)
Place of birth for the foreign-born population - Other South Eastern Asia (%)
Place of birth for the foreign-born population - Armenia (%)
Place of birth for the foreign-born population - Iraq (%)
Place of birth for the foreign-born population - Israel (%)
Place of birth for the foreign-born population - Jordan (%)
Place of birth for the foreign-born population - Kuwait (%)
Place of birth for the foreign-born population - Lebanon (%)
Place of birth for the foreign-born population - Saudi Arabia (%)
Place of birth for the foreign-born population - Syria (%)
Place of birth for the foreign-born population - Turkey (%)
Place of birth for the foreign-born population - Yemen (%)
Place of birth for the foreign-born population - Other Western Asia (%)
Place of birth for the foreign-born population - Eritrea (%)
Place of birth for the foreign-born population - Ethiopia (%)
Place of birth for the foreign-born population - Kenya (%)
Place of birth for the foreign-born population - Somalia (%)
Place of birth for the foreign-born population - Uganda (%)
Place of birth for the foreign-born population - Zimbabwe (%)
Place of birth for the foreign-born population - Other Eastern Africa (%)
Place of birth for the foreign-born population - Cameroon (%)
Place of birth for the foreign-born population - Congo (%)
Place of birth for the foreign-born population - Democratic Republic of Congo (Zaire) (%)
Place of birth for the foreign-born population - Other Middle Africa (%)
Place of birth for the foreign-born population - Egypt (%)
Place of birth for the foreign-born population - Morocco (%)
Place of birth for the foreign-born population - Sudan (%)
Place of birth for the foreign-born population - Other Northern Africa (%)
Place of birth for the foreign-born population - South Africa (%)
Place of birth for the foreign-born population - Other Southern Africa (%)
Place of birth for the foreign-born population - Cabo Verde (%)
Place of birth for the foreign-born population - Ghana (%)
Place of birth for the foreign-born population - Liberia (%)
Place of birth for the foreign-born population - Nigeria (%)
Place of birth for the foreign-born population - Senegal (%)
Place of birth for the foreign-born population - Sierra Leone (%)
Place of birth for the foreign-born population - Other Western Africa (%)
Place of birth for the foreign-born population - Australia (%)
Place of birth for the foreign-born population - New Zealand (%)
Place of birth for the foreign-born population - Fiji (%)
Place of birth for the foreign-born population - Micronesia (%)
Place of birth for the foreign-born population - Bahamas (%)
Place of birth for the foreign-born population - Barbados (%)
Place of birth for the foreign-born population - Cuba (%)
Place of birth for the foreign-born population - Dominica (%)
Place of birth for the foreign-born population - Dominican Republic (%)
Place of birth for the foreign-born population - Grenada (%)
Place of birth for the foreign-born population - Haiti (%)
Place of birth for the foreign-born population - Jamaica (%)
Place of birth for the foreign-born population - St. Vincent and the Grenadines (%)
Place of birth for the foreign-born population - Trinidad and Tobago (%)
Place of birth for the foreign-born population - West Indies (%)
Place of birth for the foreign-born population - Other Caribbean (%)
Place of birth for the foreign-born population - Belize (%)
Place of birth for the foreign-born population - Costa Rica (%)
Place of birth for the foreign-born population - El Salvador (%)
Place of birth for the foreign-born population - Guatemala (%)
Place of birth for the foreign-born population - Honduras (%)
Place of birth for the foreign-born population - Mexico (%)
Place of birth for the foreign-born population - Nicaragua (%)
Place of birth for the foreign-born population - Panama (%)
Place of birth for the foreign-born population - Other Central America (%)
Place of birth for the foreign-born population - Argentina (%)
Place of birth for the foreign-born population - Bolivia (%)
Place of birth for the foreign-born population - Brazil (%)
Place of birth for the foreign-born population - Chile (%)
Place of birth for the foreign-born population - Colombia (%)
Place of birth for the foreign-born population - Ecuador (%)
Place of birth for the foreign-born population - Guyana (%)
Place of birth for the foreign-born population - Peru (%)
Place of birth for the foreign-born population - Uruguay (%)
Place of birth for the foreign-born population - Venezuela (%)
Place of birth for the foreign-born population - Other South America (%)
Place of birth for the foreign-born population - Canada (%)
Place of birth for the foreign-born population - Other Northern America (%)
Place of birth for the foreign-born population - Other (%)
Latest news about races in Malden, MA collected exclusively by city-data.com from local newspapers, TV, and radio stations
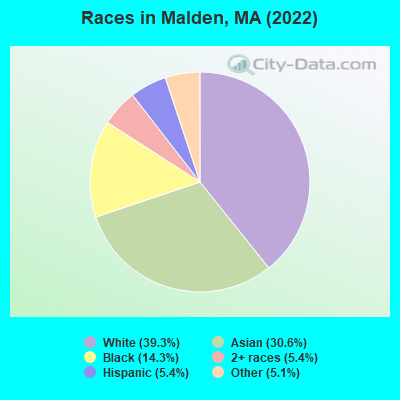
According to 2022 data, the most numerous races in Malden, MA are White alone (25,403 residents), Hispanic (3,469 residents), and Asian alone (19,781 residents). 48.3% of Malden residents speak English at home. 42.7% of Malden, MA residents are foreign-born (20.8% born in Asia, 14.2% born in Latin America), which is 57.9% greater than the foreign-born rate of 18.0% across the entire state of Massachusetts.
Race distribution in Malden
2000 2022
39,230 69.6% White alone 7,863 14.0% Asian alone 4,468 7.9% Black alone 2,696 4.8% Hispanic 1,654 2.9% Two or more races 330 0.6% Other race alone 68 0.1% American Indian alone 31 0.06% Native Hawaiian and Other
25,403 39.3% White alone 19,781 30.6% Asian alone 9,247 14.3% Black alone 3,469 5.4% Hispanic 3,520 5.4% Two or more races 3,298 5.1% Other race alone
2000 2022
5,198,359 81.9% White alone 428,729 6.8% Hispanic 318,329 5.0% Black alone 236,786 3.7% Asian alone 110,338 1.7% Two or more races 43,586 0.7% Other race alone 11,264 0.2% American Indian alone 1,706 0.03% Native Hawaiian and Other
4,676,627 67.0% White alone 911,038 13.0% Hispanic 501,463 7.2% Asian alone 459,740 6.6% Black alone 341,889 4.9% Two or more races 84,403 1.2% Other race alone 5,838 0.08% American Indian alone 976 0.01% Native Hawaiian and Other
Income and house value in Malden Median household income in 2022 $103,519 White non-Hispanic householders$99,049 Black householders$100,574 Asian householders$65,953 Some other race householders$155,053 Two or more races householders$87,213 Hispanic or Latino race householdersMedian 2022 house value $561,176 White Non-Hispanic householders$595,352 Black or African American householders$359,319 American Indian or Alaska Native householders $554,788 Asian householders$622,500 Some other race householders$658,911 Two or more races householders$587,047 Hispanic or Latino householders
Median age by race in Malden
40.1 Median age for White residents35.4 44.7 35.9 Median age for Black or African American residents36.3 35.3 63.1 Median age for American Indian / Alaska Native residents-666,666,666.0 -666,666,666.0 35.2 Median age for Asian residents30.8 38.2 -666,666,666.0 Median age for Native Hawaiian / Pacific Islander residents-666,666,666.0 -666,666,666.0 41.7 Median age for Other race residents41.4 47.2 29.9 Median age for Two or more races residents26.9 32.6 41.4 Median age for White alone residents36.1 45.0 33.2 Median age for Hispanic or Latino residents25.4 39.3
Owner/renter occupied households by race in Malden
House owners and renters - White residents 5,962 47.1% Owner occupied6,691 52.9% Renter occupiedHouse owners and renters - Black or African American residents 1,611 49.5% Owner occupied1,644 50.5% Renter occupiedHouse owners and renters - American Indian / Alaska Native residents 56 100.0% Renter occupiedHouse owners and renters - Asian residents 4,014 58.4% Owner occupied2,863 41.6% Renter occupiedHouse owners and renters - Other race residents 164 9.4% Owner occupied1,574 90.6% Renter occupiedHouse owners and renters - Two or more races residents 432 35.5% Owner occupied786 64.5% Renter occupiedHouse owners and renters - White alone residents 5,864 47.0% Owner occupied6,601 53.0% Renter occupiedHouse owners and renters - Hispanic or Latino residents 287 30.6% Owner occupied651 69.4% Renter occupied
Language usage in Malden
English speakers - Total 48.3% of residents of Malden speak English at home.
3.9% of residents speak Spanish at home 2,130 87.2% Speak English very well313 12.8% Speak English less than very well47.8% of residents speak other language at home 12,257 41.3% Speak English very well17,451 58.7% Speak English less than very well
English speakers - Born in the United States 85.4% of residents of Malden speak English at home.
3.4% of residents speak Spanish at home 380 100.0% Speak English very well11.2% of residents speak other language at home 253 20.0% Speak English very well1,013 80.0% Speak English less than very well
English speakers - Native, born elsewhere 34.9% of residents of Malden speak English at home.
22.4% of residents speak Spanish at home 172 100.0% Speak English very well42.7% of residents speak other language at home 328 100.0% Speak English less than very well
English speakers - Foreign-born 5.3% of residents of Malden speak English at home.
4.7% of residents speak Spanish at home 945 75.1% Speak English very well313 24.9% Speak English less than very well90.0% of residents speak other language at home 9,064 38.0% Speak English very well14,804 62.0% Speak English less than very well
White (Caucasian) - Speak only English Native:
95.7% (19,852)Foreign-born:
5.3% (258)
White (Caucasian) - Speak another language Native:
4.3% (889)Foreign-born:
94.7% (4,603)
Black or African American - Speak only English Native:
76.6% (3,964)Foreign-born:
12.6% (393)
Black or African American - Speak another language Native:
23.4% (1,208)Foreign-born:
87.4% (2,716)
American Indian / Alaska Native - Speak another language Native:
100.0% (8)Foreign-born:
100.0% (141)
Asian - Speak only English Native:
46.5% (2,995)Foreign-born:
4.4% (560)
Asian - Speak another language Native:
53.5% (3,448)Foreign-born:
95.6% (12,206)
Other race - Speak only English Native:
38.5% (439)Foreign-born:
5.4% (79)
Other race - Speak another language Native:
60.1% (685)Foreign-born:
94.4% (1,374)
Two or more races - Speak only English Native:
56.4% (1,089)Foreign-born:
6.8% (189)
Two or more races - Speak another language Native:
43.6% (842)Foreign-born:
93.2% (2,602)
White alone - Speak only English Native:
97.6% (19,679)Foreign-born:
4.1% (197)
White alone - Speak another language Native:
2.4% (488)Foreign-born:
95.9% (4,603)
Hispanic or Latino - Speak only English Native:
48.4% (987)Foreign-born:
4.6% (61)
Hispanic or Latino - Speak another language Native:
51.6% (1,052)Foreign-born:
95.4% (1,258)
Foreign-born residents in Malden 27,879 residents are foreign born (20.8% Asia , 14.2% Latin America ).
This city:
42.7%Massachusetts:
17.6%
Marital status for residents in Malden Marital status - White (Caucasian) population 15 years and over
Males 59.9% Never married31.8% Now married2.8% Separated1.1% Widowed4.4% DivorcedFemales 38.1% Never married45.0% Now married0.0% Separated7.2% Widowed9.8% DivorcedWomen who gave birth in the past 12 months Now married:
85.7% (138)Unmarried:
14.3% (23)
Women who did not give birth in the past 12 months Now married:
40.9% (2,561)Unmarried:
59.1% (3,695)
Marital status - Black or African American population 15 years and over
Males 46.3% Never married47.1% Now married1.8% Separated0.0% Widowed4.8% DivorcedFemales 42.9% Never married41.1% Now married1.5% Separated2.4% Widowed12.1% DivorcedWomen who gave birth in the past 12 months Now married:
100.0% (180)Unmarried:
0.0% (0)
Women who did not give birth in the past 12 months Now married:
35.0% (615)Unmarried:
65.0% (1,143)
Marital status - American Indian / Alaska Native population 15 years and over
Males 71.4% Never married28.6% Now married0.0% Separated0.0% Widowed0.0% DivorcedFemales 22.6% Never married77.4% Now married0.0% Separated0.0% Widowed0.0% DivorcedWomen who did not give birth in the past 12 months Now married:
0.0% (0)Unmarried:
100.0% (17)
Marital status - Asian population 15 years and over
Males 41.0% Never married55.1% Now married0.0% Separated1.3% Widowed2.6% DivorcedFemales 28.3% Never married61.4% Now married3.2% Separated0.9% Widowed6.2% DivorcedWomen who gave birth in the past 12 months Now married:
97.5% (317)Unmarried:
2.5% (8)
Women who did not give birth in the past 12 months Now married:
60.4% (2,997)Unmarried:
39.6% (1,966)
Marital status - Other race population 15 years and over
Males 45.8% Never married47.3% Now married0.0% Separated0.0% Widowed7.0% DivorcedFemales 38.8% Never married50.4% Now married5.1% Separated0.0% Widowed5.8% DivorcedWomen who gave birth in the past 12 months Now married:
100.0% (70)Unmarried:
0.0% (0)
Women who did not give birth in the past 12 months Now married:
46.0% (365)Unmarried:
54.0% (430)
Marital status - Two or more races population 15 years and over
Males 55.7% Never married35.5% Now married4.4% Separated0.8% Widowed3.5% DivorcedFemales 43.6% Never married43.8% Now married0.0% Separated4.3% Widowed8.3% DivorcedWomen who gave birth in the past 12 months Now married:
100.0% (150)Unmarried:
0.0% (0)
Women who did not give birth in the past 12 months Now married:
38.7% (863)Unmarried:
61.3% (1,367)
Marital status - White alone, not Hispanic / Latino population 15 years and over
Males 59.9% Never married31.7% Now married2.8% Separated1.2% Widowed4.4% DivorcedFemales 36.6% Never married46.3% Now married0.0% Separated7.0% Widowed10.1% DivorcedWomen who gave birth in the past 12 months Now married:
82.4% (109)Unmarried:
17.6% (23)
Women who did not give birth in the past 12 months Now married:
41.2% (2,371)Unmarried:
58.8% (3,389)
Marital status - Hispanic or Latino population 15 years and over
Males 50.4% Never married44.0% Now married1.4% Separated0.0% Widowed4.3% DivorcedFemales 44.4% Never married39.3% Now married3.6% Separated3.1% Widowed9.6% DivorcedWomen who gave birth in the past 12 months Now married:
100.0% (188)Unmarried:
0.0% (0)
Women who did not give birth in the past 12 months Now married:
31.4% (548)Unmarried:
68.6% (1,196)
Ancestries in Malden
2,724 7.1% Brazilian2,603 6.8% Haitian2,270 5.9% Italian2,203 5.7% Irish1,626 4.2% American1,120 2.9% Ethiopian541 1.4% English415 1.1% Albanian409 1.1% Moroccan374 1.0% Yugoslavian345 0.9% Polish306 0.8% African302 0.8% Turkish281 0.7% Jamaican267 0.7% German265 0.7% French Canadian238 0.6% Portuguese203 0.5% Serbian187 0.5% Ukrainian180 0.5% French161 0.4% Russian150 0.4% Arab121 0.3% Bulgarian111 0.3% Greek89 0.2% Armenian80 0.2% Syrian79 0.2% Scottish74 0.2% Iranian72 0.2% European71 0.2% Eastern European61 0.2% Canadian54 0.1% Cape Verdean51 0.1% Liberian41 0.1% British West Indian41 0.1% Egyptian40 0.1% Ghanaian39 0.1% Finnish33 0.09% British31 0.08% Trinidadian and Tobagonian29 0.08% Palestinian28 0.07% Guyanese23 0.06% Pennsylvania German22 0.06% Nigerian19 0.05% Dutch18 0.05% Dutch West Indian9 0.02% Hungarian8 0.02% Kenyan7 0.02% Czech6 0.02% Slavic2 0.01% Swedish2 0.01% Scandinavian
Geographical mobility in Malden Same house 1 year ago 23,280 89.2% White (Caucasian)7,456 90.7% Black or African American164 100.0% American Indian / Alaska Native16,865 85.5% Asian2,230 81.4% Other race5,030 79.6% Two or more races22,627 89.2% White alone, not Hispanic / Latino4,616 77.6% Hispanic or LatinoMoved within same county 1,187 4.5% White / Caucasian416 5.1% Black or African American1,003 5.1% Asian256 9.3% Other race813 12.9% Two or more races1,094 4.3% White alone, not Hispanic / Latino818 13.7% Hispanic or LatinoMoved within same state 1,113 4.3% White / Caucasian338 4.1% Black or African American72 0.4% Asian18 0.7% Other race348 5.5% Two or more races1,113 4.4% White alone, not Hispanic / Latino406 6.8% Hispanic or LatinoMoved from different state 335 1.3% White / Caucasian13 0.2% Black or African American1,524 7.7% Asian174 6.4% Other race36 0.6% Two or more races335 1.3% White alone, not Hispanic / Latino11 0.2% Hispanic or LatinoMoved from abroad 193 0.7% White126 1.5% Black or African American270 1.4% Asian50 1.8% Other race18 0.3% Two or more races193 0.8% White alone, not Hispanic / Latino
Children Nativity (place of birth) in Malden
Children under 6 years - Living with two parents Both parents native 1,210 100.0% NativeBoth parents foreign-born 554 47.2% Native619 52.8% Foreign-bornOne native, one foreign-born parent 333 100.0% NativeChildren under 6 years - Living with one parent Native parent 443 100.0% NativeForeign-born parent 111 100.0% NativeChildren 6 to 17 years - Living with two parents Both parents native 934 100.0% NativeBoth parents foreign-born 2,345 66.0% Native1,209 34.0% Foreign-bornOne native, one foreign-born parent 934 100.0% NativeChildren 6 to 17 years - Living with one parent Native parent 893 100.0% NativeForeign-born parent 1,319 54.3% Native1,112 45.7% Foreign-born
Place of birth for residents in Malden 14,059 Asia9,654 Americas9,581 Latin America7,982 Eastern Asia7,784 China4,476 South America3,358 Caribbean3,086 South Central Asia2,339 South Eastern Asia2,209 Europe1,956 Africa1,746 Central America1,304 Eastern Europe880 Eastern Africa696 Northern Africa641 Western Asia468 Southern Europe362 Northern Europe235 Western Africa74 Middle Africa73 Western Europe72 Northern America17 Southern Africa7,107 China3,803 Brazil3,030 Haiti1,906 India1,691 Vietnam1,105 El Salvador800 Ethiopia687 Nepal493 Morocco397 Guatemala396 Colombia359 Taiwan316 Hong Kong315 Pakistan283 Bosnia and Herzegovina267 Serbia254 Albania244 Philippines228 Italy225 Turkey223 Saudi Arabia185 Russia179 United Kingdom175 Korea174 Portugal173 Dominican Republic159 Mexico149 Ukraine146 Burma (Myanmar)146 Ireland131 Chile111 Cambodia103 Malaysia97 Iran89 Bulgaria82 Jamaica79 Algeria74 Cabo Verde73 Germany72 Canada70 Grenada70 Liberia65 Greece63 Eritrea58 Cameroon56 Kuwait54 Ghana51 Armenia50 Egypt49 Bangladesh49 Honduras46 Poland45 Azores Islands43 Argentina42 Peru41 Indonesia39 Ecuador36 Syria29 Uzbekistan24 Panama23 Azerbaijan23 Lebanon22 Japan20 Venezuela17 South Africa15 Democratic Republic of Congo (Zaire)13 Kenya10 Costa Rica10 Czechoslovakia8 England6 Hungary6 Nigeria3 Uganda1 Trinidad and Tobago
Grandparents responsible for own grandchildren in Malden
Grandparents (30 to 59 years) White / Caucasian 44 23.1% Responsible for grandchildren146 76.9% Not responsible for grandchildrenBlack or African American 59 100.0% Responsible for grandchildrenAsian 59 33.7% Responsible for grandchildren115 66.3% Not responsible for grandchildrenTwo or more races 8 11.9% Responsible for grandchildren59 88.1% Not responsible for grandchildrenWhite alone, not Hispanic / Latino 49 23.5% Responsible for grandchildren160 76.5% Not responsible for grandchildrenHispanic or Latino 27 100.0% Not responsible for grandchildrenGrandparents (60 years and over) White / Caucasian 12 4.1% Responsible for grandchildren278 95.9% Not responsible for grandchildrenBlack or African American 100 67.1% Responsible for grandchildren49 32.9% Not responsible for grandchildrenAsian 44 10.7% Responsible for grandchildren365 89.3% Not responsible for grandchildrenWhite alone, not Hispanic / Latino 12 4.4% Responsible for grandchildren256 95.6% Not responsible for grandchildrenHispanic or Latino 80 100.0% Not responsible for grandchildren