Races in Melrose, Massachusetts (MA) Detailed Stats
Data:
Races - White alone (%)
Races - White alone (% change since 2000)
Races - Black alone (%)
Races - Black alone (% change since 2000)
Races - American Indian alone (%)
Races - American Indian alone (% change since 2000)
Races - Asian alone (%)
Races - Asian alone (% change since 2000)
Races - Hispanic (%)
Races - Hispanic (% change since 2000)
Races - Native Hawaiian and Other Pacific Islander alone (%)
Races - Native Hawaiian and Other Pacific Islander alone (% change since 2000)
Races - Two or more races(%)
Races - Two or more races(% change since 2000)
Races - Other race alone (%)
Races - Other race alone (% change since 2000)
Racial diversity
Place of birth - Born in state of residence (%)
Place of birth - Born in state of residence (%) - White
Place of birth - Born in state of residence (%) - Black or African American
Place of birth - Born in state of residence (%) - Asian
Place of birth - Born in state of residence (%) - Hispanic or Latino
Place of birth - Born in state of residence (%) - American Indian and Alaska Native
Place of birth - Born in state of residence (%) - Multirace
Place of birth - Born in state of residence (%) - Other Race
Place of birth - Born in other state (%)
Place of birth - Born in other state (%) - White
Place of birth - Born in other state (%) - Black or African American
Place of birth - Born in other state (%) - Asian
Place of birth - Born in other state (%) - Hispanic or Latino
Place of birth - Born in other state (%) - American Indian and Alaska Native
Place of birth - Born in other state (%) - Multirace
Place of birth - Born in other state (%) - Other Race
Place of birth - Native, outside of US (%)
Place of birth - Native, outside of US (%) - White
Place of birth - Native, outside of US (%) - Black or African American
Place of birth - Native, outside of US (%) - Asian
Place of birth - Native, outside of US (%) - Hispanic or Latino
Place of birth - Native, outside of US (%) - American Indian and Alaska Native
Place of birth - Native, outside of US (%) - Multirace
Place of birth - Native, outside of US (%) - Other Race
Place of birth - Foreign born (%)
Place of birth - Foreign born (%) - White
Place of birth - Foreign born (%) - Black or African American
Place of birth - Foreign born (%) - Asian
Place of birth - Foreign born (%) - Hispanic or Latino
Place of birth - Foreign born (%) - American Indian and Alaska Native
Place of birth - Foreign born (%) - Multirace
Place of birth - Foreign born (%) - Other Race
Residents speaking English at home (%)
Residents speaking English at home - Born in the United States (%)
Residents speaking English at home - Native, born elsewhere (%)
Residents speaking English at home - Foreign born (%)
Residents speaking Spanish at home (%)
Residents speaking Spanish at home - Born in the United States (%)
Residents speaking Spanish at home - Native, born elsewhere (%)
Residents speaking Spanish at home - Foreign born (%)
Residents speaking other language at home (%)
Residents speaking other language at home - Born in the United States (%)
Residents speaking other language at home - Native, born elsewhere (%)
Residents speaking other language at home - Foreign born (%)
Marital status - Never married (%)
Marital status - Now married (%)
Marital status - Separated (%)
Marital status - Widowed (%)
Marital status - Divorced (%)
Ancestries Reported - Arab (%)
Ancestries Reported - Czech (%)
Ancestries Reported - Danish (%)
Ancestries Reported - Dutch (%)
Ancestries Reported - English (%)
Ancestries Reported - French (%)
Ancestries Reported - French Canadian (%)
Ancestries Reported - German (%)
Ancestries Reported - Greek (%)
Ancestries Reported - Hungarian (%)
Ancestries Reported - Irish (%)
Ancestries Reported - Italian (%)
Ancestries Reported - Lithuanian (%)
Ancestries Reported - Norwegian (%)
Ancestries Reported - Polish (%)
Ancestries Reported - Portuguese (%)
Ancestries Reported - Russian (%)
Ancestries Reported - Scotch-Irish (%)
Ancestries Reported - Scottish (%)
Ancestries Reported - Slovak (%)
Ancestries Reported - Subsaharan African (%)
Ancestries Reported - Swedish (%)
Ancestries Reported - Swiss (%)
Ancestries Reported - Ukrainian (%)
Ancestries Reported - United States (%)
Ancestries Reported - Welsh (%)
Ancestries Reported - West Indian (%)
Ancestries Reported - Other (%)
Geographical mobility - Same house 1 year ago (%)
Geographical mobility - Same house 1 year ago (%) - White
Geographical mobility - Same house 1 year ago (%) - Black or African American
Geographical mobility - Same house 1 year ago (%) - Asian
Geographical mobility - Same house 1 year ago (%) - Hispanic or Latino
Geographical mobility - Same house 1 year ago (%) - American Indian and Alaska Native
Geographical mobility - Same house 1 year ago (%) - Multirace
Geographical mobility - Same house 1 year ago (%) - Other Race
Geographical mobility - Moved within same county (%)
Geographical mobility - Moved within same county (%) - White
Geographical mobility - Moved within same county (%) - Black or African American
Geographical mobility - Moved within same county (%) - Asian
Geographical mobility - Moved within same county (%) - Hispanic or Latino
Geographical mobility - Moved within same county (%) - American Indian and Alaska Native
Geographical mobility - Moved within same county (%) - Multirace
Geographical mobility - Moved within same county (%) - Other Race
Geographical mobility - Moved from different county within same state (%)
Geographical mobility - Moved from different county within same state (%) - White
Geographical mobility - Moved from different county within same state (%) - Black or African American
Geographical mobility - Moved from different county within same state (%) - Asian
Geographical mobility - Moved from different county within same state (%) - Hispanic or Latino
Geographical mobility - Moved from different county within same state (%) - American Indian and Alaska Native
Geographical mobility - Moved from different county within same state (%) - Multirace
Geographical mobility - Moved from different county within same state (%) - Other Race
Geographical mobility - Moved from different state (%)
Geographical mobility - Moved from different state (%) - White
Geographical mobility - Moved from different state (%) - Black or African American
Geographical mobility - Moved from different state (%) - Asian
Geographical mobility - Moved from different state (%) - Hispanic or Latino
Geographical mobility - Moved from different state (%) - American Indian and Alaska Native
Geographical mobility - Moved from different state (%) - Multirace
Geographical mobility - Moved from different state (%) - Other Race
Geographical mobility - Moved from abroad (%)
Geographical mobility - Moved from abroad (%) - White
Geographical mobility - Moved from abroad (%) - Black or African American
Geographical mobility - Moved from abroad (%) - Asian
Geographical mobility - Moved from abroad (%) - Hispanic or Latino
Geographical mobility - Moved from abroad (%) - American Indian and Alaska Native
Geographical mobility - Moved from abroad (%) - Multirace
Geographical mobility - Moved from abroad (%) - Other Race
Place of birth for the foreign-born population - Ireland (%)
Place of birth for the foreign-born population - Denmark (%)
Place of birth for the foreign-born population - Norway (%)
Place of birth for the foreign-born population - Sweden (%)
Place of birth for the foreign-born population - United Kingdom (%)
Place of birth for the foreign-born population - England (%)
Place of birth for the foreign-born population - Scotland (%)
Place of birth for the foreign-born population - Other Northern Europe (%)
Place of birth for the foreign-born population - Austria (%)
Place of birth for the foreign-born population - Belgium (%)
Place of birth for the foreign-born population - France (%)
Place of birth for the foreign-born population - Germany (%)
Place of birth for the foreign-born population - Netherlands (%)
Place of birth for the foreign-born population - Switzerland (%)
Place of birth for the foreign-born population - Other Western Europe (%)
Place of birth for the foreign-born population - Greece (%)
Place of birth for the foreign-born population - Italy (%)
Place of birth for the foreign-born population - Portugal (%)
Place of birth for the foreign-born population - Spain (%)
Place of birth for the foreign-born population - Other Southern Europe (%)
Place of birth for the foreign-born population - Albania (%)
Place of birth for the foreign-born population - Belarus (%)
Place of birth for the foreign-born population - Bosnia and Herzegovina (%)
Place of birth for the foreign-born population - Bulgaria (%)
Place of birth for the foreign-born population - Croatia (%)
Place of birth for the foreign-born population - Czechoslovakia (%)
Place of birth for the foreign-born population - Hungary (%)
Place of birth for the foreign-born population - Latvia (%)
Place of birth for the foreign-born population - Lithuania (%)
Place of birth for the foreign-born population - North Macedonia (Macedonia) (%)
Place of birth for the foreign-born population - Moldova (%)
Place of birth for the foreign-born population - Poland (%)
Place of birth for the foreign-born population - Romania (%)
Place of birth for the foreign-born population - Russia (%)
Place of birth for the foreign-born population - Serbia (%)
Place of birth for the foreign-born population - Ukraine (%)
Place of birth for the foreign-born population - Other Eastern Europe (%)
Place of birth for the foreign-born population - China (%)
Place of birth for the foreign-born population - Hong Kong (%)
Place of birth for the foreign-born population - Taiwan (%)
Place of birth for the foreign-born population - Japan (%)
Place of birth for the foreign-born population - Korea (%)
Place of birth for the foreign-born population - Other Eastern Asia (%)
Place of birth for the foreign-born population - Afghanistan (%)
Place of birth for the foreign-born population - Bangladesh (%)
Place of birth for the foreign-born population - India (%)
Place of birth for the foreign-born population - Iran (%)
Place of birth for the foreign-born population - Kazakhstan (%)
Place of birth for the foreign-born population - Nepal (%)
Place of birth for the foreign-born population - Pakistan (%)
Place of birth for the foreign-born population - Sri Lanka (%)
Place of birth for the foreign-born population - Uzbekistan (%)
Place of birth for the foreign-born population - Other South Central Asia (%)
Place of birth for the foreign-born population - Burma (%)
Place of birth for the foreign-born population - Cambodia (%)
Place of birth for the foreign-born population - Indonesia (%)
Place of birth for the foreign-born population - Laos (%)
Place of birth for the foreign-born population - Malaysia (%)
Place of birth for the foreign-born population - Philippines (%)
Place of birth for the foreign-born population - Singapore (%)
Place of birth for the foreign-born population - Thailand (%)
Place of birth for the foreign-born population - Vietnam (%)
Place of birth for the foreign-born population - Other South Eastern Asia (%)
Place of birth for the foreign-born population - Armenia (%)
Place of birth for the foreign-born population - Iraq (%)
Place of birth for the foreign-born population - Israel (%)
Place of birth for the foreign-born population - Jordan (%)
Place of birth for the foreign-born population - Kuwait (%)
Place of birth for the foreign-born population - Lebanon (%)
Place of birth for the foreign-born population - Saudi Arabia (%)
Place of birth for the foreign-born population - Syria (%)
Place of birth for the foreign-born population - Turkey (%)
Place of birth for the foreign-born population - Yemen (%)
Place of birth for the foreign-born population - Other Western Asia (%)
Place of birth for the foreign-born population - Eritrea (%)
Place of birth for the foreign-born population - Ethiopia (%)
Place of birth for the foreign-born population - Kenya (%)
Place of birth for the foreign-born population - Somalia (%)
Place of birth for the foreign-born population - Uganda (%)
Place of birth for the foreign-born population - Zimbabwe (%)
Place of birth for the foreign-born population - Other Eastern Africa (%)
Place of birth for the foreign-born population - Cameroon (%)
Place of birth for the foreign-born population - Congo (%)
Place of birth for the foreign-born population - Democratic Republic of Congo (Zaire) (%)
Place of birth for the foreign-born population - Other Middle Africa (%)
Place of birth for the foreign-born population - Egypt (%)
Place of birth for the foreign-born population - Morocco (%)
Place of birth for the foreign-born population - Sudan (%)
Place of birth for the foreign-born population - Other Northern Africa (%)
Place of birth for the foreign-born population - South Africa (%)
Place of birth for the foreign-born population - Other Southern Africa (%)
Place of birth for the foreign-born population - Cabo Verde (%)
Place of birth for the foreign-born population - Ghana (%)
Place of birth for the foreign-born population - Liberia (%)
Place of birth for the foreign-born population - Nigeria (%)
Place of birth for the foreign-born population - Senegal (%)
Place of birth for the foreign-born population - Sierra Leone (%)
Place of birth for the foreign-born population - Other Western Africa (%)
Place of birth for the foreign-born population - Australia (%)
Place of birth for the foreign-born population - New Zealand (%)
Place of birth for the foreign-born population - Fiji (%)
Place of birth for the foreign-born population - Micronesia (%)
Place of birth for the foreign-born population - Bahamas (%)
Place of birth for the foreign-born population - Barbados (%)
Place of birth for the foreign-born population - Cuba (%)
Place of birth for the foreign-born population - Dominica (%)
Place of birth for the foreign-born population - Dominican Republic (%)
Place of birth for the foreign-born population - Grenada (%)
Place of birth for the foreign-born population - Haiti (%)
Place of birth for the foreign-born population - Jamaica (%)
Place of birth for the foreign-born population - St. Vincent and the Grenadines (%)
Place of birth for the foreign-born population - Trinidad and Tobago (%)
Place of birth for the foreign-born population - West Indies (%)
Place of birth for the foreign-born population - Other Caribbean (%)
Place of birth for the foreign-born population - Belize (%)
Place of birth for the foreign-born population - Costa Rica (%)
Place of birth for the foreign-born population - El Salvador (%)
Place of birth for the foreign-born population - Guatemala (%)
Place of birth for the foreign-born population - Honduras (%)
Place of birth for the foreign-born population - Mexico (%)
Place of birth for the foreign-born population - Nicaragua (%)
Place of birth for the foreign-born population - Panama (%)
Place of birth for the foreign-born population - Other Central America (%)
Place of birth for the foreign-born population - Argentina (%)
Place of birth for the foreign-born population - Bolivia (%)
Place of birth for the foreign-born population - Brazil (%)
Place of birth for the foreign-born population - Chile (%)
Place of birth for the foreign-born population - Colombia (%)
Place of birth for the foreign-born population - Ecuador (%)
Place of birth for the foreign-born population - Guyana (%)
Place of birth for the foreign-born population - Peru (%)
Place of birth for the foreign-born population - Uruguay (%)
Place of birth for the foreign-born population - Venezuela (%)
Place of birth for the foreign-born population - Other South America (%)
Place of birth for the foreign-born population - Canada (%)
Place of birth for the foreign-born population - Other Northern America (%)
Place of birth for the foreign-born population - Other (%)
Latest news about races in Melrose, MA collected exclusively by city-data.com from local newspapers, TV, and radio stations
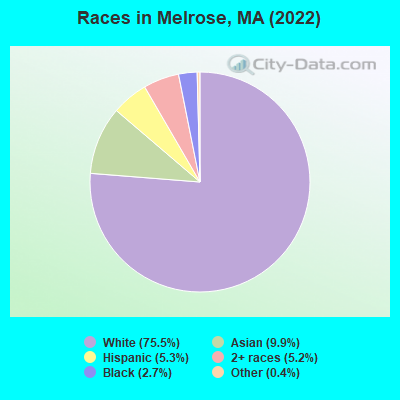
According to 2022 data, the most numerous races in Melrose, MA are White alone (22,170 residents), Hispanic (1,568 residents), and Asian alone (2,902 residents). 78.4% of Melrose residents speak English at home. 16.0% of Melrose, MA residents are foreign-born (6.3% born in Asia, 3.4% born in Latin America, 3.1% born in Europe, 2.2% born in Africa), which is 12.4% less than the foreign-born rate of 18.0% across the entire state of Massachusetts.
Race distribution in Melrose
2000 2022
5,198,359 81.9% White alone 428,729 6.8% Hispanic 318,329 5.0% Black alone 236,786 3.7% Asian alone 110,338 1.7% Two or more races 43,586 0.7% Other race alone 11,264 0.2% American Indian alone 1,706 0.03% Native Hawaiian and Other
4,676,627 67.0% White alone 911,038 13.0% Hispanic 501,463 7.2% Asian alone 459,740 6.6% Black alone 341,889 4.9% Two or more races 84,403 1.2% Other race alone 5,838 0.08% American Indian alone 976 0.01% Native Hawaiian and Other
Income and house value in Melrose Median household income in 2022 $130,255 White non-Hispanic householders$61,050 Black householders$104,125 Asian householders$101,607 Some other race householders$87,690 Two or more races householders$122,057 Hispanic or Latino race householdersMedian 2022 house value $778,050 White Non-Hispanic householders$842,045 Black or African American householders$574,122 American Indian or Alaska Native householders $885,832 Asian householdersover $1,000,000 Some other race householders$801,627 Two or more races householders$714,361 Hispanic or Latino householders
Median age by race in Melrose
45.6 Median age for White residents45.1 46.9 35.8 Median age for Black or African American residents29.3 50.5 -761,044,175.9 Median age for American Indian / Alaska Native residents-751,004,015.3 -1,078,313,251.9 37.5 Median age for Asian residents36.0 40.6 -514,227,641.8 Median age for Native Hawaiian / Pacific Islander residents-513,131,312.6 -508,717,948.2 54.5 Median age for Other race residents25.5 56.5 39.4 Median age for Two or more races residents38.2 41.2 45.6 Median age for White alone residents44.8 48.0 40.7 Median age for Hispanic or Latino residents37.7 44.4
Owner/renter occupied households by race in Melrose
House owners and renters - White residents 6,821 69.4% Owner occupied3,003 30.6% Renter occupiedHouse owners and renters - Black or African American residents 82 23.4% Owner occupied268 76.6% Renter occupiedHouse owners and renters - Asian residents 624 70.0% Owner occupied268 30.0% Renter occupiedHouse owners and renters - Other race residents 61 20.2% Owner occupied241 79.8% Renter occupiedHouse owners and renters - Two or more races residents 368 52.4% Owner occupied335 47.6% Renter occupiedHouse owners and renters - White alone residents 6,749 69.1% Owner occupied3,014 30.9% Renter occupiedHouse owners and renters - Hispanic or Latino residents 245 43.2% Owner occupied322 56.8% Renter occupied
Language usage in Melrose
English speakers - Total 78.4% of residents of Melrose speak English at home.
4.5% of residents speak Spanish at home 955 76.8% Speak English very well289 23.2% Speak English less than very well16.6% of residents speak other language at home 3,067 66.4% Speak English very well1,551 33.6% Speak English less than very well
English speakers - Born in the United States 94.4% of residents of Melrose speak English at home.
2.3% of residents speak Spanish at home 118 89.4% Speak English very well14 10.6% Speak English less than very well2.7% of residents speak other language at home 154 100.0% Speak English very well
English speakers - Native, born elsewhere 56.9% of residents of Melrose speak English at home.
19.7% of residents speak Spanish at home 171 100.0% Speak English very well20.0% of residents speak other language at home 150 86.2% Speak English very well24 13.8% Speak English less than very well
English speakers - Foreign-born 16.9% of residents of Melrose speak English at home.
10.6% of residents speak Spanish at home 227 45.5% Speak English very well272 54.5% Speak English less than very well72.2% of residents speak other language at home 2,007 59.3% Speak English very well1,377 40.7% Speak English less than very well
White (Caucasian) - Speak only English Native:
96.1% (18,940)Foreign-born:
28.6% (487)
White (Caucasian) - Speak another language Native:
4.1% (807)Foreign-born:
71.3% (1,215)
Black or African American - Speak only English Native:
89.5% (491)Foreign-born:
7.5% (17)
Black or African American - Speak another language Native:
7.9% (43)Foreign-born:
91.6% (203)
Asian - Speak only English Native:
60.7% (545)Foreign-born:
7.5% (135)
Asian - Speak another language Native:
39.3% (352)Foreign-born:
93.0% (1,672)
Other race - Speak only English Native:
32.1% (118)Foreign-born:
80.5% (71)
Other race - Speak another language Native:
64.7% (238)Foreign-born:
27.1% (24)
Two or more races - Speak only English Native:
63.5% (871)Foreign-born:
12.5% (110)
Two or more races - Speak another language Native:
37.3% (511)Foreign-born:
87.4% (771)
White alone - Speak only English Native:
96.0% (18,880)Foreign-born:
31.1% (487)
White alone - Speak another language Native:
4.0% (793)Foreign-born:
68.4% (1,073)
Hispanic or Latino - Speak only English Native:
40.4% (363)Foreign-born:
10.7% (60)
Hispanic or Latino - Speak another language Native:
58.8% (528)Foreign-born:
89.3% (500)
Foreign-born residents in Melrose 4,705 residents are foreign born (6.3% Asia , 3.4% Latin America , 3.1% Europe , 2.2% Africa ).
This city:
16.0%Massachusetts:
17.6%
Marital status for residents in Melrose Marital status - White (Caucasian) population 15 years and over
Males 32.7% Never married58.2% Now married0.3% Separated2.3% Widowed6.6% DivorcedFemales 23.7% Never married56.4% Now married1.3% Separated9.9% Widowed8.7% DivorcedWomen who gave birth in the past 12 months Now married:
94.0% (230)Unmarried:
6.0% (15)
Women who did not give birth in the past 12 months Now married:
56.0% (2,169)Unmarried:
44.0% (1,701)
Marital status - Black or African American population 15 years and over
Males 62.9% Never married36.1% Now married0.0% Separated0.0% Widowed1.0% DivorcedFemales 49.8% Never married40.4% Now married0.0% Separated0.0% Widowed9.7% DivorcedWomen who gave birth in the past 12 months Now married:
100.0% (16)Unmarried:
0.0% (0)
Women who did not give birth in the past 12 months Now married:
48.5% (63)Unmarried:
51.5% (67)
Marital status - Asian population 15 years and over
Males 47.2% Never married50.3% Now married0.0% Separated0.0% Widowed2.6% DivorcedFemales 19.2% Never married50.2% Now married1.2% Separated1.9% Widowed27.5% DivorcedWomen who gave birth in the past 12 months Now married:
100.0% (17)Unmarried:
0.0% (0)
Women who did not give birth in the past 12 months Now married:
64.6% (498)Unmarried:
35.4% (273)
Marital status - Other race population 15 years and over
Males 59.6% Never married40.4% Now married0.0% Separated0.0% Widowed0.0% DivorcedFemales 61.8% Never married19.1% Now married0.0% Separated19.1% Widowed0.0% DivorcedWomen who did not give birth in the past 12 months Now married:
21.6% (13)Unmarried:
78.4% (47)
Marital status - Two or more races population 15 years and over
Males 24.1% Never married61.0% Now married1.8% Separated13.0% Widowed0.0% DivorcedFemales 35.7% Never married48.3% Now married11.1% Separated0.0% Widowed4.8% DivorcedWomen who gave birth in the past 12 months Now married:
100.0% (27)Unmarried:
0.0% (0)
Women who did not give birth in the past 12 months Now married:
51.0% (337)Unmarried:
49.0% (324)
Marital status - White alone, not Hispanic / Latino population 15 years and over
Males 32.8% Never married57.8% Now married0.3% Separated2.4% Widowed6.7% DivorcedFemales 23.6% Never married56.2% Now married1.3% Separated10.1% Widowed8.8% DivorcedWomen who gave birth in the past 12 months Now married:
94.0% (235)Unmarried:
6.0% (15)
Women who did not give birth in the past 12 months Now married:
55.7% (2,126)Unmarried:
44.3% (1,690)
Marital status - Hispanic or Latino population 15 years and over
Males 44.0% Never married56.0% Now married0.0% Separated0.0% Widowed0.0% DivorcedFemales 43.1% Never married44.0% Now married0.0% Separated8.2% Widowed4.7% DivorcedWomen who did not give birth in the past 12 months Now married:
54.0% (187)Unmarried:
46.0% (159)
Ancestries in Melrose
2,859 22.8% Irish1,277 10.2% Italian983 7.8% Moroccan570 4.5% American494 3.9% English274 2.2% Polish272 2.2% European251 2.0% French Canadian181 1.4% German115 0.9% Brazilian111 0.9% Scottish100 0.8% Greek96 0.8% Haitian86 0.7% Eastern European77 0.6% Albanian74 0.6% Norwegian74 0.6% Russian54 0.4% Scotch-Irish53 0.4% Canadian52 0.4% Armenian49 0.4% Dutch47 0.4% Ghanaian47 0.4% Ukrainian43 0.3% French34 0.3% Iranian32 0.3% Romanian31 0.2% Scandinavian21 0.2% Cape Verdean19 0.2% South African17 0.1% Hungarian15 0.1% Lithuanian14 0.1% Slovak12 0.10% Kenyan11 0.09% Yugoslavian10 0.08% Pennsylvania German8 0.06% Welsh5 0.04% Jordanian4 0.03% British3 0.02% Portuguese
Geographical mobility in Melrose Same house 1 year ago 20,796 94.0% White (Caucasian)781 100.0% Black or African American2,736 94.4% Asian375 78.8% Other race2,219 90.5% Two or more races20,701 94.3% White alone, not Hispanic / Latino1,302 83.4% Hispanic or LatinoMoved within same county 570 2.6% White / Caucasian1 0.1% Black or African American12 65.7% American Indian / Alaska Native110 3.8% Asian106 4.3% Two or more races552 2.5% White alone, not Hispanic / Latino68 4.4% Hispanic or LatinoMoved within same state 535 2.4% White / Caucasian22 2.9% Black or African American14 0.5% Asian84 17.6% Other race23 1.0% Two or more races490 2.2% White alone, not Hispanic / Latino123 7.9% Hispanic or LatinoMoved from different state 126 0.6% White / Caucasian30 1.0% Asian28 5.8% Other race63 2.6% Two or more races125 0.6% White alone, not Hispanic / Latino39 2.5% Hispanic or LatinoMoved from abroad 152 0.7% White151 0.7% White alone, not Hispanic / Latino
Children Nativity (place of birth) in Melrose
Children under 6 years - Living with two parents Both parents native 1,144 100.0% NativeBoth parents foreign-born 265 93.6% Native18 6.4% Foreign-bornOne native, one foreign-born parent 191 100.0% NativeChildren under 6 years - Living with one parent Native parent 34 100.0% NativeChildren 6 to 17 years - Living with two parents Both parents native 2,378 99.5% Native13 0.5% Foreign-bornBoth parents foreign-born 588 96.2% Native23 3.8% Foreign-bornOne native, one foreign-born parent 485 100.0% NativeChildren 6 to 17 years - Living with one parent Native parent 312 100.0% NativeForeign-born parent 191 53.1% Native168 46.9% Foreign-born
Grandparents responsible for own grandchildren in Melrose
Grandparents (30 to 59 years) White / Caucasian 23 100.0% Not responsible for grandchildrenAsian 21 100.0% Not responsible for grandchildrenWhite alone, not Hispanic / Latino 25 100.0% Not responsible for grandchildrenGrandparents (60 years and over) White / Caucasian 15 9.5% Responsible for grandchildren141 90.5% Not responsible for grandchildrenAsian 220 100.0% Not responsible for grandchildrenWhite alone, not Hispanic / Latino 15 11.7% Responsible for grandchildren112 88.3% Not responsible for grandchildren