Races in Norfolk, Massachusetts (MA) Detailed Stats
Ancestries, Foreign-born residents, place of birth

Recent posts about races in Norfolk, Massachusetts on our local forum with over 2,400,000 registered users:
 | 2024 Real Estate Observations (909 replies) |
| Boston crime thread - all posts go here. (2509 replies) |
| 2023 Real Estate Observations (5278 replies) |
| Boston Racial Stigma- is it "cool" to hate on Boston? (632 replies) |
| towns that offer the most jobs per dollar of house (58 replies) |
| Norfolk schools (2 replies) |
Latest news about races in Norfolk, MA collected exclusively by city-data.com from local newspapers, TV, and radio stations
8.1% of Norfolk, MA residents are foreign-born (3.1% born in Latin America, 2.4% born in Europe, 1.5% born in Asia), which is 121.0% less than the foreign-born rate of 18.0% across the entire state of Massachusetts.
Race distribution in Norfolk

- 9,19987.9%White alone
- 5104.9%Hispanic
- 4934.7%Black alone
- 1231.2%Asian alone
- 930.9%Two or more races
- 180.2%Other race alone
- 240.2%American Indian alone

2000
2022
-
- 5,198,35981.9%White alone
- 428,7296.8%Hispanic
- 318,3295.0%Black alone
- 236,7863.7%Asian alone
- 110,3381.7%Two or more races
- 43,5860.7%Other race alone
- 11,2640.2%American Indian alone
- 1,7060.03%Native Hawaiian and Other
Pacific Islander alone

-
- 4,676,62767.0%White alone
- 911,03813.0%Hispanic
- 501,4637.2%Asian alone
- 459,7406.6%Black alone
- 341,8894.9%Two or more races
- 84,4031.2%Other race alone
- 5,8380.08%American Indian alone
- 9760.01%Native Hawaiian and Other
Pacific Islander alone

Income and house value in Norfolk
- Median household income in 2022
- $159,030White non-Hispanic householders
- over $200,000Black householders
- over $200,000American Indian and Alaska Native householders
- over $200,000Asian householders
- $146,571Two or more races householders
- $125,642Hispanic or Latino race householders
- Median 2022 house value
- $776,490White Non-Hispanic householders
- over $1,000,000Black or African American householders
- over $1,000,000Asian householders
- $682,013Two or more races householders
- $789,700Hispanic or Latino householders
Household income for White non-Hispanic householders

Household income for Black householders

Household income for American Indian and Alaska Native householders

Household income for Asian householders

Household income for Two or more races householders

Household income for Hispanic or Latino race householders

Foreign-born residents in Norfolk
852 residents are foreign born (3.1% Latin America, 2.4% Europe, 1.5% Asia).
| This city: | 8.1% |
| Massachusetts: | 12.2% |
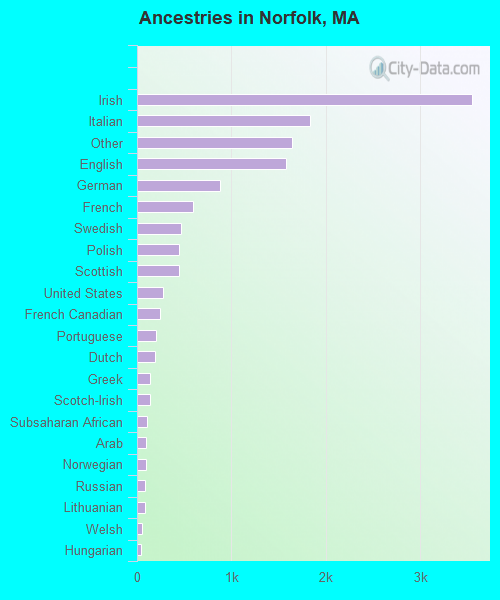
Ancestries in Norfolk

- 3,55226.8%Irish
- 1,83413.8%Italian
- 1,64112.4%Other
- 1,58311.9%English
- 8786.6%German
- 5984.5%French
- 4613.5%Swedish
- 4493.4%Polish
- 4443.3%Scottish
- 2762.1%United States
- 2391.8%French Canadian
- 2011.5%Portuguese
- 1901.4%Dutch
- 1431.1%Greek
- 1421.1%Scotch-Irish
- 1040.8%Subsaharan African
- 960.7%Arab
- 940.7%Norwegian
- 840.6%Russian
- 800.6%Lithuanian
- 500.4%Welsh
- 430.3%Hungarian
- 220.2%West Indian
- 180.1%Swiss
- 170.1%Danish
- 160.1%Ukrainian
Zip codes: 02056.