Races in Norwell, Massachusetts (MA) Detailed Stats
Ancestries, Foreign-born residents, place of birth

Recent posts about races in Norwell, Massachusetts on our local forum with over 2,400,000 registered users:
 | Nicer house in Pembroke or hold out for Norwell scituate duxbury? (72 replies) |
| Norwell, Cohasset, Scituate or Hanover? (26 replies) |
| 2023 Real Estate Observations (5278 replies) |
| towns that offer the most jobs per dollar of house (58 replies) |
| Duxbury or Norwell (32 replies) |
| 2021 Real Estate Observations (1729 replies) |
Latest news about races in Norwell, MA collected exclusively by city-data.com from local newspapers, TV, and radio stations
3.4% of Norwell, MA residents are foreign-born (1.6% born in Europe, 1.0% born in Asia), which is 429.4% less than the foreign-born rate of 18.0% across the entire state of Massachusetts.
Race distribution in Norwell

- 9,47897.1%White alone
- 1131.2%Asian alone
- 620.6%Hispanic
- 590.6%Two or more races
- 360.4%Black alone
- 120.1%Other race alone
- 50.05%American Indian alone

2000
2022
-
- 5,198,35981.9%White alone
- 428,7296.8%Hispanic
- 318,3295.0%Black alone
- 236,7863.7%Asian alone
- 110,3381.7%Two or more races
- 43,5860.7%Other race alone
- 11,2640.2%American Indian alone
- 1,7060.03%Native Hawaiian and Other
Pacific Islander alone

-
- 4,676,62767.0%White alone
- 911,03813.0%Hispanic
- 501,4637.2%Asian alone
- 459,7406.6%Black alone
- 341,8894.9%Two or more races
- 84,4031.2%Other race alone
- 5,8380.08%American Indian alone
- 9760.01%Native Hawaiian and Other
Pacific Islander alone

Income and house value in Norwell
- Median household income in 2022
- $162,736White non-Hispanic householders
- $26,841Black householders
- over $200,000Asian householders
- over $200,000Two or more races householders
- $34,610Hispanic or Latino race householders
- Median 2022 house value
- $996,244White Non-Hispanic householders
- $856,415Black or African American householders
- over $1,000,000Asian householders
- over $1,000,000Two or more races householders
- over $1,000,000Hispanic or Latino householders
Household income for White non-Hispanic householders

Household income for Black householders

Household income for Asian householders

Household income for Two or more races householders

Household income for Hispanic or Latino race householders

Foreign-born residents in Norwell
332 residents are foreign born (1.6% Europe, 1.0% Asia).
| This city: | 3.4% |
| Massachusetts: | 12.2% |
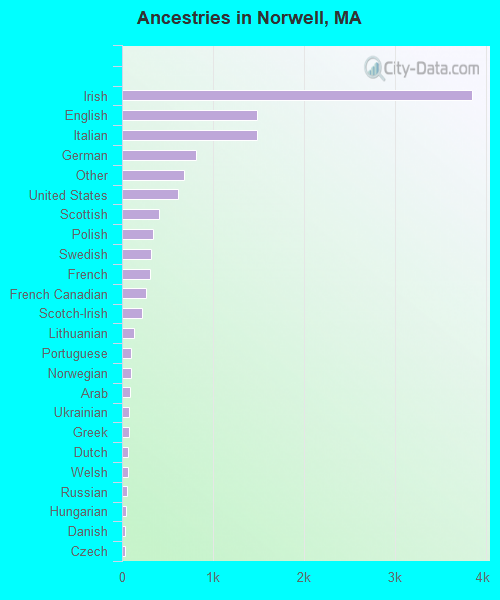
Ancestries in Norwell

- 3,84432.8%Irish
- 1,48912.7%English
- 1,48512.7%Italian
- 8157.0%German
- 6785.8%Other
- 6135.2%United States
- 4023.4%Scottish
- 3452.9%Polish
- 3142.7%Swedish
- 3132.7%French
- 2632.2%French Canadian
- 2171.9%Scotch-Irish
- 1341.1%Lithuanian
- 1020.9%Portuguese
- 1000.9%Norwegian
- 890.8%Arab
- 810.7%Ukrainian
- 720.6%Greek
- 680.6%Dutch
- 650.6%Welsh
- 510.4%Russian
- 390.3%Hungarian
- 370.3%Danish
- 360.3%Czech
- 340.3%Swiss
- 110.09%Subsaharan African
- 50.04%Slovak
Zip codes: 02061.